Harjobinangun Airbnb Market Analysis 2026: Short Term Rental Data & Vacation Rental Statistics in Special Region of Yogyakarta, Indonesia
Is Airbnb profitable in Harjobinangun in 2026? Explore comprehensive Airbnb analytics for Harjobinangun, Special Region of Yogyakarta, Indonesia to uncover income potential. This 2026 STR market report for Harjobinangun, based on AirROI data from February 2025 to January 2026, reveals key trends in the niche market of 20 active listings.
Whether you're considering an Airbnb investment in Harjobinangun, optimizing your existing vacation rental, or exploring rental arbitrage opportunities, understanding the Harjobinangun Airbnb data is crucial. Leveraging the low regulation environment is key to maximizing your short term rental income potential. Let's dive into the specifics.
Key Harjobinangun Airbnb Performance Metrics Overview
Monthly Airbnb Revenue Variations & Income Potential in Harjobinangun (2026)
Understanding the monthly revenue variations for Airbnb listings in Harjobinangun is key to maximizing your short term rental income potential. Seasonality significantly impacts earnings. Our analysis, based on data from the past 12 months, shows that the peak revenue month for STRs in Harjobinangun is typically August, while March often presents the lowest earnings, highlighting opportunities for strategic pricing adjustments during shoulder and low seasons. Explore the typical Airbnb income in Harjobinangun across different performance tiers:
- Best-in-class properties (Top 10%) achieve $1,058+ monthly, often utilizing dynamic pricing and superior guest experiences.
- Strong performing properties (Top 25%) earn $571 or more, indicating effective management and desirable locations/amenities.
- Typical properties (Median) generate around $306 per month, representing the average market performance.
- Entry-level properties (Bottom 25%) see earnings around $134, often with potential for optimization.
Average Monthly Airbnb Earnings Trend in Harjobinangun
Harjobinangun Airbnb Occupancy Rate Trends (2026)
Maximize your bookings by understanding the Harjobinangun STR occupancy trends. Seasonal demand shifts significantly influence how often properties are booked. Typically, Julysees the highest demand (peak season occupancy), while March experiences the lowest (low season). Effective strategies, like adjusting minimum stays or offering promotions, can boost occupancy during slower periods. Here's how different property tiers perform in Harjobinangun:
- Best-in-class properties (Top 10%) achieve 44%+ occupancy, indicating high desirability and potentially optimized availability.
- Strong performing properties (Top 25%) maintain 33% or higher occupancy, suggesting good market fit and guest satisfaction.
- Typical properties (Median) have an occupancy rate around 18%.
- Entry-level properties (Bottom 25%) average 9% occupancy, potentially facing higher vacancy.
Average Monthly Occupancy Rate Trend in Harjobinangun
Average Daily Rate (ADR) Airbnb Trends in Harjobinangun (2026)
Effective short term rental pricing strategy in Harjobinangun involves understanding monthly ADR fluctuations. The Average Daily Rate (ADR) for Airbnb in Harjobinangun typically peaks in June and dips lowest during January. Leveraging Airbnb dynamic pricing tools or strategies based on this seasonality can significantly boost revenue. Here's a look at the typical nightly rates achieved:
- Best-in-class properties (Top 10%) command rates of $169+ per night, often due to premium features or locations.
- Strong performing properties (Top 25%) achieve nightly rates of $113 or more.
- Typical properties (Median) charge around $47 per night.
- Entry-level properties (Bottom 25%) earn around $25 per night.
Average Daily Rate (ADR) Trend by Month in Harjobinangun
Get Live Harjobinangun Market Intelligence 👇
Explore Real-time Analytics
Airbnb Seasonality Analysis & Trends in Harjobinangun (2026)
Peak Season (August, July, May)
- Revenue averages $655 per month
- Occupancy rates average 29.4%
- Daily rates average $79
Shoulder Season
- Revenue averages $484 per month
- Occupancy maintains around 20.9%
- Daily rates hold near $74
Low Season (January, February, March)
- Revenue drops to average $314 per month
- Occupancy decreases to average 19.1%
- Daily rates adjust to average $73
Seasonality Insights for Harjobinangun
- The Airbnb seasonality in Harjobinangun shows highly seasonal trends requiring careful strategy. While the sections above show seasonal averages, it's also insightful to look at the extremes:
- During the high season, the absolute peak month showcases Harjobinangun's highest earning potential, with monthly revenues capable of climbing to $834, occupancy reaching a high of 32.0%, and ADRs peaking at $83.
- Conversely, the slowest single month of the year, typically falling within the low season, marks the market's lowest point. In this month, revenue might dip to $241, occupancy could drop to 15.4%, and ADRs may adjust down to $68.
- Understanding both the seasonal averages and these monthly peaks and troughs in revenue, occupancy, and ADR is crucial for maximizing your Airbnb profit potential in Harjobinangun.
Seasonal Strategies for Maximizing Profit
- Peak Season: Maximize revenue through premium pricing and potentially longer minimum stays. Ensure high availability.
- Low Season: Offer competitive pricing, special promotions (e.g., extended stay discounts), and flexible cancellation policies. Target off-season travelers like remote workers or budget-conscious guests.
- Shoulder Seasons: Implement dynamic pricing that balances peak and low rates. Target weekend travelers or specific events. Offer slightly more flexible terms than peak season.
- Regularly analyze your own performance against these Harjobinangun seasonality benchmarks and adjust your pricing and availability strategy accordingly.
Best Areas for Airbnb Investment in Harjobinangun (2026)
Exploring the top neighborhoods for short-term rentals in Harjobinangun? This section highlights key areas, outlining why they are attractive for hosts and guests, along with notable local attractions. Consider these locations based on your target guest profile and investment strategy.
| Neighborhood / Area | Why Host Here? (Target Guests & Appeal) | Key Attractions & Landmarks |
|---|---|---|
| Borobudur | Home to the famous Borobudur Temple, this area attracts tourists from all over the world. It offers a unique cultural and historical experience, ideal for Airbnb hosts looking to capitalize on heritage tourism. | Borobudur Temple, Pawon Temple, Mendut Temple, Borobudur Sunrise Tour, Javanese Culture Workshops |
| Yogyakarta City Center | The vibrant heart of Yogyakarta, filled with local markets, restaurants, and cultural sites. An excellent location for guests wanting to explore Yogyakarta's rich culture and history. | Malioboro Street, Palace of Yogyakarta, Taman Sari Water Castle, Batik Workshops, Local Street Food |
| Prambanan | Famous for its stunning temples, Prambanan attracts visitors looking for cultural and spiritual experiences. This area is great for Airbnb listings that cater to families and researchers alike. | Prambanan Temple, Roro Jonggrang Legend, Cultural Performances, Happy Sunsets at Prambanan |
| Mount Merapi | A popular destination for adventure seekers and nature lovers, this area offers outdoor activities and stunning views. Hosts can market unique stays with a nature focus and experiences like hiking. | Mount Merapi Tours, Volcano Jeep Tours, Cultural Villages, Local Coffee Plantations |
| Kaliurang | A cooler mountain resort area just outside Yogyakarta, it's ideal for guests looking for a getaway. Known for its natural beauty and cool climate, it is perfect for retreats. | Kaliurang Park, Museum of Mount Merapi, Nature Trekking Trails, Cottage Rentals |
| Timang Beach | A scenic beach destination known for its beauty and adventurous activities. Attracts tourists interested in beach vacations and adventure sports. | Timang Beach, Timang Island Gondola, Local Seafood Restaurants, Rock Climbing |
| Sleman | An area known for its local villages and family-friendly atmosphere. Perfect for hosts who wish to provide local experiences and traditional hospitality. | Local Markets, Traditional Crafts, Village Tours, Culinary Experiences |
| Imogiri | Famous for its cultural significance and beautiful landscapes, Imogiri is a unique location for Airbnb. It offers quiet retreats away from the hustle of city life. | Imogiri Cemetery, Pine Forest, Cultural Heritage Sites, Local Craft Workshops |
Understanding Airbnb License Requirements & STR Laws in Harjobinangun (2026)
While Harjobinangun, Special Region of Yogyakarta, Indonesia currently shows low STR regulations, specific Airbnb license requirements might still exist or change. Always verify the latest short term rental regulations and Airbnb license requirements directly with local government authorities for Harjobinangun to ensure full compliance before hosting.
(Source: AirROI data, 2026, finding no licensed listings among those analyzed)
Top Performing Airbnb Properties in Harjobinangun (2026)
Benchmark your potential! Explore examples of top-performing Airbnb properties in Harjobinangunbased on Trailing Twelve Month (TTM) revenue. Analyze their characteristics, revenue, occupancy rate, and ADR to understand what drives success in this market.

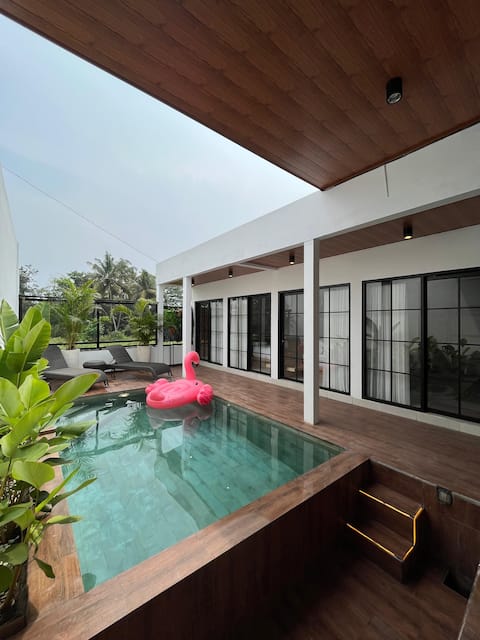
Villa 1Bedroom with Private Pool
Entire Place • 1 bedroom

Villa Padi Pakem 1 villa 4 bedrooms private pool
Entire Place • 4 bedrooms

Adine's 4BR villa - Joglo, pool and Panoramic View
Entire Place • 4 bedrooms
To Villa Queensland 2
Entire Place • 2 bedrooms

Full house & area for you (4BR) TEDUH Villa Jogja
Entire Place • 4 bedrooms

Family Villa with Private Pool and Amazing View
Entire Place • 6 bedrooms
Note: Performance varies based on location, size, amenities, seasonality, and management quality. Data reflects the past 12 months.
Top Performing Airbnb Hosts in Harjobinangun (2026)
Learn from the best! This table showcases top-performing Airbnb hosts in Harjobinangun based on the number of properties managed and estimated total revenue over the past year. Analyze their scale and performance metrics.
| Host Name | Properties | Grossing Revenue | Stay Reviews | Avg Rating |
|---|---|---|---|---|
| Villa Padi | 2 | $23,927 | 59 | 4.75/5.0 |
| Celica | 6 | $12,512 | 33 | 5.00/5.0 |
| Adi | 1 | $9,819 | 48 | 4.85/5.0 |
| Syam | 3 | $7,103 | 101 | 4.81/5.0 |
| Dwi | 1 | $4,908 | 2 | Not Rated |
| Athoillah | 1 | $3,088 | 9 | 4.44/5.0 |
| Nino | 1 | $2,116 | 3 | 4.67/5.0 |
| Mario | 3 | $1,801 | 36 | 4.67/5.0 |
| Arie | 1 | $1,130 | 3 | 5.00/5.0 |
| Pina | 1 | $141 | 1 | Not Rated |
Analyzing the strategies of top hosts, such as their property selection, pricing, and guest communication, can offer valuable lessons for optimizing your own Airbnb operations in Harjobinangun.
Dive Deeper: Advanced Harjobinangun STR Market Data (2026)
Ready to unlock more insights? AirROI provides access to advanced metrics and comprehensive Airbnb data for Harjobinangun. Explore detailed analytics beyond this report to refine your investment strategy, optimize pricing, and maximize your vacation rental profits.
Explore Advanced MetricsHarjobinangun Short-Term Rental Market Composition (2026): Property & Room Types
Room Type Distribution
Property Type Distribution
Market Composition Insights for Harjobinangun
- The Harjobinangun Airbnb market composition is heavily skewed towards Entire Home/Apt listings, which make up 70% of the 20 active rentals. This indicates strong guest preference for privacy and space.
- Looking at the property type distribution in Harjobinangun, House properties are the most common (60%), reflecting the local real estate landscape.
- Houses represent a significant 60% portion, catering likely to families or larger groups.
- The presence of 25% Hotel/Boutique listings indicates integration with traditional hospitality.
Harjobinangun Airbnb Room Capacity Analysis (2026): Bedroom Distribution
Distribution of Listings by Number of Bedrooms
Room Capacity Insights for Harjobinangun
- The dominant room capacity in Harjobinangun is 1 bedroom listings, making up 40% of the market. This suggests a strong demand for properties suitable for couples or solo travelers.
- Together, 1 bedroom and 4 bedrooms properties represent 60.0% of the active Airbnb listings in Harjobinangun, indicating a high concentration in these sizes.
- A significant 30.0% of listings offer 3+ bedrooms, catering to larger groups and families seeking more space in Harjobinangun.
Harjobinangun Vacation Rental Guest Capacity Trends (2026)
Distribution of Listings by Guest Capacity
Guest Capacity Insights for Harjobinangun
- The most common guest capacity trend in Harjobinangun vacation rentals is listings accommodating 8+ guests (35%). This suggests the primary traveler segment is likely larger groups.
- Properties designed for 8+ guests and 2 guests dominate the Harjobinangun STR market, accounting for 70.0% of listings.
- 45.0% of properties accommodate 6+ guests, serving the market segment for larger families or group travel in Harjobinangun.
- On average, properties in Harjobinangun are equipped to host 4.3 guests.
Harjobinangun Airbnb Booking Patterns (2026): Available vs. Booked Days
Available Days Distribution
Booked Days Distribution
Booking Pattern Insights for Harjobinangun
- The most common availability pattern in Harjobinangun falls within the 271-366 days range, representing 85% of listings. This suggests many properties have significant open periods on their calendars.
- Approximately 100.0% of listings show high availability (181+ days open annually), indicating potential for increased bookings or specific owner usage patterns.
- For booked days, the 1-30 days range is most frequent in Harjobinangun (50%), reflecting common guest stay durations or potential owner blocking patterns.
Harjobinangun Airbnb Minimum Stay Requirements Analysis
Distribution of Listings by Minimum Night Requirement
1 Night
18 listings
90% of total
30+ Nights
2 listings
10% of total
Key Insights
- The most prevalent minimum stay requirement in Harjobinangun is 1 Night, adopted by 90% of listings. This highlights the market's preference for shorter, flexible bookings.
- A strong majority (90.0%) of the Harjobinangun Airbnb data shows acceptance of very short stays (1-2 nights), indicating a dynamic, high-turnover market.
Recommendations
- Align with the market by considering a 1 Night minimum stay, as 90% of Harjobinangun hosts use this setting.
- Explore offering discounts for stays of 30+ nights to attract the 10% of the market seeking extended stays.
- Adjust minimum nights based on seasonality – potentially shorter during low season and longer during peak demand periods in Harjobinangun.
Harjobinangun Airbnb Cancellation Policy Trends Analysis (2026)
Super Strict 60 Days
1 listings
5% of total
Flexible
13 listings
65% of total
Firm
2 listings
10% of total
Strict
4 listings
20% of total
Cancellation Policy Insights for Harjobinangun
- The prevailing Airbnb cancellation policy trend in Harjobinangun is Flexible, used by 65% of listings.
- There's a relatively balanced mix between guest-friendly (65.0%) and stricter (30.0%) policies, offering choices for different guest needs.
Recommendations for Hosts
- Consider adopting a Flexible policy to align with the 65% market standard in Harjobinangun.
- Given the high prevalence of Flexible policies (65%), offering this can enhance booking appeal, especially during shoulder seasons.
- Regularly review your cancellation policy against competitors and market demand shifts in Harjobinangun.
Harjobinangun STR Booking Lead Time Analysis (2026)
Average Booking Lead Time by Month
Booking Lead Time Insights for Harjobinangun
- The overall average booking lead time for vacation rentals in Harjobinangun is 29 days.
- Guests book furthest in advance for stays during April (average 41 days), likely coinciding with peak travel demand or local events.
- The shortest booking windows occur for stays in July (average 10 days), indicating more last-minute travel plans during this time.
- Seasonally, Spring (35 days avg.) sees the longest lead times, while Summer (12 days avg.) has the shortest, reflecting typical travel planning cycles.
Recommendations for Hosts
- Use the overall average lead time (29 days) as a baseline for your pricing and availability strategy in Harjobinangun.
- For April stays, consider implementing length-of-stay discounts or slightly higher rates for bookings made less than 41 days out to capitalize on advance planning.
- During July, focus on last-minute booking availability and promotions, as guests book with very short notice (10 days avg.).
- Target marketing efforts for the Spring season well in advance (at least 35 days) to capture early planners.
- Monitor your own booking lead times against these Harjobinangun averages to identify opportunities for dynamic pricing adjustments.
Popular & Essential Airbnb Amenities in Harjobinangun (2026)
Amenity Prevalence
Amenity Insights for Harjobinangun
- Essential amenities in Harjobinangun that guests expect include: TV, Free parking on premises, Wifi, Air conditioning. Lacking these (any) could significantly impact bookings.
- Popular amenities like Hot water, Kitchen, Cooking basics are common but not universal. Offering these can provide a competitive edge.
Recommendations for Hosts
- Ensure your listing includes all essential amenities for Harjobinangun: TV, Free parking on premises, Wifi, Air conditioning.
- Prioritize adding missing essentials: Air conditioning.
- Consider adding popular differentiators like Hot water or Kitchen to increase appeal.
- Highlight unique or less common amenities you offer (e.g., hot tub, dedicated workspace, EV charger) in your listing description and photos.
- Regularly check competitor amenities in Harjobinangun to stay competitive.
Harjobinangun Airbnb Guest Demographics & Profile Analysis (2026)
Guest Profile Summary for Harjobinangun
- The typical guest profile for Airbnb in Harjobinangun consists of a mix of domestic (56%) and international guests, often arriving from nearby East Java, typically belonging to the Post-2000s (Gen Z/Alpha) group (50%), primarily speaking English or Indonesian.
- Domestic travelers account for 55.9% of guests.
- Key international markets include Indonesia (55.9%) and France (8.8%).
- Top languages spoken are English (36.8%) followed by Indonesian (31.6%).
- A significant demographic segment is the Post-2000s (Gen Z/Alpha) group, representing 50% of guests.
Recommendations for Hosts
- Balance marketing efforts between domestic and international channels based on the guest mix.
- Tailor amenities and listing descriptions to appeal to the dominant Post-2000s (Gen Z/Alpha) demographic (e.g., highlight fast WiFi, smart home features, local guides).
- Highlight unique local experiences or amenities relevant to the primary guest profile.
- Consider seasonal promotions aligned with peak travel times for key origin markets.
Nearby Short-Term Rental Market Comparison
How does the Harjobinangun Airbnb market stack up against its neighbors? Compare key performance metrics like average monthly revenue, ADR, and occupancy rates in surrounding areas to understand the broader regional STR landscape.
| Market | Active Properties | Monthly Revenue | Daily Rate | Avg. Occupancy |
|---|---|---|---|---|
| Candibinangun | 10 | $713 | $112.01 | 18% |
| Bangunjiwo | 25 | $647 | $82.14 | 27% |
| Sardonoharjo | 11 | $490 | $120.34 | 17% |
| Sukoharjo | 16 | $469 | $90.40 | 24% |
| Maguwoharjo | 35 | $430 | $75.21 | 23% |
| Bangunharjo | 10 | $388 | $84.13 | 22% |
| Pandowoharjo | 15 | $364 | $106.80 | 16% |
| Sariharjo | 160 | $347 | $56.11 | 28% |
| Bantul Regency | 153 | $336 | $54.68 | 24% |
| Sinduharjo | 25 | $319 | $60.83 | 27% |