Wedomartani Airbnb Market Analysis 2026: Short Term Rental Data & Vacation Rental Statistics in Special Region of Yogyakarta, Indonesia
Is Airbnb profitable in Wedomartani in 2026? Explore comprehensive Airbnb analytics for Wedomartani, Special Region of Yogyakarta, Indonesia to uncover income potential. This 2026 STR market report for Wedomartani, based on AirROI data from February 2025 to January 2026, reveals key trends in the niche market of 22 active listings.
Whether you're considering an Airbnb investment in Wedomartani, optimizing your existing vacation rental, or exploring rental arbitrage opportunities, understanding the Wedomartani Airbnb data is crucial. Leveraging the low regulation environment is key to maximizing your short term rental income potential. Let's dive into the specifics.
Key Wedomartani Airbnb Performance Metrics Overview
Monthly Airbnb Revenue Variations & Income Potential in Wedomartani (2026)
Understanding the monthly revenue variations for Airbnb listings in Wedomartani is key to maximizing your short term rental income potential. Seasonality significantly impacts earnings. Our analysis, based on data from the past 12 months, shows that the peak revenue month for STRs in Wedomartani is typically October, while March often presents the lowest earnings, highlighting opportunities for strategic pricing adjustments during shoulder and low seasons. Explore the typical Airbnb income in Wedomartani across different performance tiers:
- Best-in-class properties (Top 10%) achieve $563+ monthly, often utilizing dynamic pricing and superior guest experiences.
- Strong performing properties (Top 25%) earn $318 or more, indicating effective management and desirable locations/amenities.
- Typical properties (Median) generate around $182 per month, representing the average market performance.
- Entry-level properties (Bottom 25%) see earnings around $113, often with potential for optimization.
Average Monthly Airbnb Earnings Trend in Wedomartani
Wedomartani Airbnb Occupancy Rate Trends (2026)
Maximize your bookings by understanding the Wedomartani STR occupancy trends. Seasonal demand shifts significantly influence how often properties are booked. Typically, Decembersees the highest demand (peak season occupancy), while March experiences the lowest (low season). Effective strategies, like adjusting minimum stays or offering promotions, can boost occupancy during slower periods. Here's how different property tiers perform in Wedomartani:
- Best-in-class properties (Top 10%) achieve 25%+ occupancy, indicating high desirability and potentially optimized availability.
- Strong performing properties (Top 25%) maintain 20% or higher occupancy, suggesting good market fit and guest satisfaction.
- Typical properties (Median) have an occupancy rate around 10%.
- Entry-level properties (Bottom 25%) average 8% occupancy, potentially facing higher vacancy.
Average Monthly Occupancy Rate Trend in Wedomartani
Average Daily Rate (ADR) Airbnb Trends in Wedomartani (2026)
Effective short term rental pricing strategy in Wedomartani involves understanding monthly ADR fluctuations. The Average Daily Rate (ADR) for Airbnb in Wedomartani typically peaks in December and dips lowest during November. Leveraging Airbnb dynamic pricing tools or strategies based on this seasonality can significantly boost revenue. Here's a look at the typical nightly rates achieved:
- Best-in-class properties (Top 10%) command rates of $95+ per night, often due to premium features or locations.
- Strong performing properties (Top 25%) achieve nightly rates of $60 or more.
- Typical properties (Median) charge around $43 per night.
- Entry-level properties (Bottom 25%) earn around $30 per night.
Average Daily Rate (ADR) Trend by Month in Wedomartani
Get Live Wedomartani Market Intelligence 👇

Explore Real-time Analytics
Airbnb Seasonality Analysis & Trends in Wedomartani (2026)
Peak Season (October, December, January)
- Revenue averages $417 per month
- Occupancy rates average 20.0%
- Daily rates average $55
Shoulder Season
- Revenue averages $246 per month
- Occupancy maintains around 12.7%
- Daily rates hold near $56
Low Season (March, May, November)
- Revenue drops to average $160 per month
- Occupancy decreases to average 9.6%
- Daily rates adjust to average $55
Seasonality Insights for Wedomartani
- The Airbnb seasonality in Wedomartani shows highly seasonal trends requiring careful strategy. While the sections above show seasonal averages, it's also insightful to look at the extremes:
- During the high season, the absolute peak month showcases Wedomartani's highest earning potential, with monthly revenues capable of climbing to $489, occupancy reaching a high of 22.6%, and ADRs peaking at $58.
- Conversely, the slowest single month of the year, typically falling within the low season, marks the market's lowest point. In this month, revenue might dip to $156, occupancy could drop to 7.6%, and ADRs may adjust down to $53.
- Understanding both the seasonal averages and these monthly peaks and troughs in revenue, occupancy, and ADR is crucial for maximizing your Airbnb profit potential in Wedomartani.
Seasonal Strategies for Maximizing Profit
- Peak Season: Maximize revenue through premium pricing and potentially longer minimum stays. Ensure high availability.
- Low Season: Offer competitive pricing, special promotions (e.g., extended stay discounts), and flexible cancellation policies. Target off-season travelers like remote workers or budget-conscious guests.
- Shoulder Seasons: Implement dynamic pricing that balances peak and low rates. Target weekend travelers or specific events. Offer slightly more flexible terms than peak season.
- Regularly analyze your own performance against these Wedomartani seasonality benchmarks and adjust your pricing and availability strategy accordingly.
Best Areas for Airbnb Investment in Wedomartani (2026)
Exploring the top neighborhoods for short-term rentals in Wedomartani? This section highlights key areas, outlining why they are attractive for hosts and guests, along with notable local attractions. Consider these locations based on your target guest profile and investment strategy.
| Neighborhood / Area | Why Host Here? (Target Guests & Appeal) | Key Attractions & Landmarks |
|---|---|---|
| Malioboro | Known as Yogyakarta's main street, Malioboro is a bustling area filled with shops, street food, and traditional markets. It's a prime location for tourists looking to experience local culture and shop for souvenirs. | Malioboro Street, Beringharjo Market, Fort Vredeburg Museum, Yogyakarta Post Office, Taman Pintar Science Park, Kraton Yogyakarta |
| Kraton Yogyakarta | The royal palace of Yogyakarta, rich in history and heritage. This area attracts tourists interested in Javanese culture, traditional performances, and art. | Kraton Palace, Tamansari Water Castle, Museum Sonobudoyo, Taman Sari, Traditional market nearby |
| Prawirotaman | A trendy neighborhood known for its diverse range of cafes, restaurants, and art galleries. It appeals to travelers seeking a blend of local culture and modern amenities. | Prawirotaman Street, Yoga workshops, Local coffee shops, Art galleries, Eating spots for international cuisines |
| Batu Mondo | A beautiful area close to nature with stunning views. Popular for those looking to stay away from the busy city but still be close to attractions. | Natural hot springs, Temple complexes, Rice paddies, Hiking trails, Scenic viewpoints |
| Sleman | A quieter suburban area that offers easy access to both nature and cultural sites. Suitable for families and long-term stays. | Dharma Shanti Caves, Sleman City Hall, Local parks, Agro-tourism spots, Cultural villages |
| Alun-Alun Kidul | This historical field is famous for its night market and local street food. Attracts visitors looking for an authentic local experience. | Alun-Alun Kidul park, Night market, Traditional food stalls, Live performances, Javanese games |
| Ubud | Despite being known mainly for its rice terraces, Ubud's cultural vibe attracts tourists interested in art, wellness, and spirituality. | Campuhan Ridge Walk, Ubud Art Market, Monkeys in Ubud Monkey Forest, Tegallalang Rice Terrace, Yoga retreats |
| Gunungkidul | Known for stunning beaches and unique geological formations. Perfect for nature lovers and adventure seekers looking to escape the city. | Beaches (like Indrayanti), Karst hills, Cave exploring, Waterfall visits, Local seafood cafes |
Understanding Airbnb License Requirements & STR Laws in Wedomartani (2026)
While Wedomartani, Special Region of Yogyakarta, Indonesia currently shows low STR regulations, specific Airbnb license requirements might still exist or change. Always verify the latest short term rental regulations and Airbnb license requirements directly with local government authorities for Wedomartani to ensure full compliance before hosting.
(Source: AirROI data, 2026, finding no licensed listings among those analyzed)
Top Performing Airbnb Properties in Wedomartani (2026)
Benchmark your potential! Explore examples of top-performing Airbnb properties in Wedomartanibased on Trailing Twelve Month (TTM) revenue. Analyze their characteristics, revenue, occupancy rate, and ADR to understand what drives success in this market.

Omah Ohana 2BR w/Pool Yogyakarta
Entire Place • 2 bedrooms
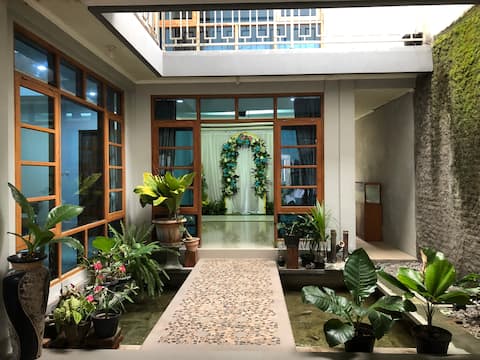
Beautiful minimalist tropical homes that are also comfortable
Entire Place • 4 bedrooms

Missing Jogja. Come back to RUMAHKEDUA!
Entire Place • 3 bedrooms
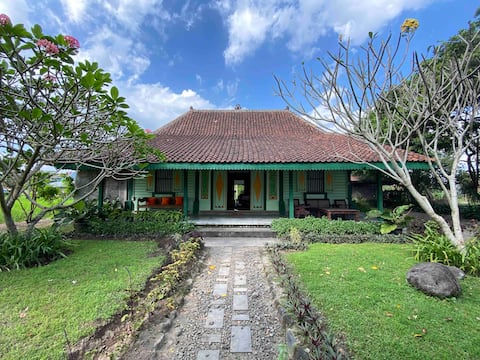
Gebang Temple Trail
Entire Place • 4 bedrooms
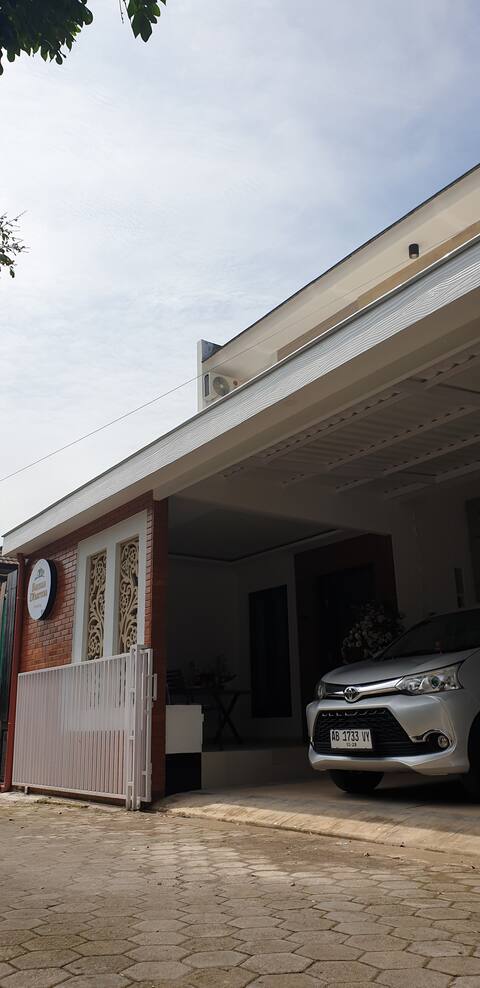
Banua Dharma Homestay
Entire Place • 4 bedrooms

Stop by Tentrem Homestay - D.I.Y
Entire Place • 3 bedrooms
Note: Performance varies based on location, size, amenities, seasonality, and management quality. Data reflects the past 12 months.
Top Performing Airbnb Hosts in Wedomartani (2026)
Learn from the best! This table showcases top-performing Airbnb hosts in Wedomartani based on the number of properties managed and estimated total revenue over the past year. Analyze their scale and performance metrics.
| Host Name | Properties | Grossing Revenue | Stay Reviews | Avg Rating |
|---|---|---|---|---|
| Natalia | 1 | $8,451 | 30 | 4.83/5.0 |
| Rumahkedua | 2 | $3,901 | 93 | 4.74/5.0 |
| Tanti Syarief | 1 | $3,431 | 26 | 4.92/5.0 |
| Gahet | 1 | $2,519 | 40 | 4.93/5.0 |
| Widhi | 1 | $2,032 | 5 | 5.00/5.0 |
| Singgah Tentrem | 1 | $1,571 | 5 | 4.60/5.0 |
| Mia | 1 | $1,315 | 6 | 5.00/5.0 |
| Nurul | 1 | $1,283 | 4 | 4.75/5.0 |
| Marwan | 1 | $894 | 2 | Not Rated |
| Alethea | 1 | $890 | 38 | 4.68/5.0 |
Analyzing the strategies of top hosts, such as their property selection, pricing, and guest communication, can offer valuable lessons for optimizing your own Airbnb operations in Wedomartani.
Dive Deeper: Advanced Wedomartani STR Market Data (2026)
Ready to unlock more insights? AirROI provides access to advanced metrics and comprehensive Airbnb data for Wedomartani. Explore detailed analytics beyond this report to refine your investment strategy, optimize pricing, and maximize your vacation rental profits.
Explore Advanced MetricsWedomartani Short-Term Rental Market Composition (2026): Property & Room Types
Room Type Distribution
Property Type Distribution
Market Composition Insights for Wedomartani
- The Wedomartani Airbnb market composition is heavily skewed towards Entire Home/Apt listings, which make up 86.4% of the 22 active rentals. This indicates strong guest preference for privacy and space.
- Looking at the property type distribution in Wedomartani, House properties are the most common (72.7%), reflecting the local real estate landscape.
- Houses represent a significant 72.7% portion, catering likely to families or larger groups.
- The presence of 22.7% Hotel/Boutique listings indicates integration with traditional hospitality.
- Smaller segments like outdoor/unique (combined 4.5%) offer potential for unique stay experiences.
Wedomartani Airbnb Room Capacity Analysis (2026): Bedroom Distribution
Distribution of Listings by Number of Bedrooms
Room Capacity Insights for Wedomartani
- The dominant room capacity in Wedomartani is 3 bedrooms listings, making up 45.5% of the market. This suggests a strong demand for properties suitable for families or small groups.
- Together, 3 bedrooms and 4 bedrooms properties represent 68.2% of the active Airbnb listings in Wedomartani, indicating a high concentration in these sizes.
- A significant 72.7% of listings offer 3+ bedrooms, catering to larger groups and families seeking more space in Wedomartani.
Wedomartani Vacation Rental Guest Capacity Trends (2026)
Distribution of Listings by Guest Capacity
Guest Capacity Insights for Wedomartani
- The most common guest capacity trend in Wedomartani vacation rentals is listings accommodating 8+ guests (45.5%). This suggests the primary traveler segment is likely larger groups.
- Properties designed for 8+ guests and 6 guests dominate the Wedomartani STR market, accounting for 63.7% of listings.
- 77.3% of properties accommodate 6+ guests, serving the market segment for larger families or group travel in Wedomartani.
- On average, properties in Wedomartani are equipped to host 6.2 guests.
Wedomartani Airbnb Booking Patterns (2026): Available vs. Booked Days
Available Days Distribution
Booked Days Distribution
Booking Pattern Insights for Wedomartani
- The most common availability pattern in Wedomartani falls within the 271-366 days range, representing 100% of listings. This suggests many properties have significant open periods on their calendars.
- Approximately 100.0% of listings show high availability (181+ days open annually), indicating potential for increased bookings or specific owner usage patterns.
- For booked days, the 1-30 days range is most frequent in Wedomartani (63.6%), reflecting common guest stay durations or potential owner blocking patterns.
Wedomartani Airbnb Minimum Stay Requirements Analysis
Distribution of Listings by Minimum Night Requirement
1 Night
19 listings
86.4% of total
2 Nights
1 listings
4.5% of total
30+ Nights
2 listings
9.1% of total
Key Insights
- The most prevalent minimum stay requirement in Wedomartani is 1 Night, adopted by 86.4% of listings. This highlights the market's preference for shorter, flexible bookings.
- A strong majority (90.9%) of the Wedomartani Airbnb data shows acceptance of very short stays (1-2 nights), indicating a dynamic, high-turnover market.
Recommendations
- Align with the market by considering a 1 Night minimum stay, as 86.4% of Wedomartani hosts use this setting.
- Explore offering discounts for stays of 30+ nights to attract the 9.1% of the market seeking extended stays.
- Adjust minimum nights based on seasonality – potentially shorter during low season and longer during peak demand periods in Wedomartani.
Wedomartani Airbnb Cancellation Policy Trends Analysis (2026)
Flexible
10 listings
45.5% of total
Moderate
7 listings
31.8% of total
Firm
4 listings
18.2% of total
Strict
1 listings
4.5% of total
Cancellation Policy Insights for Wedomartani
- The prevailing Airbnb cancellation policy trend in Wedomartani is Flexible, used by 45.5% of listings.
- The market strongly favors guest-friendly terms, with 77.3% of listings offering Flexible or Moderate policies. This suggests guests in Wedomartani may expect booking flexibility.
- Strict cancellation policies are quite rare (4.5%), potentially making listings with this policy less competitive unless justified by high demand or property type.
Recommendations for Hosts
- Consider adopting a Flexible policy to align with the 45.5% market standard in Wedomartani.
- Using a Strict policy might deter some guests, as only 4.5% of listings use it. Evaluate if potential revenue protection outweighs possible lower booking rates.
- Regularly review your cancellation policy against competitors and market demand shifts in Wedomartani.
Wedomartani STR Booking Lead Time Analysis (2026)
Average Booking Lead Time by Month
Booking Lead Time Insights for Wedomartani
- The overall average booking lead time for vacation rentals in Wedomartani is 20 days.
- Guests book furthest in advance for stays during May (average 25 days), likely coinciding with peak travel demand or local events.
- The shortest booking windows occur for stays in February (average 7 days), indicating more last-minute travel plans during this time.
- Seasonally, Spring (21 days avg.) sees the longest lead times, while Winter (11 days avg.) has the shortest, reflecting typical travel planning cycles.
Recommendations for Hosts
- Use the overall average lead time (20 days) as a baseline for your pricing and availability strategy in Wedomartani.
- During February, focus on last-minute booking availability and promotions, as guests book with very short notice (7 days avg.).
- Target marketing efforts for the Spring season well in advance (at least 21 days) to capture early planners.
- Monitor your own booking lead times against these Wedomartani averages to identify opportunities for dynamic pricing adjustments.
Popular & Essential Airbnb Amenities in Wedomartani (2026)
Amenity Prevalence
Amenity Insights for Wedomartani
- Essential amenities in Wedomartani that guests expect include: Air conditioning. Lacking these (this) could significantly impact bookings.
- Popular amenities like Wifi, Free parking on premises, TV are common but not universal. Offering these can provide a competitive edge.
- Warning: Wifi is not universally provided but is considered essential globally. Ensure reliable Wifi is offered.
Recommendations for Hosts
- Ensure your listing includes all essential amenities for Wedomartani: Air conditioning.
- Prioritize adding missing essentials: Air conditioning.
- Consider adding popular differentiators like Wifi or Free parking on premises to increase appeal.
- Highlight unique or less common amenities you offer (e.g., hot tub, dedicated workspace, EV charger) in your listing description and photos.
- Regularly check competitor amenities in Wedomartani to stay competitive.
Wedomartani Airbnb Guest Demographics & Profile Analysis (2026)
Guest Profile Summary for Wedomartani
- The typical guest profile for Airbnb in Wedomartani consists of primarily domestic travelers (86%), often arriving from nearby Jakarta, typically belonging to the Post-2000s (Gen Z/Alpha) group (50%), primarily speaking English or Indonesian.
- Domestic travelers account for 85.7% of guests.
- Key international markets include Indonesia (85.7%) and Philippines (7.1%).
- Top languages spoken are English (46.2%) followed by Indonesian (38.5%).
- A significant demographic segment is the Post-2000s (Gen Z/Alpha) group, representing 50% of guests.
Recommendations for Hosts
- Target domestic marketing efforts towards travelers from Jakarta and West Java.
- Tailor amenities and listing descriptions to appeal to the dominant Post-2000s (Gen Z/Alpha) demographic (e.g., highlight fast WiFi, smart home features, local guides).
- Highlight unique local experiences or amenities relevant to the primary guest profile.
- Consider seasonal promotions aligned with peak travel times for key origin markets.
Nearby Short-Term Rental Market Comparison
How does the Wedomartani Airbnb market stack up against its neighbors? Compare key performance metrics like average monthly revenue, ADR, and occupancy rates in surrounding areas to understand the broader regional STR landscape.
| Market | Active Properties | Monthly Revenue | Daily Rate | Avg. Occupancy |
|---|---|---|---|---|
| Candibinangun | 10 | $713 | $112.01 | 18% |
| Bangunjiwo | 25 | $647 | $82.14 | 27% |
| Sardonoharjo | 11 | $490 | $120.34 | 17% |
| Sukoharjo | 16 | $469 | $90.40 | 24% |
| Maguwoharjo | 35 | $430 | $75.21 | 23% |
| Bangunharjo | 10 | $388 | $84.13 | 22% |
| Pandowoharjo | 15 | $364 | $106.79 | 16% |
| Sariharjo | 160 | $347 | $56.11 | 28% |
| Bantul Regency | 153 | $336 | $54.68 | 24% |
| Sinduharjo | 25 | $319 | $60.83 | 27% |