Babakan Madang Airbnb Market Analysis 2026: Short Term Rental Data & Vacation Rental Statistics in West Java, Indonesia
Is Airbnb profitable in Babakan Madang in 2026? Explore comprehensive Airbnb analytics for Babakan Madang, West Java, Indonesia to uncover income potential. This 2026 STR market report for Babakan Madang, based on AirROI data from February 2025 to January 2026, reveals key trends in the niche market of 67 active listings.
Whether you're considering an Airbnb investment in Babakan Madang, optimizing your existing vacation rental, or exploring rental arbitrage opportunities, understanding the Babakan Madang Airbnb data is crucial. Leveraging the low regulation environment is key to maximizing your short term rental income potential. Let's dive into the specifics.
Key Babakan Madang Airbnb Performance Metrics Overview
Monthly Airbnb Revenue Variations & Income Potential in Babakan Madang (2026)
Understanding the monthly revenue variations for Airbnb listings in Babakan Madang is key to maximizing your short term rental income potential. Seasonality significantly impacts earnings. Our analysis, based on data from the past 12 months, shows that the peak revenue month for STRs in Babakan Madang is typically December, while October often presents the lowest earnings, highlighting opportunities for strategic pricing adjustments during shoulder and low seasons. Explore the typical Airbnb income in Babakan Madang across different performance tiers:
- Best-in-class properties (Top 10%) achieve $2,193+ monthly, often utilizing dynamic pricing and superior guest experiences.
- Strong performing properties (Top 25%) earn $1,118 or more, indicating effective management and desirable locations/amenities.
- Typical properties (Median) generate around $461 per month, representing the average market performance.
- Entry-level properties (Bottom 25%) see earnings around $196, often with potential for optimization.
Average Monthly Airbnb Earnings Trend in Babakan Madang
Babakan Madang Airbnb Occupancy Rate Trends (2026)
Maximize your bookings by understanding the Babakan Madang STR occupancy trends. Seasonal demand shifts significantly influence how often properties are booked. Typically, Decembersees the highest demand (peak season occupancy), while October experiences the lowest (low season). Effective strategies, like adjusting minimum stays or offering promotions, can boost occupancy during slower periods. Here's how different property tiers perform in Babakan Madang:
- Best-in-class properties (Top 10%) achieve 41%+ occupancy, indicating high desirability and potentially optimized availability.
- Strong performing properties (Top 25%) maintain 27% or higher occupancy, suggesting good market fit and guest satisfaction.
- Typical properties (Median) have an occupancy rate around 14%.
- Entry-level properties (Bottom 25%) average 7% occupancy, potentially facing higher vacancy.
Average Monthly Occupancy Rate Trend in Babakan Madang
Average Daily Rate (ADR) Airbnb Trends in Babakan Madang (2026)
Effective short term rental pricing strategy in Babakan Madang involves understanding monthly ADR fluctuations. The Average Daily Rate (ADR) for Airbnb in Babakan Madang typically peaks in June and dips lowest during November. Leveraging Airbnb dynamic pricing tools or strategies based on this seasonality can significantly boost revenue. Here's a look at the typical nightly rates achieved:
- Best-in-class properties (Top 10%) command rates of $276+ per night, often due to premium features or locations.
- Strong performing properties (Top 25%) achieve nightly rates of $180 or more.
- Typical properties (Median) charge around $93 per night.
- Entry-level properties (Bottom 25%) earn around $47 per night.
Average Daily Rate (ADR) Trend by Month in Babakan Madang
Get Live Babakan Madang Market Intelligence 👇

Explore Real-time Analytics
Airbnb Seasonality Analysis & Trends in Babakan Madang (2026)
Peak Season (December, April, June)
- Revenue averages $1,166 per month
- Occupancy rates average 24.7%
- Daily rates average $128
Shoulder Season
- Revenue averages $846 per month
- Occupancy maintains around 18.9%
- Daily rates hold near $125
Low Season (May, October, November)
- Revenue drops to average $691 per month
- Occupancy decreases to average 15.9%
- Daily rates adjust to average $124
Seasonality Insights for Babakan Madang
- The Airbnb seasonality in Babakan Madang shows highly seasonal trends requiring careful strategy. While the sections above show seasonal averages, it's also insightful to look at the extremes:
- During the high season, the absolute peak month showcases Babakan Madang's highest earning potential, with monthly revenues capable of climbing to $1,314, occupancy reaching a high of 27.6%, and ADRs peaking at $129.
- Conversely, the slowest single month of the year, typically falling within the low season, marks the market's lowest point. In this month, revenue might dip to $659, occupancy could drop to 15.1%, and ADRs may adjust down to $122.
- Understanding both the seasonal averages and these monthly peaks and troughs in revenue, occupancy, and ADR is crucial for maximizing your Airbnb profit potential in Babakan Madang.
Seasonal Strategies for Maximizing Profit
- Peak Season: Maximize revenue through premium pricing and potentially longer minimum stays. Ensure high availability.
- Low Season: Offer competitive pricing, special promotions (e.g., extended stay discounts), and flexible cancellation policies. Target off-season travelers like remote workers or budget-conscious guests.
- Shoulder Seasons: Implement dynamic pricing that balances peak and low rates. Target weekend travelers or specific events. Offer slightly more flexible terms than peak season.
- Regularly analyze your own performance against these Babakan Madang seasonality benchmarks and adjust your pricing and availability strategy accordingly.
Best Areas for Airbnb Investment in Babakan Madang (2026)
Exploring the top neighborhoods for short-term rentals in Babakan Madang? This section highlights key areas, outlining why they are attractive for hosts and guests, along with notable local attractions. Consider these locations based on your target guest profile and investment strategy.
| Neighborhood / Area | Why Host Here? (Target Guests & Appeal) | Key Attractions & Landmarks |
|---|---|---|
| Cibubur | A bustling suburb close to Jakarta, known for its family-friendly atmosphere and access to shopping malls and recreational areas. Ideal for families and short-term renters. | Cibubur Junction, Trans Studio Cibubur, Cibubur Water Adventure, Taman Buah Mekarsari, The Ranch Cibubur |
| Sentul City | A modern development surrounded by mountainous scenery, popular for nature lovers and those looking for a getaway from the city. Attractive for its resorts and recreational activities. | Sentul International Circuit, Jungleland Adventure Theme Park, Lake Sentul, Bidadari Waterfall, Ah Poong Sentul |
| Bogor | Known for its cool climate and botanical gardens, Bogor attracts tourists looking to explore nature and escape the hustle of city life, making it perfect for Airbnb hosting. | Bogor Botanical Gardens, Presidential Palace, Kebun Raya Bogor, Taman Safari Indonesia, Gunung Salak |
| Puncak | A popular hill station known for its tea plantations and stunning views, it draws visitors seeking a serene retreat in nature, ideal for short-term stays. | Taman Bunga Nusantara, Little Venice Puncak, Puncak Pass, Cibodas Botanical Garden, Tea Plantation Tours |
| Cisarua | A picturesque area known for its cool weather and beautiful landscapes, making it a popular weekend retreat for people from Jakarta and surrounding areas. | Taman Safari Indonesia, Nirvana Valley, Puncak Indah, Cisarua Adventure Park, Jungle Land |
| Batam City | Although a bit further, Batam is a growing destination known for its waterfront and proximity to Singapore, offering a mix of leisure and business opportunities. | Nagoya Hill Shopping Mall, Barelang Bridge, Batam Cable Ski, Mega Mall Batam, Beach Walk Batam |
| Cimanggis | This area is developing rapidly, with easy access to Jakarta and local attractions, making it appealing for both leisure and business travelers. | Cimanggis Square, Alam Sutera, Sakura Garden, Taman Rusa”, |
| Depok | A growing urban area with easy access to Jakarta, popular among students and young professionals, perfect for affordable short-term rentals. | Depok Town Square, Margo City, Universitas Indonesia, Rawa Gede Park, Cimanggis Botanical Garden |
Understanding Airbnb License Requirements & STR Laws in Babakan Madang (2026)
While Babakan Madang, West Java, Indonesia currently shows low STR regulations, specific Airbnb license requirements might still exist or change. Always verify the latest short term rental regulations and Airbnb license requirements directly with local government authorities for Babakan Madang to ensure full compliance before hosting.
(Source: AirROI data, 2026, finding no licensed listings among those analyzed)
Top Performing Airbnb Properties in Babakan Madang (2026)
Benchmark your potential! Explore examples of top-performing Airbnb properties in Babakan Madangbased on Trailing Twelve Month (TTM) revenue. Analyze their characteristics, revenue, occupancy rate, and ADR to understand what drives success in this market.
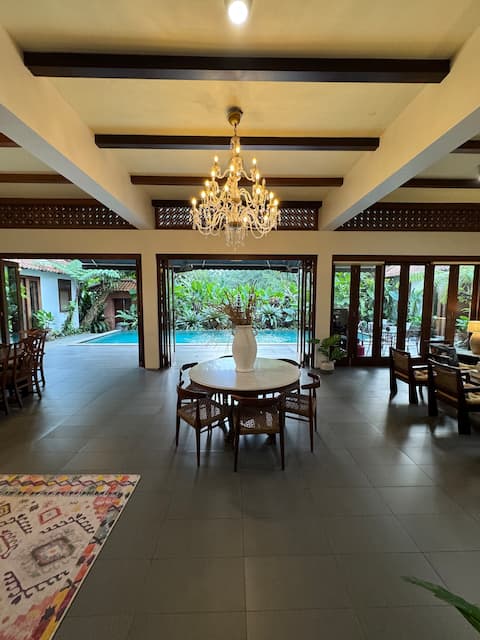
Villa Sendja Sentul (ubud vibes)
Entire Place • 4 bedrooms

Puri Panina at Sentul City
Private Room • 4 bedrooms
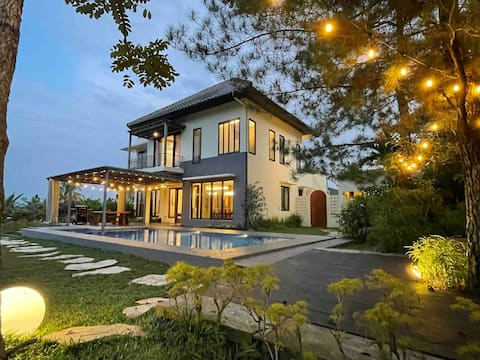
Villa Djiwa Sentul
Entire Place • 4 bedrooms
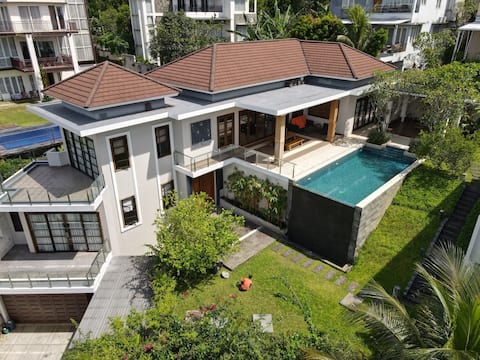
Villa Etty Sentul City Luxury Villa Infinity Pool
Entire Place • 3 bedrooms

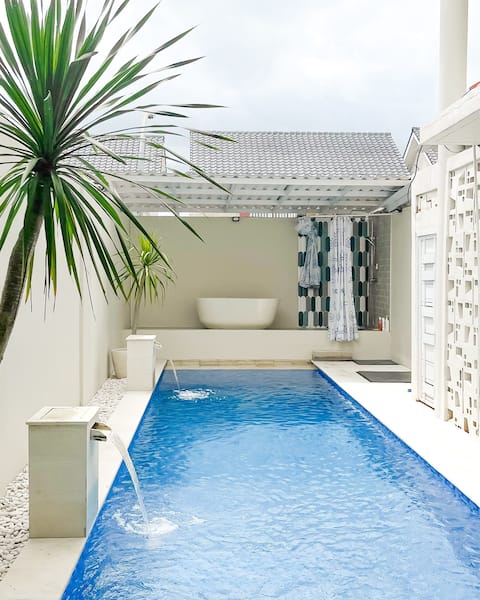
Villa de Gaharu Sentul
Entire Place • 6 bedrooms
Sentul Villa Alpen
Entire Place • 4 bedrooms
Note: Performance varies based on location, size, amenities, seasonality, and management quality. Data reflects the past 12 months.
Top Performing Airbnb Hosts in Babakan Madang (2026)
Learn from the best! This table showcases top-performing Airbnb hosts in Babakan Madang based on the number of properties managed and estimated total revenue over the past year. Analyze their scale and performance metrics.
| Host Name | Properties | Grossing Revenue | Stay Reviews | Avg Rating |
|---|---|---|---|---|
| Imapaka | 2 | $78,758 | 41 | 4.62/5.0 |
| Any | 1 | $36,697 | 32 | 4.75/5.0 |
| Lisa | 1 | $32,345 | 108 | 4.98/5.0 |
| Dyah | 1 | $31,578 | 36 | 5.00/5.0 |
| Dave | 2 | $27,683 | 3 | Not Rated |
| Erick | 1 | $20,101 | 15 | 4.93/5.0 |
| Savira | 1 | $17,622 | 12 | 4.58/5.0 |
| Marcella | 1 | $15,441 | 19 | 5.00/5.0 |
| Ardina | 4 | $15,040 | 276 | 4.99/5.0 |
| Raisa | 1 | $14,196 | 14 | 5.00/5.0 |
Analyzing the strategies of top hosts, such as their property selection, pricing, and guest communication, can offer valuable lessons for optimizing your own Airbnb operations in Babakan Madang.
Dive Deeper: Advanced Babakan Madang STR Market Data (2026)
Ready to unlock more insights? AirROI provides access to advanced metrics and comprehensive Airbnb data for Babakan Madang. Explore detailed analytics beyond this report to refine your investment strategy, optimize pricing, and maximize your vacation rental profits.
Explore Advanced MetricsBabakan Madang Short-Term Rental Market Composition (2026): Property & Room Types
Room Type Distribution
Property Type Distribution
Market Composition Insights for Babakan Madang
- The Babakan Madang Airbnb market composition is heavily skewed towards Entire Home/Apt listings, which make up 89.6% of the 67 active rentals. This indicates strong guest preference for privacy and space.
- Looking at the property type distribution in Babakan Madang, House properties are the most common (83.6%), reflecting the local real estate landscape.
- Houses represent a significant 83.6% portion, catering likely to families or larger groups.
- Smaller segments like hotel/boutique (combined 3.0%) offer potential for unique stay experiences.
Babakan Madang Airbnb Room Capacity Analysis (2026): Bedroom Distribution
Distribution of Listings by Number of Bedrooms
Room Capacity Insights for Babakan Madang
- The dominant room capacity in Babakan Madang is 4 bedrooms listings, making up 26.9% of the market. This suggests a strong demand for properties suitable for families or small groups.
- Together, 4 bedrooms and 3 bedrooms properties represent 52.3% of the active Airbnb listings in Babakan Madang, indicating a high concentration in these sizes.
- A significant 62.7% of listings offer 3+ bedrooms, catering to larger groups and families seeking more space in Babakan Madang.
Babakan Madang Vacation Rental Guest Capacity Trends (2026)
Distribution of Listings by Guest Capacity
Guest Capacity Insights for Babakan Madang
- The most common guest capacity trend in Babakan Madang vacation rentals is listings accommodating 8+ guests (58.2%). This suggests the primary traveler segment is likely larger groups.
- Properties designed for 8+ guests and 6 guests dominate the Babakan Madang STR market, accounting for 70.1% of listings.
- 73.1% of properties accommodate 6+ guests, serving the market segment for larger families or group travel in Babakan Madang.
- On average, properties in Babakan Madang are equipped to host 6.2 guests.
Babakan Madang Airbnb Booking Patterns (2026): Available vs. Booked Days
Available Days Distribution
Booked Days Distribution
Booking Pattern Insights for Babakan Madang
- The most common availability pattern in Babakan Madang falls within the 271-366 days range, representing 83.6% of listings. This suggests many properties have significant open periods on their calendars.
- Approximately 100.0% of listings show high availability (181+ days open annually), indicating potential for increased bookings or specific owner usage patterns.
- For booked days, the 1-30 days range is most frequent in Babakan Madang (49.3%), reflecting common guest stay durations or potential owner blocking patterns.
Babakan Madang Airbnb Minimum Stay Requirements Analysis
Distribution of Listings by Minimum Night Requirement
1 Night
66 listings
98.5% of total
4-6 Nights
1 listings
1.5% of total
Key Insights
- The most prevalent minimum stay requirement in Babakan Madang is 1 Night, adopted by 98.5% of listings. This highlights the market's preference for shorter, flexible bookings.
- A strong majority (98.5%) of the Babakan Madang Airbnb data shows acceptance of very short stays (1-2 nights), indicating a dynamic, high-turnover market.
Recommendations
- Align with the market by considering a 1 Night minimum stay, as 98.5% of Babakan Madang hosts use this setting.
- Adjust minimum nights based on seasonality – potentially shorter during low season and longer during peak demand periods in Babakan Madang.
Babakan Madang Airbnb Cancellation Policy Trends Analysis (2026)
Limited
4 listings
6% of total
Flexible
28 listings
41.8% of total
Moderate
14 listings
20.9% of total
Firm
16 listings
23.9% of total
Strict
5 listings
7.5% of total
Cancellation Policy Insights for Babakan Madang
- The prevailing Airbnb cancellation policy trend in Babakan Madang is Flexible, used by 41.8% of listings.
- There's a relatively balanced mix between guest-friendly (62.7%) and stricter (31.4%) policies, offering choices for different guest needs.
- Strict cancellation policies are quite rare (7.5%), potentially making listings with this policy less competitive unless justified by high demand or property type.
Recommendations for Hosts
- Consider adopting a Flexible policy to align with the 41.8% market standard in Babakan Madang.
- Using a Strict policy might deter some guests, as only 7.5% of listings use it. Evaluate if potential revenue protection outweighs possible lower booking rates.
- Regularly review your cancellation policy against competitors and market demand shifts in Babakan Madang.
Babakan Madang STR Booking Lead Time Analysis (2026)
Average Booking Lead Time by Month
Booking Lead Time Insights for Babakan Madang
- The overall average booking lead time for vacation rentals in Babakan Madang is 17 days.
- Guests book furthest in advance for stays during October (average 27 days), likely coinciding with peak travel demand or local events.
- The shortest booking windows occur for stays in December (average 13 days), indicating more last-minute travel plans during this time.
- Seasonally, Summer (20 days avg.) sees the longest lead times, while Winter (16 days avg.) has the shortest, reflecting typical travel planning cycles.
Recommendations for Hosts
- Use the overall average lead time (17 days) as a baseline for your pricing and availability strategy in Babakan Madang.
- Target marketing efforts for the Summer season well in advance (at least 20 days) to capture early planners.
- Monitor your own booking lead times against these Babakan Madang averages to identify opportunities for dynamic pricing adjustments.
Popular & Essential Airbnb Amenities in Babakan Madang (2026)
Amenity Prevalence
Amenity Insights for Babakan Madang
- Essential amenities in Babakan Madang that guests expect include: Air conditioning, TV. Lacking these (any) could significantly impact bookings.
- Popular amenities like Kitchen, Free parking on premises, Wifi are common but not universal. Offering these can provide a competitive edge.
- Warning: Wifi is not universally provided but is considered essential globally. Ensure reliable Wifi is offered.
Recommendations for Hosts
- Ensure your listing includes all essential amenities for Babakan Madang: Air conditioning, TV.
- Prioritize adding missing essentials: Air conditioning, TV.
- Consider adding popular differentiators like Kitchen or Free parking on premises to increase appeal.
- Highlight unique or less common amenities you offer (e.g., hot tub, dedicated workspace, EV charger) in your listing description and photos.
- Regularly check competitor amenities in Babakan Madang to stay competitive.
Babakan Madang Airbnb Guest Demographics & Profile Analysis (2026)
Guest Profile Summary for Babakan Madang
- The typical guest profile for Airbnb in Babakan Madang consists of primarily domestic travelers (80%), often arriving from nearby Jakarta, typically belonging to the Post-2000s (Gen Z/Alpha) group (50%), primarily speaking Indonesian or English.
- Domestic travelers account for 80.4% of guests.
- Key international markets include Indonesia (80.4%) and United States (3.6%).
- Top languages spoken are Indonesian (44.2%) followed by English (40.4%).
- A significant demographic segment is the Post-2000s (Gen Z/Alpha) group, representing 50% of guests.
Recommendations for Hosts
- Target domestic marketing efforts towards travelers from Jakarta and Banten.
- Tailor amenities and listing descriptions to appeal to the dominant Post-2000s (Gen Z/Alpha) demographic (e.g., highlight fast WiFi, smart home features, local guides).
- Highlight unique local experiences or amenities relevant to the primary guest profile.
- Consider seasonal promotions aligned with peak travel times for key origin markets.
Nearby Short-Term Rental Market Comparison
How does the Babakan Madang Airbnb market stack up against its neighbors? Compare key performance metrics like average monthly revenue, ADR, and occupancy rates in surrounding areas to understand the broader regional STR landscape.
| Market | Active Properties | Monthly Revenue | Daily Rate | Avg. Occupancy |
|---|---|---|---|---|
| Kuta | 10 | $2,046 | $149.05 | 45% |
| Sukagalih | 13 | $1,306 | $157.45 | 34% |
| Citaringgul | 21 | $1,285 | $142.78 | 30% |
| Sukamanah | 12 | $1,151 | $148.28 | 28% |
| Ciburial | 191 | $1,114 | $288.50 | 18% |
| Leuwimalang | 15 | $1,109 | $203.41 | 20% |
| Wangunsari | 17 | $1,094 | $158.69 | 23% |
| Cigugur Girang | 21 | $1,057 | $163.07 | 19% |
| Sumur Batu | 50 | $1,026 | $180.80 | 21% |
| Kecamatan Parongpong | 14 | $1,014 | $182.15 | 23% |