Sukamanah Airbnb Market Analysis 2026: Short Term Rental Data & Vacation Rental Statistics in West Java, Indonesia
Is Airbnb profitable in Sukamanah in 2026? Explore comprehensive Airbnb analytics for Sukamanah, West Java, Indonesia to uncover income potential. This 2026 STR market report for Sukamanah, based on AirROI data from May 2024 to April 2025, reveals key trends in the niche market of 18 active listings.
Whether you're considering an Airbnb investment in Sukamanah, optimizing your existing vacation rental, or exploring rental arbitrage opportunities, understanding the Sukamanah Airbnb data is crucial. Leveraging the low regulation environment is key to maximizing your short term rental income potential. Let's dive into the specifics.
Key Sukamanah Airbnb Performance Metrics Overview
Monthly Airbnb Revenue Variations & Income Potential in Sukamanah (2026)
Understanding the monthly revenue variations for Airbnb listings in Sukamanah is key to maximizing your short term rental income potential. Seasonality significantly impacts earnings. Our analysis, based on data from the past 12 months, shows that the peak revenue month for STRs in Sukamanah is typically May, while November often presents the lowest earnings, highlighting opportunities for strategic pricing adjustments during shoulder and low seasons. Explore the typical Airbnb income in Sukamanah across different performance tiers:
- Best-in-class properties (Top 10%) achieve $5,430+ monthly, often utilizing dynamic pricing and superior guest experiences.
- Strong performing properties (Top 25%) earn $2,753 or more, indicating effective management and desirable locations/amenities.
- Typical properties (Median) generate around $1,553 per month, representing the average market performance.
- Entry-level properties (Bottom 25%) see earnings around $672, often with potential for optimization.
Average Monthly Airbnb Earnings Trend in Sukamanah
Sukamanah Airbnb Occupancy Rate Trends (2026)
Maximize your bookings by understanding the Sukamanah STR occupancy trends. Seasonal demand shifts significantly influence how often properties are booked. Typically, Maysees the highest demand (peak season occupancy), while June experiences the lowest (low season). Effective strategies, like adjusting minimum stays or offering promotions, can boost occupancy during slower periods. Here's how different property tiers perform in Sukamanah:
- Best-in-class properties (Top 10%) achieve 62%+ occupancy, indicating high desirability and potentially optimized availability.
- Strong performing properties (Top 25%) maintain 46% or higher occupancy, suggesting good market fit and guest satisfaction.
- Typical properties (Median) have an occupancy rate around 32%.
- Entry-level properties (Bottom 25%) average 21% occupancy, potentially facing higher vacancy.
Average Monthly Occupancy Rate Trend in Sukamanah
Average Daily Rate (ADR) Airbnb Trends in Sukamanah (2026)
Effective short term rental pricing strategy in Sukamanah involves understanding monthly ADR fluctuations. The Average Daily Rate (ADR) for Airbnb in Sukamanah typically peaks in April and dips lowest during September. Leveraging Airbnb dynamic pricing tools or strategies based on this seasonality can significantly boost revenue. Here's a look at the typical nightly rates achieved:
- Best-in-class properties (Top 10%) command rates of $405+ per night, often due to premium features or locations.
- Strong performing properties (Top 25%) achieve nightly rates of $241 or more.
- Typical properties (Median) charge around $142 per night.
- Entry-level properties (Bottom 25%) earn around $69 per night.
Average Daily Rate (ADR) Trend by Month in Sukamanah
Get Live Sukamanah Market Intelligence 👇

Explore Real-time Analytics
Airbnb Seasonality Analysis & Trends in Sukamanah (2025)
Peak Season (May, June, July)
- Revenue averages $4,216 per month
- Occupancy rates average 48.7%
- Daily rates average $179
Shoulder Season
- Revenue averages $1,694 per month
- Occupancy maintains around 32.4%
- Daily rates hold near $189
Low Season (March, September, November)
- Revenue drops to average $1,431 per month
- Occupancy decreases to average 25.5%
- Daily rates adjust to average $182
Seasonality Insights for Sukamanah
- The Airbnb seasonality in Sukamanah shows highly seasonal trends requiring careful strategy. While the sections above show seasonal averages, it's also insightful to look at the extremes:
- During the high season, the absolute peak month showcases Sukamanah's highest earning potential, with monthly revenues capable of climbing to $5,501, occupancy reaching a high of 96.8%, and ADRs peaking at $215.
- Conversely, the slowest single month of the year, typically falling within the low season, marks the market's lowest point. In this month, revenue might dip to $1,424, occupancy could drop to 11.7%, and ADRs may adjust down to $175.
- Understanding both the seasonal averages and these monthly peaks and troughs in revenue, occupancy, and ADR is crucial for maximizing your Airbnb profit potential in Sukamanah.
Seasonal Strategies for Maximizing Profit
- Peak Season: Maximize revenue through premium pricing and potentially longer minimum stays. Ensure high availability.
- Low Season: Offer competitive pricing, special promotions (e.g., extended stay discounts), and flexible cancellation policies. Target off-season travelers like remote workers or budget-conscious guests.
- Shoulder Seasons: Implement dynamic pricing that balances peak and low rates. Target weekend travelers or specific events. Offer slightly more flexible terms than peak season.
- Regularly analyze your own performance against these Sukamanah seasonality benchmarks and adjust your pricing and availability strategy accordingly.
Best Areas for Airbnb Investment in Sukamanah (2026)
Exploring the top neighborhoods for short-term rentals in Sukamanah? This section highlights key areas, outlining why they are attractive for hosts and guests, along with notable local attractions. Consider these locations based on your target guest profile and investment strategy.
| Neighborhood / Area | Why Host Here? (Target Guests & Appeal) | Key Attractions & Landmarks |
|---|---|---|
| Puncak | A popular mountainous escape known for its cool climate and beautiful tea plantations. Attracts domestic tourists seeking relaxation and natural beauty, making it a prime spot for vacation rentals. | Taman Safari Indonesia, Cibodas Botanical Gardens, Gunung Mas Tea Plantation, Puncak Pass, Little Venice Puncak |
| Bogor | Known for its botanical gardens and rich history, Bogor is a great spot for those wanting both nature and culture. Its proximity to Jakarta makes it a favorite weekend getaway. | Bogor Botanical Gardens, Presidential Palace, De Voyage Bogor, Taman Topi, Kebun Raya Bogor |
| Bandung | As a cultural hub with a vibrant culinary scene and proximity to various natural attractions, Bandung is ideal for tourists looking for local experiences and cool weather. | Tangkuban Perahu, Floating Market Lembang, Farmhouse Lembang, Braga Street, Kawah Putih |
| Cisarua | Nestled in the cool highlands, Cisarua appeals to families and nature lovers. Its accessibility and family-friendly attractions reinforce its position as a top destination. | Taman Safari Indonesia, The Jungle Land Adventure Park, Puncak Just Married, Cisarua Rabbit Farm, Cibodas Botanical Gardens |
| Sentul | An emerging leisure destination with numerous theme parks and natural attractions, Sentul is increasingly popular for short getaways from the bustling city. | Water Park Sentul, JungleLand Adventure Theme Park, Sentul City, EcoArt Park, Regatta Lake |
| Kota Bunga | Known for its beautiful flower gardens and scenic views, Kota Bunga is a serene escape ideal for tourists seeking tranquility and natural beauty. | Taman Bunga Nusantara, Cibalung Happy Land, Puncak Pass |
Understanding Airbnb License Requirements & STR Laws in Sukamanah (2026)
While Sukamanah, West Java, Indonesia currently shows low STR regulations, specific Airbnb license requirements might still exist or change. Always verify the latest short term rental regulations and Airbnb license requirements directly with local government authorities for Sukamanah to ensure full compliance before hosting.
(Source: AirROI data, 2026, finding no licensed listings among those analyzed)
Top Performing Airbnb Properties in Sukamanah (2026)
Benchmark your potential! Explore examples of top-performing Airbnb properties in Sukamanahbased on Trailing Twelve Month (TTM) revenue. Analyze their characteristics, revenue, occupancy rate, and ADR to understand what drives success in this market.
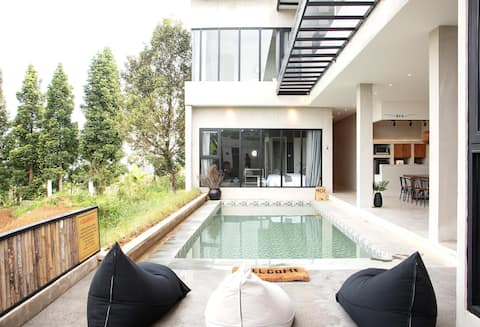
Villa Moo - Mood On & On
Entire Place • 4 bedrooms
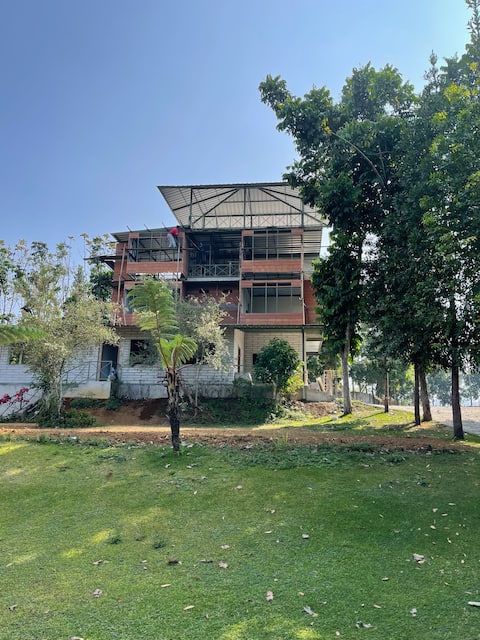
Cigwawisata- Accomodation Villa Menara Pandang
Entire Place • 8 bedrooms
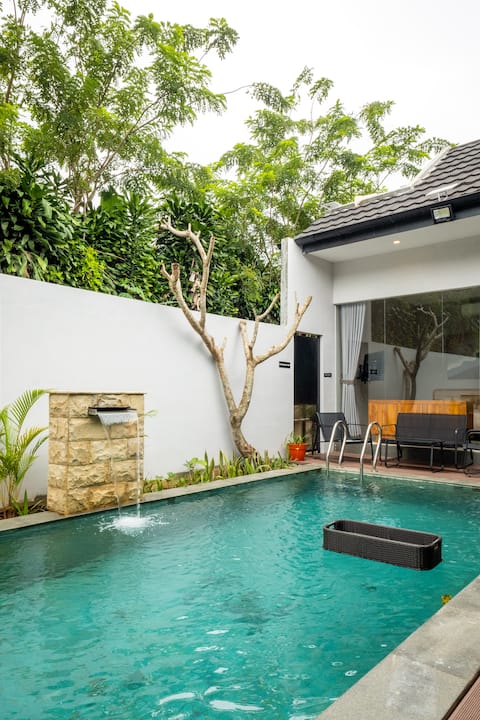
Villa Puncak Private Pool 3 BR-Casa De Nirankara 1
Entire Place • 3 bedrooms

Villa Puncak Private Pool 3BR- Casa De Nirankara 2
Entire Place • 3 bedrooms
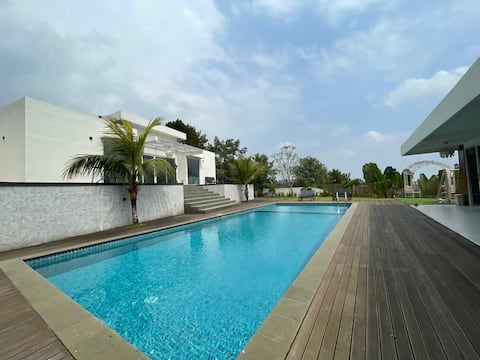
villa sulthan.f[5BR,privatepool
Entire Place • 5 bedrooms
treehouse in the forest
Entire Place • 1 bedroom
Note: Performance varies based on location, size, amenities, seasonality, and management quality. Data reflects the past 12 months.
Top Performing Airbnb Hosts in Sukamanah (2026)
Learn from the best! This table showcases top-performing Airbnb hosts in Sukamanah based on the number of properties managed and estimated total revenue over the past year. Analyze their scale and performance metrics.
| Host Name | Properties | Grossing Revenue | Stay Reviews | Avg Rating |
|---|---|---|---|---|
| Nirankara Group | 2 | $58,357 | 33 | 4.63/5.0 |
| Host #197472876 | 2 | $34,983 | 0 | 0.00/5.0 |
| Helina | 1 | $34,694 | 17 | 4.41/5.0 |
| Host #492109804 | 1 | $28,496 | 0 | 0.00/5.0 |
| Host #7341415 | 1 | $27,203 | 0 | 0.00/5.0 |
| Host #469201898 | 1 | $26,424 | 0 | 0.00/5.0 |
| Wanda | 1 | $18,545 | 7 | 4.86/5.0 |
| Sabil | 1 | $17,694 | 4 | 5.00/5.0 |
| Host #374246271 | 1 | $14,223 | 0 | 0.00/5.0 |
| Host #470320874 | 1 | $11,973 | 0 | 0.00/5.0 |
Analyzing the strategies of top hosts, such as their property selection, pricing, and guest communication, can offer valuable lessons for optimizing your own Airbnb operations in Sukamanah.
Dive Deeper: Advanced Sukamanah STR Market Data (2026)
Ready to unlock more insights? AirROI provides access to advanced metrics and comprehensive Airbnb data for Sukamanah. Explore detailed analytics beyond this report to refine your investment strategy, optimize pricing, and maximize your vacation rental profits.
Explore Advanced MetricsSukamanah Short-Term Rental Market Composition (2026): Property & Room Types
Room Type Distribution
Property Type Distribution
Market Composition Insights for Sukamanah
- The Sukamanah Airbnb market composition is heavily skewed towards Entire Home/Apt listings, which make up 88.9% of the 18 active rentals. This indicates strong guest preference for privacy and space.
- Looking at the property type distribution in Sukamanah, House properties are the most common (72.2%), reflecting the local real estate landscape.
- Houses represent a significant 72.2% portion, catering likely to families or larger groups.
- The presence of 11.1% Hotel/Boutique listings indicates integration with traditional hospitality.
Sukamanah Airbnb Room Capacity Analysis (2026): Bedroom Distribution
Distribution of Listings by Number of Bedrooms
Room Capacity Insights for Sukamanah
- The dominant room capacity in Sukamanah is 5+ bedrooms listings, making up 27.8% of the market. This suggests a strong demand for properties suitable for families or small groups.
- Together, 5+ bedrooms and 1 bedroom properties represent 55.6% of the active Airbnb listings in Sukamanah, indicating a high concentration in these sizes.
- A significant 66.7% of listings offer 3+ bedrooms, catering to larger groups and families seeking more space in Sukamanah.
Sukamanah Vacation Rental Guest Capacity Trends (2026)
Distribution of Listings by Guest Capacity
Guest Capacity Insights for Sukamanah
- The most common guest capacity trend in Sukamanah vacation rentals is listings accommodating 8+ guests (66.7%). This suggests the primary traveler segment is likely larger groups.
- Properties designed for 8+ guests and 2 guests dominate the Sukamanah STR market, accounting for 77.8% of listings.
- 66.7% of properties accommodate 6+ guests, serving the market segment for larger families or group travel in Sukamanah.
- On average, properties in Sukamanah are equipped to host 6.5 guests.
Sukamanah Airbnb Booking Patterns (2026): Available vs. Booked Days
Available Days Distribution
Booked Days Distribution
Booking Pattern Insights for Sukamanah
- The most common availability pattern in Sukamanah falls within the 271-366 days range, representing 66.7% of listings. This suggests many properties have significant open periods on their calendars.
- Approximately 83.4% of listings show high availability (181+ days open annually), indicating potential for increased bookings or specific owner usage patterns.
- For booked days, the 31-90 days range is most frequent in Sukamanah (55.6%), reflecting common guest stay durations or potential owner blocking patterns.
- A notable 16.7% of properties secure long booking periods (181+ days booked per year), highlighting successful long-term rental strategies or significant owner usage.
Sukamanah Airbnb Minimum Stay Requirements Analysis
Distribution of Listings by Minimum Night Requirement
1 Night
18 listings
100% of total
Key Insights
- The most prevalent minimum stay requirement in Sukamanah is 1 Night, adopted by 100% of listings. This highlights the market's preference for shorter, flexible bookings.
- A strong majority (100.0%) of the Sukamanah Airbnb data shows acceptance of very short stays (1-2 nights), indicating a dynamic, high-turnover market.
Recommendations
- Align with the market by considering a 1 Night minimum stay, as 100% of Sukamanah hosts use this setting.
- Adjust minimum nights based on seasonality – potentially shorter during low season and longer during peak demand periods in Sukamanah.
Sukamanah Airbnb Cancellation Policy Trends Analysis (2026)
Flexible
1 listings
12.5% of total
Moderate
3 listings
37.5% of total
Firm
1 listings
12.5% of total
Strict
3 listings
37.5% of total
Cancellation Policy Insights for Sukamanah
- The prevailing Airbnb cancellation policy trend in Sukamanah is Moderate, used by 37.5% of listings.
- There's a relatively balanced mix between guest-friendly (50.0%) and stricter (50.0%) policies, offering choices for different guest needs.
Recommendations for Hosts
- Consider adopting a Moderate policy to align with the 37.5% market standard in Sukamanah.
- With 37.5% using Strict terms, this is a viable option in Sukamanah, particularly for high-value properties or during peak demand periods.
- Regularly review your cancellation policy against competitors and market demand shifts in Sukamanah.
Sukamanah STR Booking Lead Time Analysis (2026)
Average Booking Lead Time by Month
Booking Lead Time Insights for Sukamanah
- The overall average booking lead time for vacation rentals in Sukamanah is 19 days.
- Guests book furthest in advance for stays during May (average 77 days), likely coinciding with peak travel demand or local events.
- The shortest booking windows occur for stays in November (average 8 days), indicating more last-minute travel plans during this time.
- Seasonally, Spring (41 days avg.) sees the longest lead times, while Fall (14 days avg.) has the shortest, reflecting typical travel planning cycles.
Recommendations for Hosts
- Use the overall average lead time (19 days) as a baseline for your pricing and availability strategy in Sukamanah.
- For May stays, consider implementing length-of-stay discounts or slightly higher rates for bookings made less than 77 days out to capitalize on advance planning.
- During November, focus on last-minute booking availability and promotions, as guests book with very short notice (8 days avg.).
- Target marketing efforts for the Spring season well in advance (at least 41 days) to capture early planners.
- Monitor your own booking lead times against these Sukamanah averages to identify opportunities for dynamic pricing adjustments.
Popular & Essential Airbnb Amenities in Sukamanah (2026)
Amenity Prevalence
Amenity Insights for Sukamanah
- Essential amenities in Sukamanah that guests expect include: TV, Kitchen, Hot water, Essentials. Lacking these (any) could significantly impact bookings.
- Popular amenities like Wifi, Pool, Air conditioning are common but not universal. Offering these can provide a competitive edge.
- A pool is a highly desired but not standard amenity, making it a key feature for attracting guests seeking leisure in Sukamanah.
- Warning: Wifi is not universally provided but is considered essential globally. Ensure reliable Wifi is offered.
Recommendations for Hosts
- Ensure your listing includes all essential amenities for Sukamanah: TV, Kitchen, Hot water, Essentials.
- Consider adding popular differentiators like Wifi or Pool to increase appeal.
- Highlight unique or less common amenities you offer (e.g., hot tub, dedicated workspace, EV charger) in your listing description and photos.
- Regularly check competitor amenities in Sukamanah to stay competitive.
Sukamanah Airbnb Guest Demographics & Profile Analysis (2026)
Guest Profile Summary for Sukamanah
- The typical guest profile for Airbnb in Sukamanah consists of primarily domestic travelers (68%), often arriving from nearby Jakarta, typically belonging to the Post-2000s (Gen Z/Alpha) group (50%), primarily speaking Indonesian or English.
- Domestic travelers account for 67.9% of guests.
- Key international markets include Indonesia (67.9%) and Saudi Arabia (17.9%).
- Top languages spoken are Indonesian (38.5%) followed by English (38.5%).
- A significant demographic segment is the Post-2000s (Gen Z/Alpha) group, representing 50% of guests.
Recommendations for Hosts
- Target domestic marketing efforts towards travelers from Jakarta and West Java.
- Tailor amenities and listing descriptions to appeal to the dominant Post-2000s (Gen Z/Alpha) demographic (e.g., highlight fast WiFi, smart home features, local guides).
- Highlight unique local experiences or amenities relevant to the primary guest profile.
- Consider seasonal promotions aligned with peak travel times for key origin markets.
Nearby Short-Term Rental Market Comparison
How does the Sukamanah Airbnb market stack up against its neighbors? Compare key performance metrics like average monthly revenue, ADR, and occupancy rates in surrounding areas to understand the broader regional STR landscape.
| Market | Active Properties | Monthly Revenue | Daily Rate | Avg. Occupancy |
|---|---|---|---|---|
| Wangunsari | 13 | $2,109 | $170.93 | 30% |
| Kuta | 13 | $2,025 | $142.00 | 51% |
| Ciburial | 230 | $1,785 | $279.85 | 19% |
| Sumur Batu | 57 | $1,730 | $200.62 | 26% |
| Cihideung | 49 | $1,704 | $228.02 | 26% |
| Cigugur Girang | 15 | $1,623 | $155.65 | 27% |
| Leuwimalang | 16 | $1,467 | $180.39 | 22% |
| Banjar Sari | 11 | $1,401 | $187.84 | 16% |
| Cimacan | 16 | $1,371 | $255.37 | 18% |
| Batu Layang | 34 | $1,361 | $215.62 | 25% |