Kenmare Municipal District Airbnb Market Analysis 2026: Short Term Rental Data & Vacation Rental Statistics in County Kerry, Ireland
Is Airbnb profitable in Kenmare Municipal District in 2026? Explore comprehensive Airbnb analytics for Kenmare Municipal District, County Kerry, Ireland to uncover income potential. This 2026 STR market report for Kenmare Municipal District, based on AirROI data from February 2025 to January 2026, reveals key trends in the bustling market of 1,525 active listings.
Whether you're considering an Airbnb investment in Kenmare Municipal District, optimizing your existing vacation rental, or exploring rental arbitrage opportunities, understanding the Kenmare Municipal District Airbnb data is crucial. Leveraging the low regulation environment is key to maximizing your short term rental income potential. Let's dive into the specifics.
Key Kenmare Municipal District Airbnb Performance Metrics Overview
Monthly Airbnb Revenue Variations & Income Potential in Kenmare Municipal District (2026)
Understanding the monthly revenue variations for Airbnb listings in Kenmare Municipal District is key to maximizing your short term rental income potential. Seasonality significantly impacts earnings. Our analysis, based on data from the past 12 months, shows that the peak revenue month for STRs in Kenmare Municipal District is typically August, while February often presents the lowest earnings, highlighting opportunities for strategic pricing adjustments during shoulder and low seasons. Explore the typical Airbnb income in Kenmare Municipal District across different performance tiers:
- Best-in-class properties (Top 10%) achieve $6,077+ monthly, often utilizing dynamic pricing and superior guest experiences.
- Strong performing properties (Top 25%) earn $3,970 or more, indicating effective management and desirable locations/amenities.
- Typical properties (Median) generate around $2,425 per month, representing the average market performance.
- Entry-level properties (Bottom 25%) see earnings around $1,375, often with potential for optimization.
Average Monthly Airbnb Earnings Trend in Kenmare Municipal District
Kenmare Municipal District Airbnb Occupancy Rate Trends (2026)
Maximize your bookings by understanding the Kenmare Municipal District STR occupancy trends. Seasonal demand shifts significantly influence how often properties are booked. Typically, Augustsees the highest demand (peak season occupancy), while January experiences the lowest (low season). Effective strategies, like adjusting minimum stays or offering promotions, can boost occupancy during slower periods. Here's how different property tiers perform in Kenmare Municipal District:
- Best-in-class properties (Top 10%) achieve 82%+ occupancy, indicating high desirability and potentially optimized availability.
- Strong performing properties (Top 25%) maintain 65% or higher occupancy, suggesting good market fit and guest satisfaction.
- Typical properties (Median) have an occupancy rate around 46%.
- Entry-level properties (Bottom 25%) average 26% occupancy, potentially facing higher vacancy.
Average Monthly Occupancy Rate Trend in Kenmare Municipal District
Average Daily Rate (ADR) Airbnb Trends in Kenmare Municipal District (2026)
Effective short term rental pricing strategy in Kenmare Municipal District involves understanding monthly ADR fluctuations. The Average Daily Rate (ADR) for Airbnb in Kenmare Municipal District typically peaks in September and dips lowest during February. Leveraging Airbnb dynamic pricing tools or strategies based on this seasonality can significantly boost revenue. Here's a look at the typical nightly rates achieved:
- Best-in-class properties (Top 10%) command rates of $351+ per night, often due to premium features or locations.
- Strong performing properties (Top 25%) achieve nightly rates of $248 or more.
- Typical properties (Median) charge around $174 per night.
- Entry-level properties (Bottom 25%) earn around $128 per night.
Average Daily Rate (ADR) Trend by Month in Kenmare Municipal District
Get Live Kenmare Municipal District Market Intelligence 👇

Explore Real-time Analytics
Airbnb Seasonality Analysis & Trends in Kenmare Municipal District (2026)
Peak Season (August, July, June)
- Revenue averages $4,577 per month
- Occupancy rates average 65.9%
- Daily rates average $217
Shoulder Season
- Revenue averages $2,912 per month
- Occupancy maintains around 44.7%
- Daily rates hold near $216
Low Season (January, February, March)
- Revenue drops to average $1,842 per month
- Occupancy decreases to average 30.7%
- Daily rates adjust to average $200
Seasonality Insights for Kenmare Municipal District
- The Airbnb seasonality in Kenmare Municipal District shows highly seasonal trends requiring careful strategy. While the sections above show seasonal averages, it's also insightful to look at the extremes:
- During the high season, the absolute peak month showcases Kenmare Municipal District's highest earning potential, with monthly revenues capable of climbing to $5,185, occupancy reaching a high of 73.4%, and ADRs peaking at $228.
- Conversely, the slowest single month of the year, typically falling within the low season, marks the market's lowest point. In this month, revenue might dip to $1,652, occupancy could drop to 24.3%, and ADRs may adjust down to $190.
- Understanding both the seasonal averages and these monthly peaks and troughs in revenue, occupancy, and ADR is crucial for maximizing your Airbnb profit potential in Kenmare Municipal District.
Seasonal Strategies for Maximizing Profit
- Peak Season: Maximize revenue through premium pricing and potentially longer minimum stays. Ensure high availability.
- Low Season: Offer competitive pricing, special promotions (e.g., extended stay discounts), and flexible cancellation policies. Target off-season travelers like remote workers or budget-conscious guests.
- Shoulder Seasons: Implement dynamic pricing that balances peak and low rates. Target weekend travelers or specific events. Offer slightly more flexible terms than peak season.
- Regularly analyze your own performance against these Kenmare Municipal District seasonality benchmarks and adjust your pricing and availability strategy accordingly.
Best Areas for Airbnb Investment in Kenmare Municipal District (2026)
Exploring the top neighborhoods for short-term rentals in Kenmare Municipal District? This section highlights key areas, outlining why they are attractive for hosts and guests, along with notable local attractions. Consider these locations based on your target guest profile and investment strategy.
| Neighborhood / Area | Why Host Here? (Target Guests & Appeal) | Key Attractions & Landmarks |
|---|---|---|
| Kenmare Town | Charming market town with a rich history and beautiful scenery. Popular with tourists seeking gourmet food, local crafts, and cozy accommodations near the Ring of Kerry. | Kenmare Stone Circle, Beara Way Walking Trail, Kenmare Bay, Holy Cross Church, Molly Gallivan's Cottage |
| Sneem | Picturesque village with colorful houses, located along the scenic Ring of Kerry route. Great for travelers looking to relax and enjoy stunning landscapes and outdoor activities. | Sneem River, Gairdin Na Scéalta, The Sneem Art Gallery, Blueberry Hill Farm, Sneem Beach |
| Gleninchaquin Park | Natural park known for its dramatic landscapes and walking trails. Perfect for nature lovers and those looking for a tranquil getaway in the countryside. | Gleninchaquin Waterfall, Walking Trails, Stunning Views of the Beara Peninsula, Picnic Areas |
| Kerry Head | Quaint coastal area with spectacular sea views and opportunities for outdoor activities. Attracts guests interested in hiking and exploring Ireland's rugged coastline. | Kerry Head Lighthouse, Walking Trails, Stunning Coastal Views, Historical Significance, Local Wildlife |
| Killarney National Park | Famous national park with scenic lakes and mountains. Ideal for those who enjoy outdoor adventures such as hiking, cycling, and exploring nature. | Lough Leane, Muckross House and Gardens, Gap of Dunloe, Torc Waterfall, Ross Castle |
| Ring of Beara | Scenic tourist route that offers some of the best coastal views in Ireland. Attracts tourists looking for breathtaking scenery and outdoor exploration. | Dursey Island, Castletownbere, Beara Peninsula, Historical Sites, Local Craft Shops |
| Caha Mountains | Stunning mountain range offering hiking opportunities and picturesque views. Attracts outdoor enthusiasts and nature lovers. | Hiking Trails, Breathtaking Views, Local Flora and Fauna, Cultural Heritage Sites |
| Macgillicuddy's Reeks | Highest mountain range in Ireland, offering challenging climbs and stunning panoramic views. Popular with adventure seekers and mountaineers. | Carrauntoohil, Hiking Trails, Beautiful Lakes, Local Wildlife, Historical Monuments |
Understanding Airbnb License Requirements & STR Laws in Kenmare Municipal District (2026)
While Kenmare Municipal District, County Kerry, Ireland currently shows low STR regulations, specific Airbnb license requirements might still exist or change. Always verify the latest short term rental regulations and Airbnb license requirements directly with local government authorities for Kenmare Municipal District to ensure full compliance before hosting.
(Source: AirROI data, 2026, finding no licensed listings among those analyzed)
Top Performing Airbnb Properties in Kenmare Municipal District (2026)
Benchmark your potential! Explore examples of top-performing Airbnb properties in Kenmare Municipal Districtbased on Trailing Twelve Month (TTM) revenue. Analyze their characteristics, revenue, occupancy rate, and ADR to understand what drives success in this market.
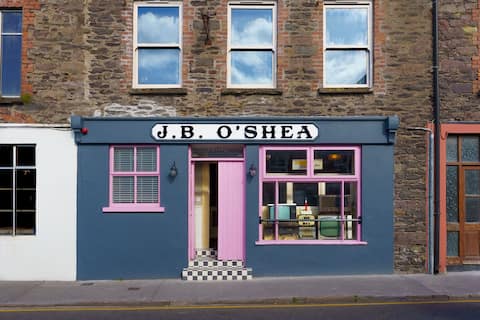
J.B. O’Shea - Old world Irish pub
Entire Place • 6 bedrooms

Killorglin Irish Pub with Hot Tub that sleeps 19
Entire Place • 4 bedrooms
Ashe's 7 bedrooms Townhouse, Dingle Town Centre.
Entire Place • 7 bedrooms
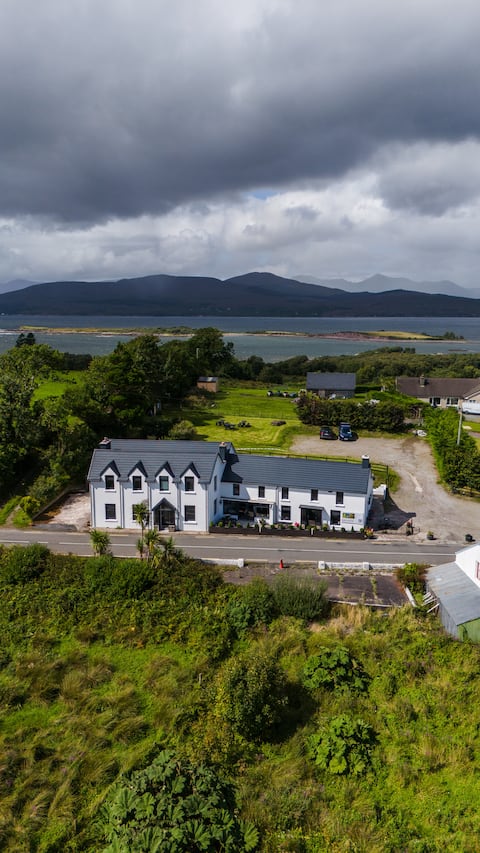
Lake House & Pub Kerry – Large Groups Bookings
Entire Place • 11 bedrooms
Country Setting in the Middle of Dingle Town
Entire Place • 4 bedrooms

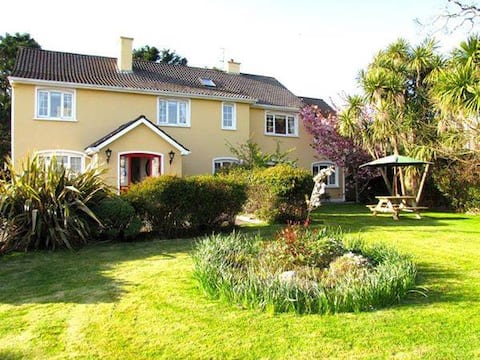
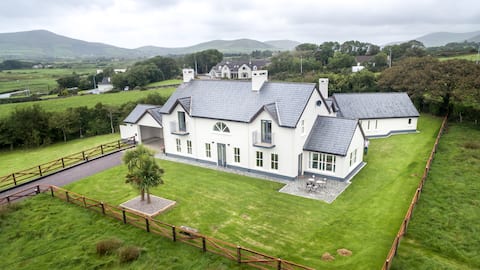
Dunkerron Luxury Manor
Entire Place • 8 bedrooms
Note: Performance varies based on location, size, amenities, seasonality, and management quality. Data reflects the past 12 months.
Top Performing Airbnb Hosts in Kenmare Municipal District (2026)
Learn from the best! This table showcases top-performing Airbnb hosts in Kenmare Municipal District based on the number of properties managed and estimated total revenue over the past year. Analyze their scale and performance metrics.
| Host Name | Properties | Grossing Revenue | Stay Reviews | Avg Rating |
|---|---|---|---|---|
| Lauren | 48 | $2,259,688 | 2407 | 4.84/5.0 |
| Experience Dingle | 30 | $2,116,962 | 900 | 4.90/5.0 |
| Trident Holiday Homes | 30 | $1,395,136 | 346 | 4.59/5.0 |
| Lisa | 31 | $535,220 | 508 | 4.83/5.0 |
| Douglas | 8 | $473,968 | 1301 | 4.97/5.0 |
| Dream Ireland | 19 | $422,321 | 47 | 4.80/5.0 |
| Joe | 7 | $362,539 | 569 | 4.92/5.0 |
| Brian | 7 | $333,662 | 806 | 4.96/5.0 |
| Zhaia | 12 | $305,866 | 330 | 4.83/5.0 |
| Tom | 2 | $294,566 | 119 | 5.00/5.0 |
Analyzing the strategies of top hosts, such as their property selection, pricing, and guest communication, can offer valuable lessons for optimizing your own Airbnb operations in Kenmare Municipal District.
Dive Deeper: Advanced Kenmare Municipal District STR Market Data (2026)
Ready to unlock more insights? AirROI provides access to advanced metrics and comprehensive Airbnb data for Kenmare Municipal District. Explore detailed analytics beyond this report to refine your investment strategy, optimize pricing, and maximize your vacation rental profits.
Explore Advanced MetricsKenmare Municipal District Short-Term Rental Market Composition (2026): Property & Room Types
Room Type Distribution
Property Type Distribution
Market Composition Insights for Kenmare Municipal District
- The Kenmare Municipal District Airbnb market composition is heavily skewed towards Entire Home/Apt listings, which make up 78.2% of the 1,525 active rentals. This indicates strong guest preference for privacy and space.
- Looking at the property type distribution in Kenmare Municipal District, House properties are the most common (65.5%), reflecting the local real estate landscape.
- Houses represent a significant 65.5% portion, catering likely to families or larger groups.
- The presence of 12.6% Hotel/Boutique listings indicates integration with traditional hospitality.
- Smaller segments like others, unique stays (combined 4.4%) offer potential for unique stay experiences.
Kenmare Municipal District Airbnb Room Capacity Analysis (2026): Bedroom Distribution
Distribution of Listings by Number of Bedrooms
Room Capacity Insights for Kenmare Municipal District
- The dominant room capacity in Kenmare Municipal District is 3 bedrooms listings, making up 28.6% of the market. This suggests a strong demand for properties suitable for families or small groups.
- Together, 3 bedrooms and 1 bedroom properties represent 48.0% of the active Airbnb listings in Kenmare Municipal District, indicating a high concentration in these sizes.
- A significant 49.0% of listings offer 3+ bedrooms, catering to larger groups and families seeking more space in Kenmare Municipal District.
Kenmare Municipal District Vacation Rental Guest Capacity Trends (2026)
Distribution of Listings by Guest Capacity
Guest Capacity Insights for Kenmare Municipal District
- The most common guest capacity trend in Kenmare Municipal District vacation rentals is listings accommodating 6 guests (21%). This suggests the primary traveler segment is likely larger groups.
- Properties designed for 6 guests and 8+ guests dominate the Kenmare Municipal District STR market, accounting for 39.1% of listings.
- 44.6% of properties accommodate 6+ guests, serving the market segment for larger families or group travel in Kenmare Municipal District.
- On average, properties in Kenmare Municipal District are equipped to host 4.4 guests.
Kenmare Municipal District Airbnb Booking Patterns (2026): Available vs. Booked Days
Available Days Distribution
Booked Days Distribution
Booking Pattern Insights for Kenmare Municipal District
- The most common availability pattern in Kenmare Municipal District falls within the 181-270 days range, representing 40.5% of listings. This suggests many properties have significant open periods on their calendars.
- Approximately 71.3% of listings show high availability (181+ days open annually), indicating potential for increased bookings or specific owner usage patterns.
- For booked days, the 91-180 days range is most frequent in Kenmare Municipal District (39.7%), reflecting common guest stay durations or potential owner blocking patterns.
- A notable 30.9% of properties secure long booking periods (181+ days booked per year), highlighting successful long-term rental strategies or significant owner usage.
Kenmare Municipal District Airbnb Minimum Stay Requirements Analysis
Distribution of Listings by Minimum Night Requirement
1 Night
303 listings
19.9% of total
2 Nights
247 listings
16.2% of total
3 Nights
106 listings
7% of total
4-6 Nights
161 listings
10.6% of total
7-29 Nights
34 listings
2.2% of total
30+ Nights
673 listings
44.2% of total
Key Insights
- The most prevalent minimum stay requirement in Kenmare Municipal District is 30+ Nights, adopted by 44.2% of listings. This highlights the market's preference for longer commitments.
- A significant segment (44.2%) caters to monthly stays (30+ nights) in Kenmare Municipal District, pointing to opportunities in the extended-stay market.
Recommendations
- Align with the market by considering a 30+ Nights minimum stay, as 44.2% of Kenmare Municipal District hosts use this setting.
- If feasible, allowing 1-night stays, especially midweek or during low season, could capture last-minute bookings, as only 19.9% currently do.
- Explore offering discounts for stays of 30+ nights to attract the 44.2% of the market seeking extended stays.
- Adjust minimum nights based on seasonality – potentially shorter during low season and longer during peak demand periods in Kenmare Municipal District.
Kenmare Municipal District Airbnb Cancellation Policy Trends Analysis (2026)
Super Strict 60 Days
67 listings
4.4% of total
Limited
8 listings
0.5% of total
Super Strict 30 Days
24 listings
1.6% of total
Flexible
276 listings
18.1% of total
Moderate
428 listings
28.1% of total
Firm
459 listings
30.1% of total
Strict
262 listings
17.2% of total
Cancellation Policy Insights for Kenmare Municipal District
- The prevailing Airbnb cancellation policy trend in Kenmare Municipal District is Firm, used by 30.1% of listings.
- There's a relatively balanced mix between guest-friendly (46.2%) and stricter (47.3%) policies, offering choices for different guest needs.
Recommendations for Hosts
- Consider adopting a Firm policy to align with the 30.1% market standard in Kenmare Municipal District.
- Regularly review your cancellation policy against competitors and market demand shifts in Kenmare Municipal District.
Kenmare Municipal District STR Booking Lead Time Analysis (2026)
Average Booking Lead Time by Month
Booking Lead Time Insights for Kenmare Municipal District
- The overall average booking lead time for vacation rentals in Kenmare Municipal District is 84 days.
- Guests book furthest in advance for stays during August (average 118 days), likely coinciding with peak travel demand or local events.
- The shortest booking windows occur for stays in February (average 52 days), indicating more last-minute travel plans during this time.
- Seasonally, Summer (103 days avg.) sees the longest lead times, while Winter (65 days avg.) has the shortest, reflecting typical travel planning cycles.
Recommendations for Hosts
- Use the overall average lead time (84 days) as a baseline for your pricing and availability strategy in Kenmare Municipal District.
- For August stays, consider implementing length-of-stay discounts or slightly higher rates for bookings made less than 118 days out to capitalize on advance planning.
- Target marketing efforts for the Summer season well in advance (at least 103 days) to capture early planners.
- Monitor your own booking lead times against these Kenmare Municipal District averages to identify opportunities for dynamic pricing adjustments.
Popular & Essential Airbnb Amenities in Kenmare Municipal District (2026)
Amenity Prevalence
Amenity Insights for Kenmare Municipal District
- Essential amenities in Kenmare Municipal District that guests expect include: Smoke alarm. Lacking these (this) could significantly impact bookings.
- Popular amenities like Wifi, Heating, Free parking on premises are common but not universal. Offering these can provide a competitive edge.
- Warning: Wifi is not universally provided but is considered essential globally. Ensure reliable Wifi is offered.
Recommendations for Hosts
- Ensure your listing includes all essential amenities for Kenmare Municipal District: Smoke alarm.
- Prioritize adding missing essentials: Smoke alarm.
- Consider adding popular differentiators like Wifi or Heating to increase appeal.
- Highlight unique or less common amenities you offer (e.g., hot tub, dedicated workspace, EV charger) in your listing description and photos.
- Regularly check competitor amenities in Kenmare Municipal District to stay competitive.
Kenmare Municipal District Airbnb Guest Demographics & Profile Analysis (2026)
Guest Profile Summary for Kenmare Municipal District
- The typical guest profile for Airbnb in Kenmare Municipal District consists of predominantly international visitors (80%), with top international origins including Ireland, typically belonging to the Post-2000s (Gen Z/Alpha) group (50%), primarily speaking English or French.
- Domestic travelers account for 20.1% of guests.
- Key international markets include United States (37.9%) and Ireland (20.1%).
- Top languages spoken are English (57.2%) followed by French (10.7%).
- A significant demographic segment is the Post-2000s (Gen Z/Alpha) group, representing 50% of guests.
Recommendations for Hosts
- Focus marketing internationally, particularly towards travelers from Ireland.
- Tailor amenities and listing descriptions to appeal to the dominant Post-2000s (Gen Z/Alpha) demographic (e.g., highlight fast WiFi, smart home features, local guides).
- Highlight unique local experiences or amenities relevant to the primary guest profile.
- Consider seasonal promotions aligned with peak travel times for key origin markets.
Nearby Short-Term Rental Market Comparison
How does the Kenmare Municipal District Airbnb market stack up against its neighbors? Compare key performance metrics like average monthly revenue, ADR, and occupancy rates in surrounding areas to understand the broader regional STR landscape.
| Market | Active Properties | Monthly Revenue | Daily Rate | Avg. Occupancy |
|---|---|---|---|---|
| Liscannor | 10 | $3,890 | $336.22 | 38% |
| Galway | 827 | $3,386 | $258.99 | 54% |
| Dingle | 24 | $3,325 | $330.71 | 45% |
| Killarney Municipal District | 451 | $3,183 | $257.51 | 52% |
| Roundstone | 11 | $2,872 | $321.33 | 42% |
| The Municipal District of Newcastle West | 38 | $2,528 | $282.76 | 42% |
| Kenmare | 22 | $2,230 | $243.94 | 46% |
| West Clare Municipal District | 907 | $2,206 | $213.24 | 45% |
| Conamara Municipal District | 818 | $2,195 | $249.85 | 43% |
| Westport-Belmullet Municipal District | 704 | $2,081 | $200.86 | 43% |