The Municipal District of Castlecomer Airbnb Market Analysis 2026: Short Term Rental Data & Vacation Rental Statistics in County Kilkenny, Ireland
Is Airbnb profitable in The Municipal District of Castlecomer in 2026? Explore comprehensive Airbnb analytics for The Municipal District of Castlecomer, County Kilkenny, Ireland to uncover income potential. This 2026 STR market report for The Municipal District of Castlecomer, based on AirROI data from February 2025 to January 2026, reveals key trends in the niche market of 43 active listings.
Whether you're considering an Airbnb investment in The Municipal District of Castlecomer, optimizing your existing vacation rental, or exploring rental arbitrage opportunities, understanding the The Municipal District of Castlecomer Airbnb data is crucial. Leveraging the low regulation environment is key to maximizing your short term rental income potential. Let's dive into the specifics.
Key The Municipal District of Castlecomer Airbnb Performance Metrics Overview
Monthly Airbnb Revenue Variations & Income Potential in The Municipal District of Castlecomer (2026)
Understanding the monthly revenue variations for Airbnb listings in The Municipal District of Castlecomer is key to maximizing your short term rental income potential. Seasonality significantly impacts earnings. Our analysis, based on data from the past 12 months, shows that the peak revenue month for STRs in The Municipal District of Castlecomer is typically August, while January often presents the lowest earnings, highlighting opportunities for strategic pricing adjustments during shoulder and low seasons. Explore the typical Airbnb income in The Municipal District of Castlecomer across different performance tiers:
- Best-in-class properties (Top 10%) achieve $7,716+ monthly, often utilizing dynamic pricing and superior guest experiences.
- Strong performing properties (Top 25%) earn $3,343 or more, indicating effective management and desirable locations/amenities.
- Typical properties (Median) generate around $1,898 per month, representing the average market performance.
- Entry-level properties (Bottom 25%) see earnings around $939, often with potential for optimization.
Average Monthly Airbnb Earnings Trend in The Municipal District of Castlecomer
The Municipal District of Castlecomer Airbnb Occupancy Rate Trends (2026)
Maximize your bookings by understanding the The Municipal District of Castlecomer STR occupancy trends. Seasonal demand shifts significantly influence how often properties are booked. Typically, Augustsees the highest demand (peak season occupancy), while January experiences the lowest (low season). Effective strategies, like adjusting minimum stays or offering promotions, can boost occupancy during slower periods. Here's how different property tiers perform in The Municipal District of Castlecomer:
- Best-in-class properties (Top 10%) achieve 81%+ occupancy, indicating high desirability and potentially optimized availability.
- Strong performing properties (Top 25%) maintain 61% or higher occupancy, suggesting good market fit and guest satisfaction.
- Typical properties (Median) have an occupancy rate around 42%.
- Entry-level properties (Bottom 25%) average 23% occupancy, potentially facing higher vacancy.
Average Monthly Occupancy Rate Trend in The Municipal District of Castlecomer
Average Daily Rate (ADR) Airbnb Trends in The Municipal District of Castlecomer (2026)
Effective short term rental pricing strategy in The Municipal District of Castlecomer involves understanding monthly ADR fluctuations. The Average Daily Rate (ADR) for Airbnb in The Municipal District of Castlecomer typically peaks in August and dips lowest during September. Leveraging Airbnb dynamic pricing tools or strategies based on this seasonality can significantly boost revenue. Here's a look at the typical nightly rates achieved:
- Best-in-class properties (Top 10%) command rates of $479+ per night, often due to premium features or locations.
- Strong performing properties (Top 25%) achieve nightly rates of $207 or more.
- Typical properties (Median) charge around $139 per night.
- Entry-level properties (Bottom 25%) earn around $102 per night.
Average Daily Rate (ADR) Trend by Month in The Municipal District of Castlecomer
Get Live The Municipal District of Castlecomer Market Intelligence 👇

Explore Real-time Analytics
Airbnb Seasonality Analysis & Trends in The Municipal District of Castlecomer (2026)
Peak Season (August, July, September)
- Revenue averages $4,737 per month
- Occupancy rates average 60.8%
- Daily rates average $239
Shoulder Season
- Revenue averages $3,204 per month
- Occupancy maintains around 40.6%
- Daily rates hold near $231
Low Season (January, February, April)
- Revenue drops to average $2,609 per month
- Occupancy decreases to average 33.0%
- Daily rates adjust to average $226
Seasonality Insights for The Municipal District of Castlecomer
- The Airbnb seasonality in The Municipal District of Castlecomer shows highly seasonal trends requiring careful strategy. While the sections above show seasonal averages, it's also insightful to look at the extremes:
- During the high season, the absolute peak month showcases The Municipal District of Castlecomer's highest earning potential, with monthly revenues capable of climbing to $5,244, occupancy reaching a high of 70.0%, and ADRs peaking at $248.
- Conversely, the slowest single month of the year, typically falling within the low season, marks the market's lowest point. In this month, revenue might dip to $2,490, occupancy could drop to 25.1%, and ADRs may adjust down to $220.
- Understanding both the seasonal averages and these monthly peaks and troughs in revenue, occupancy, and ADR is crucial for maximizing your Airbnb profit potential in The Municipal District of Castlecomer.
Seasonal Strategies for Maximizing Profit
- Peak Season: Maximize revenue through premium pricing and potentially longer minimum stays. Ensure high availability.
- Low Season: Offer competitive pricing, special promotions (e.g., extended stay discounts), and flexible cancellation policies. Target off-season travelers like remote workers or budget-conscious guests.
- Shoulder Seasons: Implement dynamic pricing that balances peak and low rates. Target weekend travelers or specific events. Offer slightly more flexible terms than peak season.
- Regularly analyze your own performance against these The Municipal District of Castlecomer seasonality benchmarks and adjust your pricing and availability strategy accordingly.
Best Areas for Airbnb Investment in The Municipal District of Castlecomer (2026)
Exploring the top neighborhoods for short-term rentals in The Municipal District of Castlecomer? This section highlights key areas, outlining why they are attractive for hosts and guests, along with notable local attractions. Consider these locations based on your target guest profile and investment strategy.
| Neighborhood / Area | Why Host Here? (Target Guests & Appeal) | Key Attractions & Landmarks |
|---|---|---|
| Castlecomer Town | Central location in the Municipal District with historical significance and local amenities. Ideal for guests looking for a charming village experience with access to local shops and services. | Castlecomer Discovery Park, The Kilkenny Way, Local Markets, St. Patrick's Church, Heritage Centre |
| Kilkenny City | Nearby city known for its medieval charm, arts, and vibrant cultural scene. A great choice for tourists looking to explore rich history and contemporary attractions. | Kilkenny Castle, Smithwick's Experience, St. Canice's Cathedral, Medieval Mile, Rothe House |
| Dunmore Cave | A popular natural attraction that draws tourists interested in geology and history. Provides unique accommodation options for those wishing to explore the caves and surrounding nature. | Dunmore Cave, Nature walks, Historical tours |
| Ballyragget | Quaint village offering a picturesque rural experience, appealing to those wanting peace and quiet outside the city. Connects well with outdoor activities and local culture. | The River Nore, Local Farms, Community Events |
| Galmoy | Rural setting with beautiful landscapes and outdoor activities. Attractive for those seeking a countryside retreat. | Galmoy Castle, Walking Trails, Scenic Views |
| Clogh | A small, peaceful village that offers a break from city life while still being accessible to larger attractions in Kilkenny. | Local Festivals, Countryside Activities |
| Jenkinstown | Another rural locale which is great for those interested in nature, walking, and cycling in beautiful surroundings. | Jenkinstown Wood, Picnic Areas, Nature Trails |
| Castlecomer Golf Club | Attracts golf enthusiasts and families looking for leisure activities in a picturesque setting. Ideal for those wanting to combine a golfing holiday with attractions in Castlecomer. | Golfing, Clubhouse Events, Nearby Nature |
Understanding Airbnb License Requirements & STR Laws in The Municipal District of Castlecomer (2026)
While The Municipal District of Castlecomer, County Kilkenny, Ireland currently shows low STR regulations, specific Airbnb license requirements might still exist or change. Always verify the latest short term rental regulations and Airbnb license requirements directly with local government authorities for The Municipal District of Castlecomer to ensure full compliance before hosting.
(Source: AirROI data, 2026, finding no licensed listings among those analyzed)
Top Performing Airbnb Properties in The Municipal District of Castlecomer (2026)
Benchmark your potential! Explore examples of top-performing Airbnb properties in The Municipal District of Castlecomerbased on Trailing Twelve Month (TTM) revenue. Analyze their characteristics, revenue, occupancy rate, and ADR to understand what drives success in this market.
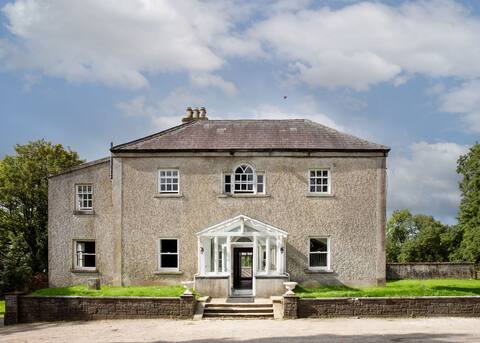
Mountrothe House
Entire Place • 7 bedrooms

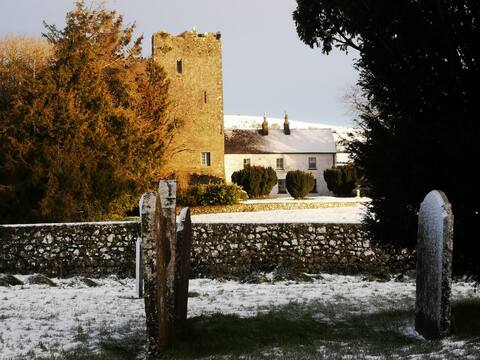
Tubbrid Castle: Your 15th-Century Irish Castle
Entire Place • 3 bedrooms
Clomantagh Castle
Entire Place • 6 bedrooms

Georgian Farmhouse in Kilkenny Groups of 16 Beds11
Entire Place • 5 bedrooms

Gragara House
Entire Place • 4 bedrooms

The Balief Rectory
Entire Place • 5 bedrooms
Note: Performance varies based on location, size, amenities, seasonality, and management quality. Data reflects the past 12 months.
Top Performing Airbnb Hosts in The Municipal District of Castlecomer (2026)
Learn from the best! This table showcases top-performing Airbnb hosts in The Municipal District of Castlecomer based on the number of properties managed and estimated total revenue over the past year. Analyze their scale and performance metrics.
| Host Name | Properties | Grossing Revenue | Stay Reviews | Avg Rating |
|---|---|---|---|---|
| Derek | 1 | $256,836 | 17 | 5.00/5.0 |
| John | 1 | $205,250 | 379 | 4.98/5.0 |
| Phyllida | 1 | $93,271 | 190 | 4.91/5.0 |
| Ethel | 1 | $87,744 | 60 | 4.98/5.0 |
| Laura | 1 | $67,864 | 81 | 4.89/5.0 |
| Marie | 1 | $46,274 | 144 | 4.87/5.0 |
| Fergal | 1 | $39,934 | 73 | 4.99/5.0 |
| Marilyn | 1 | $39,269 | 158 | 4.98/5.0 |
| Elaine | 1 | $37,964 | 273 | 4.94/5.0 |
| Elizabeth | 1 | $33,998 | 174 | 4.95/5.0 |
Analyzing the strategies of top hosts, such as their property selection, pricing, and guest communication, can offer valuable lessons for optimizing your own Airbnb operations in The Municipal District of Castlecomer.
Dive Deeper: Advanced The Municipal District of Castlecomer STR Market Data (2026)
Ready to unlock more insights? AirROI provides access to advanced metrics and comprehensive Airbnb data for The Municipal District of Castlecomer. Explore detailed analytics beyond this report to refine your investment strategy, optimize pricing, and maximize your vacation rental profits.
Explore Advanced MetricsThe Municipal District of Castlecomer Short-Term Rental Market Composition (2026): Property & Room Types
Room Type Distribution
Property Type Distribution
Market Composition Insights for The Municipal District of Castlecomer
- The The Municipal District of Castlecomer Airbnb market composition is heavily skewed towards Entire Home/Apt listings, which make up 69.8% of the 43 active rentals. This indicates strong guest preference for privacy and space.
- However, a notable 30.2% share for Private Rooms suggests opportunities for budget-conscious travelers or hosts renting out spare rooms.
- Looking at the property type distribution in The Municipal District of Castlecomer, House properties are the most common (55.8%), reflecting the local real estate landscape.
- Houses represent a significant 55.8% portion, catering likely to families or larger groups.
- The presence of 14% Hotel/Boutique listings indicates integration with traditional hospitality.
- Smaller segments like unique stays, others (combined 7.0%) offer potential for unique stay experiences.
The Municipal District of Castlecomer Airbnb Room Capacity Analysis (2026): Bedroom Distribution
Distribution of Listings by Number of Bedrooms
Room Capacity Insights for The Municipal District of Castlecomer
- The dominant room capacity in The Municipal District of Castlecomer is 2 bedrooms listings, making up 25.6% of the market. This suggests a strong demand for properties suitable for couples or solo travelers.
- Together, 2 bedrooms and 1 bedroom properties represent 46.5% of the active Airbnb listings in The Municipal District of Castlecomer, indicating a high concentration in these sizes.
- A significant 41.9% of listings offer 3+ bedrooms, catering to larger groups and families seeking more space in The Municipal District of Castlecomer.
The Municipal District of Castlecomer Vacation Rental Guest Capacity Trends (2026)
Distribution of Listings by Guest Capacity
Guest Capacity Insights for The Municipal District of Castlecomer
- The most common guest capacity trend in The Municipal District of Castlecomer vacation rentals is listings accommodating 8+ guests (23.3%). This suggests the primary traveler segment is likely larger groups.
- Properties designed for 8+ guests and 4 guests dominate the The Municipal District of Castlecomer STR market, accounting for 41.9% of listings.
- 34.9% of properties accommodate 6+ guests, serving the market segment for larger families or group travel in The Municipal District of Castlecomer.
- On average, properties in The Municipal District of Castlecomer are equipped to host 4.1 guests.
The Municipal District of Castlecomer Airbnb Booking Patterns (2026): Available vs. Booked Days
Available Days Distribution
Booked Days Distribution
Booking Pattern Insights for The Municipal District of Castlecomer
- The most common availability pattern in The Municipal District of Castlecomer falls within the 181-270 days range, representing 46.5% of listings. This suggests many properties have significant open periods on their calendars.
- Approximately 74.4% of listings show high availability (181+ days open annually), indicating potential for increased bookings or specific owner usage patterns.
- For booked days, the 91-180 days range is most frequent in The Municipal District of Castlecomer (44.2%), reflecting common guest stay durations or potential owner blocking patterns.
- A notable 27.9% of properties secure long booking periods (181+ days booked per year), highlighting successful long-term rental strategies or significant owner usage.
The Municipal District of Castlecomer Airbnb Minimum Stay Requirements Analysis
Distribution of Listings by Minimum Night Requirement
1 Night
15 listings
34.9% of total
2 Nights
12 listings
27.9% of total
4-6 Nights
1 listings
2.3% of total
7-29 Nights
1 listings
2.3% of total
30+ Nights
14 listings
32.6% of total
Key Insights
- The most prevalent minimum stay requirement in The Municipal District of Castlecomer is 1 Night, adopted by 34.9% of listings. This highlights the market's preference for shorter, flexible bookings.
- A strong majority (62.8%) of the The Municipal District of Castlecomer Airbnb data shows acceptance of very short stays (1-2 nights), indicating a dynamic, high-turnover market.
- A significant segment (32.6%) caters to monthly stays (30+ nights) in The Municipal District of Castlecomer, pointing to opportunities in the extended-stay market.
Recommendations
- Align with the market by considering a 1 Night minimum stay, as 34.9% of The Municipal District of Castlecomer hosts use this setting.
- Explore offering discounts for stays of 30+ nights to attract the 32.6% of the market seeking extended stays.
- Adjust minimum nights based on seasonality – potentially shorter during low season and longer during peak demand periods in The Municipal District of Castlecomer.
The Municipal District of Castlecomer Airbnb Cancellation Policy Trends Analysis (2026)
Flexible
14 listings
32.6% of total
Moderate
17 listings
39.5% of total
Firm
9 listings
20.9% of total
Strict
3 listings
7% of total
Cancellation Policy Insights for The Municipal District of Castlecomer
- The prevailing Airbnb cancellation policy trend in The Municipal District of Castlecomer is Moderate, used by 39.5% of listings.
- The market strongly favors guest-friendly terms, with 72.1% of listings offering Flexible or Moderate policies. This suggests guests in The Municipal District of Castlecomer may expect booking flexibility.
- Strict cancellation policies are quite rare (7%), potentially making listings with this policy less competitive unless justified by high demand or property type.
Recommendations for Hosts
- Consider adopting a Moderate policy to align with the 39.5% market standard in The Municipal District of Castlecomer.
- Using a Strict policy might deter some guests, as only 7% of listings use it. Evaluate if potential revenue protection outweighs possible lower booking rates.
- Regularly review your cancellation policy against competitors and market demand shifts in The Municipal District of Castlecomer.
The Municipal District of Castlecomer STR Booking Lead Time Analysis (2026)
Average Booking Lead Time by Month
Booking Lead Time Insights for The Municipal District of Castlecomer
- The overall average booking lead time for vacation rentals in The Municipal District of Castlecomer is 69 days.
- Guests book furthest in advance for stays during August (average 95 days), likely coinciding with peak travel demand or local events.
- The shortest booking windows occur for stays in February (average 42 days), indicating more last-minute travel plans during this time.
- Seasonally, Summer (79 days avg.) sees the longest lead times, while Winter (53 days avg.) has the shortest, reflecting typical travel planning cycles.
Recommendations for Hosts
- Use the overall average lead time (69 days) as a baseline for your pricing and availability strategy in The Municipal District of Castlecomer.
- For August stays, consider implementing length-of-stay discounts or slightly higher rates for bookings made less than 95 days out to capitalize on advance planning.
- Target marketing efforts for the Summer season well in advance (at least 79 days) to capture early planners.
- Monitor your own booking lead times against these The Municipal District of Castlecomer averages to identify opportunities for dynamic pricing adjustments.
Popular & Essential Airbnb Amenities in The Municipal District of Castlecomer (2026)
Amenity Prevalence
Amenity Insights for The Municipal District of Castlecomer
- Essential amenities in The Municipal District of Castlecomer that guests expect include: Free parking on premises, Smoke alarm. Lacking these (any) could significantly impact bookings.
- Popular amenities like Heating, Wifi, Essentials are common but not universal. Offering these can provide a competitive edge.
- Warning: Wifi is not universally provided but is considered essential globally. Ensure reliable Wifi is offered.
Recommendations for Hosts
- Ensure your listing includes all essential amenities for The Municipal District of Castlecomer: Free parking on premises, Smoke alarm.
- Prioritize adding missing essentials: Smoke alarm.
- Consider adding popular differentiators like Heating or Wifi to increase appeal.
- Highlight unique or less common amenities you offer (e.g., hot tub, dedicated workspace, EV charger) in your listing description and photos.
- Regularly check competitor amenities in The Municipal District of Castlecomer to stay competitive.
The Municipal District of Castlecomer Airbnb Guest Demographics & Profile Analysis (2026)
Guest Profile Summary for The Municipal District of Castlecomer
- The typical guest profile for Airbnb in The Municipal District of Castlecomer consists of predominantly international visitors (72%), with top international origins including Ireland, typically belonging to the Post-2000s (Gen Z/Alpha) group (50%), primarily speaking English or German.
- Domestic travelers account for 28.2% of guests.
- Key international markets include United States (31.3%) and Ireland (28.2%).
- Top languages spoken are English (57%) followed by German (8.7%).
- A significant demographic segment is the Post-2000s (Gen Z/Alpha) group, representing 50% of guests.
Recommendations for Hosts
- Focus marketing internationally, particularly towards travelers from Ireland.
- Tailor amenities and listing descriptions to appeal to the dominant Post-2000s (Gen Z/Alpha) demographic (e.g., highlight fast WiFi, smart home features, local guides).
- Highlight unique local experiences or amenities relevant to the primary guest profile.
- Consider seasonal promotions aligned with peak travel times for key origin markets.
Nearby Short-Term Rental Market Comparison
How does the The Municipal District of Castlecomer Airbnb market stack up against its neighbors? Compare key performance metrics like average monthly revenue, ADR, and occupancy rates in surrounding areas to understand the broader regional STR landscape.
| Market | Active Properties | Monthly Revenue | Daily Rate | Avg. Occupancy |
|---|---|---|---|---|
| Dublin 2 | 15 | $3,771 | $317.51 | 54% |
| The Municipal District of Adare — Rathkeale | 84 | $3,405 | $281.64 | 45% |
| Howth | 38 | $3,401 | $371.91 | 45% |
| Dalkey | 19 | $3,311 | $358.14 | 52% |
| The Municipal District of Kilkenny City | 65 | $3,209 | $260.55 | 54% |
| The Municipal District of Ratoath | 36 | $3,171 | $234.93 | 47% |
| Municipal District of Carrigaline | 74 | $3,118 | $287.39 | 50% |
| Sutton | 10 | $3,087 | $247.21 | 58% |
| Killiney | 13 | $3,077 | $378.20 | 40% |
| Dublin | 2,681 | $3,069 | $244.80 | 53% |