Angri Airbnb Market Analysis 2026: Short Term Rental Data & Vacation Rental Statistics in Campania, Italy
Is Airbnb profitable in Angri in 2026? Explore comprehensive Airbnb analytics for Angri, Campania, Italy to uncover income potential. This 2026 STR market report for Angri, based on AirROI data from February 2025 to January 2026, reveals key trends in the niche market of 25 active listings.
Whether you're considering an Airbnb investment in Angri, optimizing your existing vacation rental, or exploring rental arbitrage opportunities, understanding the Angri Airbnb data is crucial. Navigating the high regulation landscape is key to maximizing your short term rental income potential. Let's dive into the specifics.
Key Angri Airbnb Performance Metrics Overview
Monthly Airbnb Revenue Variations & Income Potential in Angri (2026)
Understanding the monthly revenue variations for Airbnb listings in Angri is key to maximizing your short term rental income potential. Seasonality significantly impacts earnings. Our analysis, based on data from the past 12 months, shows that the peak revenue month for STRs in Angri is typically August, while February often presents the lowest earnings, highlighting opportunities for strategic pricing adjustments during shoulder and low seasons. Explore the typical Airbnb income in Angri across different performance tiers:
- Best-in-class properties (Top 10%) achieve $3,152+ monthly, often utilizing dynamic pricing and superior guest experiences.
- Strong performing properties (Top 25%) earn $1,628 or more, indicating effective management and desirable locations/amenities.
- Typical properties (Median) generate around $868 per month, representing the average market performance.
- Entry-level properties (Bottom 25%) see earnings around $440, often with potential for optimization.
Average Monthly Airbnb Earnings Trend in Angri
Angri Airbnb Occupancy Rate Trends (2026)
Maximize your bookings by understanding the Angri STR occupancy trends. Seasonal demand shifts significantly influence how often properties are booked. Typically, Augustsees the highest demand (peak season occupancy), while January experiences the lowest (low season). Effective strategies, like adjusting minimum stays or offering promotions, can boost occupancy during slower periods. Here's how different property tiers perform in Angri:
- Best-in-class properties (Top 10%) achieve 70%+ occupancy, indicating high desirability and potentially optimized availability.
- Strong performing properties (Top 25%) maintain 54% or higher occupancy, suggesting good market fit and guest satisfaction.
- Typical properties (Median) have an occupancy rate around 34%.
- Entry-level properties (Bottom 25%) average 19% occupancy, potentially facing higher vacancy.
Average Monthly Occupancy Rate Trend in Angri
Average Daily Rate (ADR) Airbnb Trends in Angri (2026)
Effective short term rental pricing strategy in Angri involves understanding monthly ADR fluctuations. The Average Daily Rate (ADR) for Airbnb in Angri typically peaks in July and dips lowest during February. Leveraging Airbnb dynamic pricing tools or strategies based on this seasonality can significantly boost revenue. Here's a look at the typical nightly rates achieved:
- Best-in-class properties (Top 10%) command rates of $161+ per night, often due to premium features or locations.
- Strong performing properties (Top 25%) achieve nightly rates of $104 or more.
- Typical properties (Median) charge around $83 per night.
- Entry-level properties (Bottom 25%) earn around $71 per night.
Average Daily Rate (ADR) Trend by Month in Angri
Get Live Angri Market Intelligence 👇
Explore Real-time Analytics
Airbnb Seasonality Analysis & Trends in Angri (2026)
Peak Season (August, September, July)
- Revenue averages $1,974 per month
- Occupancy rates average 50.6%
- Daily rates average $108
Shoulder Season
- Revenue averages $1,241 per month
- Occupancy maintains around 36.3%
- Daily rates hold near $99
Low Season (January, February, November)
- Revenue drops to average $778 per month
- Occupancy decreases to average 25.7%
- Daily rates adjust to average $95
Seasonality Insights for Angri
- The Airbnb seasonality in Angri shows highly seasonal trends requiring careful strategy. While the sections above show seasonal averages, it's also insightful to look at the extremes:
- During the high season, the absolute peak month showcases Angri's highest earning potential, with monthly revenues capable of climbing to $2,180, occupancy reaching a high of 55.6%, and ADRs peaking at $111.
- Conversely, the slowest single month of the year, typically falling within the low season, marks the market's lowest point. In this month, revenue might dip to $644, occupancy could drop to 21.7%, and ADRs may adjust down to $92.
- Understanding both the seasonal averages and these monthly peaks and troughs in revenue, occupancy, and ADR is crucial for maximizing your Airbnb profit potential in Angri.
Seasonal Strategies for Maximizing Profit
- Peak Season: Maximize revenue through premium pricing and potentially longer minimum stays. Ensure high availability.
- Low Season: Offer competitive pricing, special promotions (e.g., extended stay discounts), and flexible cancellation policies. Target off-season travelers like remote workers or budget-conscious guests.
- Shoulder Seasons: Implement dynamic pricing that balances peak and low rates. Target weekend travelers or specific events. Offer slightly more flexible terms than peak season.
- Regularly analyze your own performance against these Angri seasonality benchmarks and adjust your pricing and availability strategy accordingly.
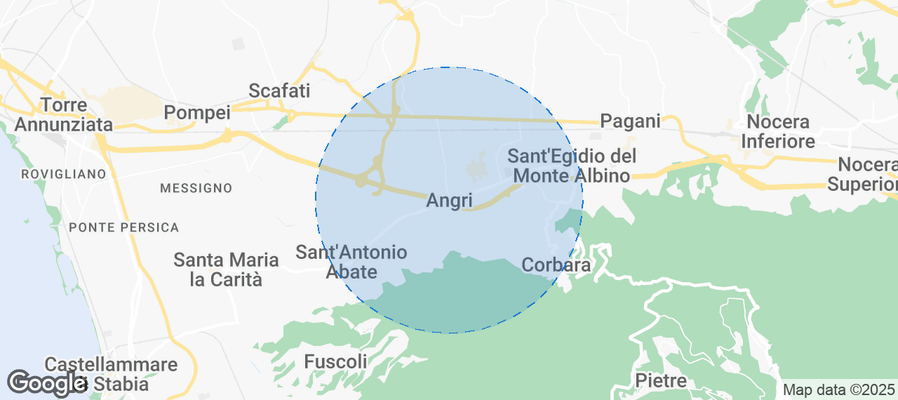
Best Areas for Airbnb Investment in Angri (2026)
Exploring the top neighborhoods for short-term rentals in Angri? This section highlights key areas, outlining why they are attractive for hosts and guests, along with notable local attractions. Consider these locations based on your target guest profile and investment strategy.
| Neighborhood / Area | Why Host Here? (Target Guests & Appeal) | Key Attractions & Landmarks |
|---|---|---|
| Centro Storico | The historic center of Angri, rich in history and culture, attracting tourists interested in exploring local heritage and cuisine. | Angri Cathedral, Palazzo Pignatelli, Corso Italia, Piazza Annunziata |
| Parco Nazionale del Vesuvio | A short drive from Angri, this national park is a great draw for nature lovers and hikers, with stunning views of Mount Vesuvius and the surrounding landscape. | Mount Vesuvius, Vesuvius National Park, Hiking trails, Wine tasting at local vineyards |
| Ponte di Ferro | This area features scenic views and is popular for outdoor activities, attracting tourists looking for a relaxing getaway amid nature. | Outdoor walking paths, Cafes by the river, Fishing spots |
| Villa Comunale | A beautiful park in Angri, popular for family picnics and community events, drawing visitors looking for a local experience. | Children's playground, Walking paths, Picnic areas |
| Rione Ferrovia | A lively neighborhood close to the train station, providing easy access to public transport, appealing to travelers who want to explore the Campania region easily. | Train station access, Local cafes and shops, Vibrant street life |
| Castello di Angri | A historical site that appeals to tourists interested in architecture and history, providing a unique cultural experience. | Castello di Angri, Historical exhibits, Guided tours |
| Via Vittorio Emanuele | A central street known for dining and shopping, attracting both tourists and locals looking for a vibrant urban atmosphere. | Restaurants, Shops, Local markets |
| Monte Comune | A nearby mountain area offering nature activities and beautiful views, ideal for tourists seeking outdoor adventures. | Hiking, Scenic overlooks, Picnic spots |
Understanding Airbnb License Requirements & STR Laws in Angri (2026)
Yes, Angri, Campania, Italy enforces high STR regulations. Obtaining a license and ensuring compliance is almost certainly required according to current 2026 STR laws. Always verify the latest short term rental regulations and Airbnb license requirements directly with local government authorities for Angri to ensure full compliance before hosting.
(Source: AirROI data, 2026, based on 96% licensed listings)
Top Performing Airbnb Properties in Angri (2026)
Benchmark your potential! Explore examples of top-performing Airbnb properties in Angribased on Trailing Twelve Month (TTM) revenue. Analyze their characteristics, revenue, occupancy rate, and ADR to understand what drives success in this market.
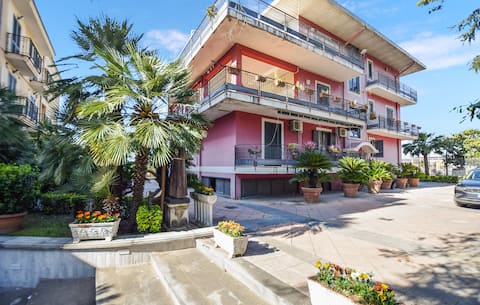
Nice apartment in Angri with WiFi
Entire Place • 3 bedrooms
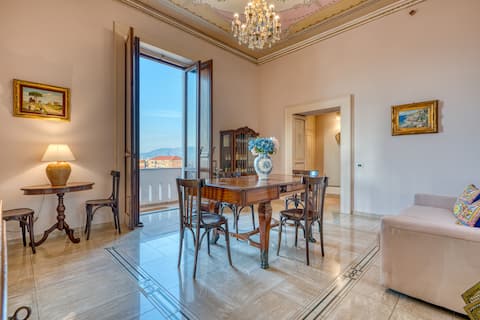
Villa Desiderio Baronessa Apt with Vesuvio View
Entire Place • 3 bedrooms

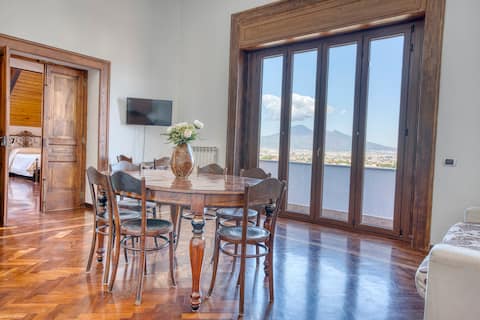
Villa Angela Holiday Apartment
Entire Place • 2 bedrooms
Villa Desiderio · Elysia Penthouse Vesuvius View
Entire Place • 4 bedrooms
Two bedroom apartment with private parking
Entire Place • 2 bedrooms

Villa Desiderio Lumina Suites near Pompeii
Entire Place • 2 bedrooms
Note: Performance varies based on location, size, amenities, seasonality, and management quality. Data reflects the past 12 months.
Top Performing Airbnb Hosts in Angri (2026)
Learn from the best! This table showcases top-performing Airbnb hosts in Angri based on the number of properties managed and estimated total revenue over the past year. Analyze their scale and performance metrics.
| Host Name | Properties | Grossing Revenue | Stay Reviews | Avg Rating |
|---|---|---|---|---|
| Ciro | 4 | $92,683 | 279 | 4.93/5.0 |
| Novasol | 1 | $50,857 | 21 | 4.57/5.0 |
| Novasol | 1 | $33,077 | 5 | 5.00/5.0 |
| Gaetano | 2 | $22,788 | 46 | 4.79/5.0 |
| Mario | 1 | $19,360 | 51 | 4.53/5.0 |
| Guido | 1 | $15,847 | 24 | 4.96/5.0 |
| Pietro | 2 | $9,633 | 17 | 4.88/5.0 |
| Vincenzo | 1 | $9,174 | 10 | 4.80/5.0 |
| Nataly | 1 | $7,377 | 14 | 4.86/5.0 |
| Vincenzo | 1 | $7,151 | 16 | 4.75/5.0 |
Analyzing the strategies of top hosts, such as their property selection, pricing, and guest communication, can offer valuable lessons for optimizing your own Airbnb operations in Angri.
Dive Deeper: Advanced Angri STR Market Data (2026)
Ready to unlock more insights? AirROI provides access to advanced metrics and comprehensive Airbnb data for Angri. Explore detailed analytics beyond this report to refine your investment strategy, optimize pricing, and maximize your vacation rental profits.
Explore Advanced MetricsAngri Short-Term Rental Market Composition (2026): Property & Room Types
Room Type Distribution
Property Type Distribution
Market Composition Insights for Angri
- The Angri Airbnb market composition is heavily skewed towards Entire Home/Apt listings, which make up 84% of the 25 active rentals. This indicates strong guest preference for privacy and space.
- Looking at the property type distribution in Angri, Apartment/Condo properties are the most common (64%), reflecting the local real estate landscape.
- Houses represent a significant 24% portion, catering likely to families or larger groups.
- The presence of 8% Hotel/Boutique listings indicates integration with traditional hospitality.
- Smaller segments like others (combined 4.0%) offer potential for unique stay experiences.
Angri Airbnb Room Capacity Analysis (2026): Bedroom Distribution
Distribution of Listings by Number of Bedrooms
Room Capacity Insights for Angri
- The dominant room capacity in Angri is 1 bedroom listings, making up 40% of the market. This suggests a strong demand for properties suitable for couples or solo travelers.
- Together, 1 bedroom and 2 bedrooms properties represent 68.0% of the active Airbnb listings in Angri, indicating a high concentration in these sizes.
- A significant 28.0% of listings offer 3+ bedrooms, catering to larger groups and families seeking more space in Angri.
Angri Vacation Rental Guest Capacity Trends (2026)
Distribution of Listings by Guest Capacity
Guest Capacity Insights for Angri
- The most common guest capacity trend in Angri vacation rentals is listings accommodating 4 guests (28%). This suggests the primary traveler segment is likely small families or groups.
- Properties designed for 4 guests and 8+ guests dominate the Angri STR market, accounting for 48.0% of listings.
- 36.0% of properties accommodate 6+ guests, serving the market segment for larger families or group travel in Angri.
- On average, properties in Angri are equipped to host 4.6 guests.
Angri Airbnb Booking Patterns (2026): Available vs. Booked Days
Available Days Distribution
Booked Days Distribution
Booking Pattern Insights for Angri
- The most common availability pattern in Angri falls within the 181-270 days range, representing 48% of listings. This suggests many properties have significant open periods on their calendars.
- Approximately 88.0% of listings show high availability (181+ days open annually), indicating potential for increased bookings or specific owner usage patterns.
- For booked days, the 91-180 days range is most frequent in Angri (48%), reflecting common guest stay durations or potential owner blocking patterns.
- A notable 12.0% of properties secure long booking periods (181+ days booked per year), highlighting successful long-term rental strategies or significant owner usage.
Angri Airbnb Minimum Stay Requirements Analysis
Distribution of Listings by Minimum Night Requirement
1 Night
12 listings
48% of total
2 Nights
7 listings
28% of total
30+ Nights
6 listings
24% of total
Key Insights
- The most prevalent minimum stay requirement in Angri is 1 Night, adopted by 48% of listings. This highlights the market's preference for shorter, flexible bookings.
- A strong majority (76.0%) of the Angri Airbnb data shows acceptance of very short stays (1-2 nights), indicating a dynamic, high-turnover market.
- A significant segment (24%) caters to monthly stays (30+ nights) in Angri, pointing to opportunities in the extended-stay market.
Recommendations
- Align with the market by considering a 1 Night minimum stay, as 48% of Angri hosts use this setting.
- Explore offering discounts for stays of 30+ nights to attract the 24% of the market seeking extended stays.
- Adjust minimum nights based on seasonality – potentially shorter during low season and longer during peak demand periods in Angri.
Angri Airbnb Cancellation Policy Trends Analysis (2026)
Limited
1 listings
4% of total
Super Strict 60 Days
2 listings
8% of total
Flexible
14 listings
56% of total
Moderate
6 listings
24% of total
Firm
2 listings
8% of total
Cancellation Policy Insights for Angri
- The prevailing Airbnb cancellation policy trend in Angri is Flexible, used by 56% of listings.
- The market strongly favors guest-friendly terms, with 80.0% of listings offering Flexible or Moderate policies. This suggests guests in Angri may expect booking flexibility.
Recommendations for Hosts
- Consider adopting a Flexible policy to align with the 56% market standard in Angri.
- Given the high prevalence of Flexible policies (56%), offering this can enhance booking appeal, especially during shoulder seasons.
- Regularly review your cancellation policy against competitors and market demand shifts in Angri.
Angri STR Booking Lead Time Analysis (2026)
Average Booking Lead Time by Month
Booking Lead Time Insights for Angri
- The overall average booking lead time for vacation rentals in Angri is 39 days.
- Guests book furthest in advance for stays during July (average 56 days), likely coinciding with peak travel demand or local events.
- The shortest booking windows occur for stays in November (average 19 days), indicating more last-minute travel plans during this time.
- Seasonally, Summer (49 days avg.) sees the longest lead times, while Winter (27 days avg.) has the shortest, reflecting typical travel planning cycles.
Recommendations for Hosts
- Use the overall average lead time (39 days) as a baseline for your pricing and availability strategy in Angri.
- For July stays, consider implementing length-of-stay discounts or slightly higher rates for bookings made less than 56 days out to capitalize on advance planning.
- Target marketing efforts for the Summer season well in advance (at least 49 days) to capture early planners.
- Monitor your own booking lead times against these Angri averages to identify opportunities for dynamic pricing adjustments.
Popular & Essential Airbnb Amenities in Angri (2026)
Amenity Prevalence
Amenity Insights for Angri
- Essential amenities in Angri that guests expect include: Air conditioning, TV. Lacking these (any) could significantly impact bookings.
- Popular amenities like Heating, Free parking on premises, Wifi are common but not universal. Offering these can provide a competitive edge.
- Warning: Wifi is not universally provided but is considered essential globally. Ensure reliable Wifi is offered.
Recommendations for Hosts
- Ensure your listing includes all essential amenities for Angri: Air conditioning, TV.
- Consider adding popular differentiators like Heating or Free parking on premises to increase appeal.
- Highlight unique or less common amenities you offer (e.g., hot tub, dedicated workspace, EV charger) in your listing description and photos.
- Regularly check competitor amenities in Angri to stay competitive.
Angri Airbnb Guest Demographics & Profile Analysis (2026)
Guest Profile Summary for Angri
- The typical guest profile for Airbnb in Angri consists of predominantly international visitors (92%), with top international origins including France, typically belonging to the Post-2000s (Gen Z/Alpha) group (50%), primarily speaking English or Spanish.
- Domestic travelers account for 8.3% of guests.
- Key international markets include United States (20%) and France (17.9%).
- Top languages spoken are English (36.5%) followed by Spanish (13.5%).
- A significant demographic segment is the Post-2000s (Gen Z/Alpha) group, representing 50% of guests.
Recommendations for Hosts
- Focus marketing internationally, particularly towards travelers from France.
- Tailor amenities and listing descriptions to appeal to the dominant Post-2000s (Gen Z/Alpha) demographic (e.g., highlight fast WiFi, smart home features, local guides).
- Highlight unique local experiences or amenities relevant to the primary guest profile.
- Consider seasonal promotions aligned with peak travel times for key origin markets.
Nearby Short-Term Rental Market Comparison
How does the Angri Airbnb market stack up against its neighbors? Compare key performance metrics like average monthly revenue, ADR, and occupancy rates in surrounding areas to understand the broader regional STR landscape.
| Market | Active Properties | Monthly Revenue | Daily Rate | Avg. Occupancy |
|---|---|---|---|---|
| Positano | 740 | $6,727 | $653.26 | 52% |
| Praiano | 365 | $4,340 | $447.02 | 50% |
| Capri | 424 | $3,912 | $586.24 | 37% |
| Conca dei Marini | 132 | $3,899 | $417.87 | 45% |
| Sorrento | 1,606 | $3,821 | $344.29 | 48% |
| Massa Lubrense | 813 | $3,392 | $408.38 | 42% |
| Furore | 149 | $3,226 | $353.64 | 52% |
| Amalfi | 506 | $3,135 | $319.20 | 45% |
| Ravello | 256 | $3,119 | $333.17 | 42% |
| Atrani | 130 | $2,702 | $224.39 | 50% |