Atrani Airbnb Market Analysis 2026: Short Term Rental Data & Vacation Rental Statistics in Campania, Italy
Is Airbnb profitable in Atrani in 2026? Explore comprehensive Airbnb analytics for Atrani, Campania, Italy to uncover income potential. This 2026 STR market report for Atrani, based on AirROI data from February 2025 to January 2026, reveals key trends in the niche market of 130 active listings.
Whether you're considering an Airbnb investment in Atrani, optimizing your existing vacation rental, or exploring rental arbitrage opportunities, understanding the Atrani Airbnb data is crucial. Navigating the high regulation landscape is key to maximizing your short term rental income potential. Let's dive into the specifics.
Key Atrani Airbnb Performance Metrics Overview
Monthly Airbnb Revenue Variations & Income Potential in Atrani (2026)
Understanding the monthly revenue variations for Airbnb listings in Atrani is key to maximizing your short term rental income potential. Seasonality significantly impacts earnings. Our analysis, based on data from the past 12 months, shows that the peak revenue month for STRs in Atrani is typically July, while January often presents the lowest earnings, highlighting opportunities for strategic pricing adjustments during shoulder and low seasons. Explore the typical Airbnb income in Atrani across different performance tiers:
- Best-in-class properties (Top 10%) achieve $6,689+ monthly, often utilizing dynamic pricing and superior guest experiences.
- Strong performing properties (Top 25%) earn $4,586 or more, indicating effective management and desirable locations/amenities.
- Typical properties (Median) generate around $3,007 per month, representing the average market performance.
- Entry-level properties (Bottom 25%) see earnings around $1,904, often with potential for optimization.
Average Monthly Airbnb Earnings Trend in Atrani
Atrani Airbnb Occupancy Rate Trends (2026)
Maximize your bookings by understanding the Atrani STR occupancy trends. Seasonal demand shifts significantly influence how often properties are booked. Typically, Junesees the highest demand (peak season occupancy), while January experiences the lowest (low season). Effective strategies, like adjusting minimum stays or offering promotions, can boost occupancy during slower periods. Here's how different property tiers perform in Atrani:
- Best-in-class properties (Top 10%) achieve 77%+ occupancy, indicating high desirability and potentially optimized availability.
- Strong performing properties (Top 25%) maintain 65% or higher occupancy, suggesting good market fit and guest satisfaction.
- Typical properties (Median) have an occupancy rate around 47%.
- Entry-level properties (Bottom 25%) average 30% occupancy, potentially facing higher vacancy.
Average Monthly Occupancy Rate Trend in Atrani
Average Daily Rate (ADR) Airbnb Trends in Atrani (2026)
Effective short term rental pricing strategy in Atrani involves understanding monthly ADR fluctuations. The Average Daily Rate (ADR) for Airbnb in Atrani typically peaks in August and dips lowest during November. Leveraging Airbnb dynamic pricing tools or strategies based on this seasonality can significantly boost revenue. Here's a look at the typical nightly rates achieved:
- Best-in-class properties (Top 10%) command rates of $367+ per night, often due to premium features or locations.
- Strong performing properties (Top 25%) achieve nightly rates of $254 or more.
- Typical properties (Median) charge around $189 per night.
- Entry-level properties (Bottom 25%) earn around $153 per night.
Average Daily Rate (ADR) Trend by Month in Atrani
Get Live Atrani Market Intelligence 👇

Explore Real-time Analytics
Airbnb Seasonality Analysis & Trends in Atrani (2026)
Peak Season (July, August, June)
- Revenue averages $5,734 per month
- Occupancy rates average 66.8%
- Daily rates average $271
Shoulder Season
- Revenue averages $3,599 per month
- Occupancy maintains around 50.0%
- Daily rates hold near $221
Low Season (January, February, December)
- Revenue drops to average $1,272 per month
- Occupancy decreases to average 21.7%
- Daily rates adjust to average $199
Seasonality Insights for Atrani
- The Airbnb seasonality in Atrani shows highly seasonal trends requiring careful strategy. While the sections above show seasonal averages, it's also insightful to look at the extremes:
- During the high season, the absolute peak month showcases Atrani's highest earning potential, with monthly revenues capable of climbing to $5,912, occupancy reaching a high of 70.7%, and ADRs peaking at $277.
- Conversely, the slowest single month of the year, typically falling within the low season, marks the market's lowest point. In this month, revenue might dip to $833, occupancy could drop to 16.5%, and ADRs may adjust down to $191.
- Understanding both the seasonal averages and these monthly peaks and troughs in revenue, occupancy, and ADR is crucial for maximizing your Airbnb profit potential in Atrani.
Seasonal Strategies for Maximizing Profit
- Peak Season: Maximize revenue through premium pricing and potentially longer minimum stays. Ensure high availability.
- Low Season: Offer competitive pricing, special promotions (e.g., extended stay discounts), and flexible cancellation policies. Target off-season travelers like remote workers or budget-conscious guests.
- Shoulder Seasons: Implement dynamic pricing that balances peak and low rates. Target weekend travelers or specific events. Offer slightly more flexible terms than peak season.
- Regularly analyze your own performance against these Atrani seasonality benchmarks and adjust your pricing and availability strategy accordingly.
Best Areas for Airbnb Investment in Atrani (2026)
Exploring the top neighborhoods for short-term rentals in Atrani? This section highlights key areas, outlining why they are attractive for hosts and guests, along with notable local attractions. Consider these locations based on your target guest profile and investment strategy.
| Neighborhood / Area | Why Host Here? (Target Guests & Appeal) | Key Attractions & Landmarks |
|---|---|---|
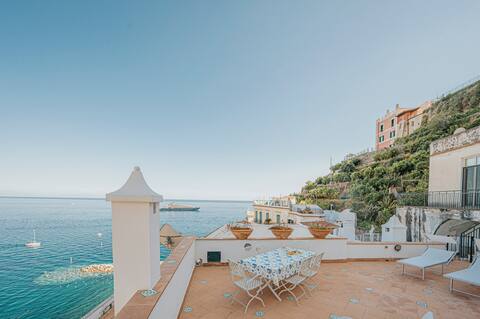
| Atrani Centro | The historic center of Atrani, characterized by charming narrow streets, local shops, and stunning coastal views. Attracts tourists seeking an authentic Italian experience in a picturesque setting. | Church of San Salvatore de' Birecto, Atrani Beach, Piazza Umberto I, Marina di Atrani, Villa Roma |
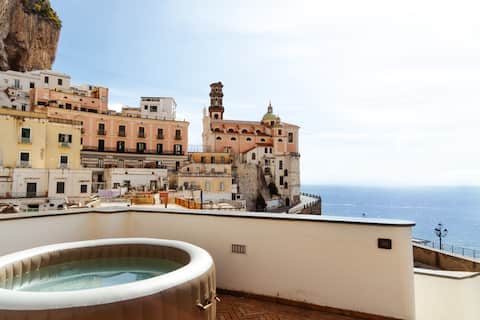
| Villa Paradiso | A beautiful villa area offering breathtaking views of the Amalfi Coast. A tranquil retreat with luxurious accommodations, perfect for high-end tourists and honeymooners. | Scenic viewpoints, Hiking trails, Private beach access, Nature walks, Oceanfront dining |
| Beachfront Promenade | The promenade along Atrani’s waterfront is a prime spot for visitors looking to enjoy the beach and local amenities. It’s lively and filled with cafes and small shops. | Lido di Atrani, Beach cafes, Sunset views, Local markets, Water sports |
| Historical Trails | Known for its scenic hiking trails that connect Atrani to nearby Amalfi and Ravello, this area is popular with adventure seekers and nature lovers. | Sentiero dei Limoni hiking trail, Views of coastline, Botanical gardens, Ancient ruins, Cultural heritage sites |
| Amalfi Coast Roads | The roads around Atrani offer stunning drives and views, making them great for guests looking to explore the famous Amalfi Coast by car or scooter. | Scenic viewpoints, Local vineyards, Restaurants with coast views, Historical landmarks, Easy access to neighboring towns |
| Local Art Scene | Atrani has a burgeoning art scene with several galleries and local artisans. This attracts tourists looking to immerse themselves in the local culture and art. | Art galleries, Craft markets, Local workshops, Cultural events, Art festivals |
| Nightlife Spots | Atrani has a selection of bars and small clubs, providing a quaint yet vibrant nightlife experience, appealing to younger crowds. | Local bars, Outdoor music events, Wine tasting, Beach parties, Local cuisine dining |
| Culinary Experiences | Famous for its traditional Italian cuisine, Atrani attracts food lovers who come for cooking classes and local dining experiences. | Cooking classes, Local restaurants, Fish and seafood markets, Gastronomy tours, Wine tasting events |
Understanding Airbnb License Requirements & STR Laws in Atrani (2026)
Yes, Atrani, Campania, Italy enforces high STR regulations. Obtaining a license and ensuring compliance is almost certainly required according to current 2026 STR laws. Always verify the latest short term rental regulations and Airbnb license requirements directly with local government authorities for Atrani to ensure full compliance before hosting.
(Source: AirROI data, 2026, based on 93% licensed listings)
Top Performing Airbnb Properties in Atrani (2026)
Benchmark your potential! Explore examples of top-performing Airbnb properties in Atranibased on Trailing Twelve Month (TTM) revenue. Analyze their characteristics, revenue, occupancy rate, and ADR to understand what drives success in this market.

Paradise Terrace
Entire Place • 3 bedrooms

House La Torricella - Sea view on the Amalfi Coast
Entire Place • 2 bedrooms

SEAFRONT VILLA: STEPS TO BEACH!
Entire Place • 3 bedrooms
Casa Blue Torricella by Elite Villas
Entire Place • 3 bedrooms
Lauritano House
Entire Place • 2 bedrooms
Infinito Luxury Residence, Atrani (Amalfi Coast)
Entire Place • 1 bedroom
Note: Performance varies based on location, size, amenities, seasonality, and management quality. Data reflects the past 12 months.
Top Performing Airbnb Hosts in Atrani (2026)
Learn from the best! This table showcases top-performing Airbnb hosts in Atrani based on the number of properties managed and estimated total revenue over the past year. Analyze their scale and performance metrics.
| Host Name | Properties | Grossing Revenue | Stay Reviews | Avg Rating |
|---|---|---|---|---|
| Cris House | 6 | $185,293 | 2040 | 4.83/5.0 |
| Franco & Co. | 3 | $171,832 | 171 | 4.84/5.0 |
| Tyler | 2 | $171,291 | 236 | 4.95/5.0 |
| Gerardo | 4 | $161,138 | 1069 | 4.71/5.0 |
| G.F.G. Di Franco | 4 | $146,700 | 326 | 4.74/5.0 |
| Rossella | 3 | $137,708 | 223 | 4.81/5.0 |
| Alfonso | 1 | $132,478 | 24 | 5.00/5.0 |
| Oliviero | 1 | $113,162 | 42 | 4.98/5.0 |
| Chiara | 1 | $109,550 | 200 | 4.76/5.0 |
| La Piccola Atrani | 3 | $108,448 | 141 | 4.90/5.0 |
Analyzing the strategies of top hosts, such as their property selection, pricing, and guest communication, can offer valuable lessons for optimizing your own Airbnb operations in Atrani.
Dive Deeper: Advanced Atrani STR Market Data (2026)
Ready to unlock more insights? AirROI provides access to advanced metrics and comprehensive Airbnb data for Atrani. Explore detailed analytics beyond this report to refine your investment strategy, optimize pricing, and maximize your vacation rental profits.
Explore Advanced MetricsAtrani Short-Term Rental Market Composition (2026): Property & Room Types
Room Type Distribution
Property Type Distribution
Market Composition Insights for Atrani
- The Atrani Airbnb market composition is heavily skewed towards Entire Home/Apt listings, which make up 93.8% of the 130 active rentals. This indicates strong guest preference for privacy and space.
- Looking at the property type distribution in Atrani, Apartment/Condo properties are the most common (68.5%), reflecting the local real estate landscape.
- Houses represent a significant 29.2% portion, catering likely to families or larger groups.
- Smaller segments like others, hotel/boutique, unique stays (combined 2.4%) offer potential for unique stay experiences.
Atrani Airbnb Room Capacity Analysis (2026): Bedroom Distribution
Distribution of Listings by Number of Bedrooms
Room Capacity Insights for Atrani
- The dominant room capacity in Atrani is 1 bedroom listings, making up 46.9% of the market. This suggests a strong demand for properties suitable for couples or solo travelers.
- Together, 1 bedroom and 2 bedrooms properties represent 83.8% of the active Airbnb listings in Atrani, indicating a high concentration in these sizes.
- Listings with 3+ bedrooms (8.4%) represent a smaller niche, potentially indicating an underserved market for larger group accommodations in Atrani.
Atrani Vacation Rental Guest Capacity Trends (2026)
Distribution of Listings by Guest Capacity
Guest Capacity Insights for Atrani
- The most common guest capacity trend in Atrani vacation rentals is listings accommodating 4 guests (34.6%). This suggests the primary traveler segment is likely small families or groups.
- Properties designed for 4 guests and 2 guests dominate the Atrani STR market, accounting for 59.2% of listings.
- 17.7% of properties accommodate 6+ guests, serving the market segment for larger families or group travel in Atrani.
- On average, properties in Atrani are equipped to host 3.8 guests.
Atrani Airbnb Booking Patterns (2026): Available vs. Booked Days
Available Days Distribution
Booked Days Distribution
Booking Pattern Insights for Atrani
- The most common availability pattern in Atrani falls within the 181-270 days range, representing 40.8% of listings. This suggests many properties have significant open periods on their calendars.
- Approximately 73.9% of listings show high availability (181+ days open annually), indicating potential for increased bookings or specific owner usage patterns.
- For booked days, the 91-180 days range is most frequent in Atrani (40.8%), reflecting common guest stay durations or potential owner blocking patterns.
- A notable 27.0% of properties secure long booking periods (181+ days booked per year), highlighting successful long-term rental strategies or significant owner usage.
Atrani Airbnb Minimum Stay Requirements Analysis
Distribution of Listings by Minimum Night Requirement
2 Nights
22 listings
16.9% of total
3 Nights
24 listings
18.5% of total
4-6 Nights
7 listings
5.4% of total
7-29 Nights
4 listings
3.1% of total
30+ Nights
73 listings
56.2% of total
Key Insights
- The most prevalent minimum stay requirement in Atrani is 30+ Nights, adopted by 56.2% of listings. This highlights the market's preference for longer commitments.
- Very short stays (1-2 nights) are less common (16.9%), suggesting hosts prefer slightly longer bookings to optimize turnover.
- A significant segment (56.2%) caters to monthly stays (30+ nights) in Atrani, pointing to opportunities in the extended-stay market.
Recommendations
- Align with the market by considering a 30+ Nights minimum stay, as 56.2% of Atrani hosts use this setting.
- Explore offering discounts for stays of 30+ nights to attract the 56.2% of the market seeking extended stays.
- Adjust minimum nights based on seasonality – potentially shorter during low season and longer during peak demand periods in Atrani.
Atrani Airbnb Cancellation Policy Trends Analysis (2026)
Super Strict 30 Days
6 listings
4.6% of total
Limited
1 listings
0.8% of total
Super Strict 60 Days
2 listings
1.5% of total
Flexible
18 listings
13.8% of total
Moderate
45 listings
34.6% of total
Firm
53 listings
40.8% of total
Strict
5 listings
3.8% of total
Cancellation Policy Insights for Atrani
- The prevailing Airbnb cancellation policy trend in Atrani is Firm, used by 40.8% of listings.
- There's a relatively balanced mix between guest-friendly (48.4%) and stricter (44.6%) policies, offering choices for different guest needs.
- Strict cancellation policies are quite rare (3.8%), potentially making listings with this policy less competitive unless justified by high demand or property type.
Recommendations for Hosts
- Consider adopting a Firm policy to align with the 40.8% market standard in Atrani.
- Using a Strict policy might deter some guests, as only 3.8% of listings use it. Evaluate if potential revenue protection outweighs possible lower booking rates.
- Regularly review your cancellation policy against competitors and market demand shifts in Atrani.
Atrani STR Booking Lead Time Analysis (2026)
Average Booking Lead Time by Month
Booking Lead Time Insights for Atrani
- The overall average booking lead time for vacation rentals in Atrani is 81 days.
- Guests book furthest in advance for stays during September (average 105 days), likely coinciding with peak travel demand or local events.
- The shortest booking windows occur for stays in January (average 46 days), indicating more last-minute travel plans during this time.
- Seasonally, Summer (94 days avg.) sees the longest lead times, while Winter (67 days avg.) has the shortest, reflecting typical travel planning cycles.
Recommendations for Hosts
- Use the overall average lead time (81 days) as a baseline for your pricing and availability strategy in Atrani.
- For September stays, consider implementing length-of-stay discounts or slightly higher rates for bookings made less than 105 days out to capitalize on advance planning.
- Target marketing efforts for the Summer season well in advance (at least 94 days) to capture early planners.
- Monitor your own booking lead times against these Atrani averages to identify opportunities for dynamic pricing adjustments.
Popular & Essential Airbnb Amenities in Atrani (2026)
Amenity Prevalence
Amenity Insights for Atrani
- Essential amenities in Atrani that guests expect include: Wifi. Lacking these (this) could significantly impact bookings.
- Popular amenities like Kitchen, Hair dryer, Essentials are common but not universal. Offering these can provide a competitive edge.
Recommendations for Hosts
- Ensure your listing includes all essential amenities for Atrani: Wifi.
- Prioritize adding missing essentials: Wifi.
- Consider adding popular differentiators like Kitchen or Hair dryer to increase appeal.
- Highlight unique or less common amenities you offer (e.g., hot tub, dedicated workspace, EV charger) in your listing description and photos.
- Regularly check competitor amenities in Atrani to stay competitive.
Atrani Airbnb Guest Demographics & Profile Analysis (2026)
Guest Profile Summary for Atrani
- The typical guest profile for Airbnb in Atrani consists of predominantly international visitors (99%), with top international origins including Canada, typically belonging to the Post-2000s (Gen Z/Alpha) group (50%), primarily speaking English or Spanish.
- Domestic travelers account for 0.8% of guests.
- Key international markets include United States (46.7%) and Canada (12.3%).
- Top languages spoken are English (56.4%) followed by Spanish (12%).
- A significant demographic segment is the Post-2000s (Gen Z/Alpha) group, representing 50% of guests.
Recommendations for Hosts
- Focus marketing internationally, particularly towards travelers from Canada.
- Tailor amenities and listing descriptions to appeal to the dominant Post-2000s (Gen Z/Alpha) demographic (e.g., highlight fast WiFi, smart home features, local guides).
- Highlight unique local experiences or amenities relevant to the primary guest profile.
- Consider seasonal promotions aligned with peak travel times for key origin markets.
Nearby Short-Term Rental Market Comparison
How does the Atrani Airbnb market stack up against its neighbors? Compare key performance metrics like average monthly revenue, ADR, and occupancy rates in surrounding areas to understand the broader regional STR landscape.
| Market | Active Properties | Monthly Revenue | Daily Rate | Avg. Occupancy |
|---|---|---|---|---|
| Positano | 740 | $6,727 | $653.26 | 52% |
| Praiano | 365 | $4,340 | $447.02 | 50% |
| Capri | 424 | $3,912 | $586.24 | 37% |
| Conca dei Marini | 132 | $3,899 | $417.87 | 45% |
| Sorrento | 1,606 | $3,821 | $344.29 | 48% |
| Massa Lubrense | 813 | $3,392 | $408.38 | 42% |
| Furore | 149 | $3,226 | $353.64 | 52% |
| Amalfi | 506 | $3,135 | $319.20 | 45% |
| Ravello | 256 | $3,119 | $333.17 | 42% |
| Torchiara | 18 | $2,501 | $338.25 | 27% |