Eboli Airbnb Market Analysis 2026: Short Term Rental Data & Vacation Rental Statistics in Campania, Italy
Is Airbnb profitable in Eboli in 2026? Explore comprehensive Airbnb analytics for Eboli, Campania, Italy to uncover income potential. This 2026 STR market report for Eboli, based on AirROI data from February 2025 to January 2026, reveals key trends in the niche market of 23 active listings.
Whether you're considering an Airbnb investment in Eboli, optimizing your existing vacation rental, or exploring rental arbitrage opportunities, understanding the Eboli Airbnb data is crucial. Navigating the high regulation landscape is key to maximizing your short term rental income potential. Let's dive into the specifics.
Key Eboli Airbnb Performance Metrics Overview
Monthly Airbnb Revenue Variations & Income Potential in Eboli (2026)
Understanding the monthly revenue variations for Airbnb listings in Eboli is key to maximizing your short term rental income potential. Seasonality significantly impacts earnings. Our analysis, based on data from the past 12 months, shows that the peak revenue month for STRs in Eboli is typically August, while March often presents the lowest earnings, highlighting opportunities for strategic pricing adjustments during shoulder and low seasons. Explore the typical Airbnb income in Eboli across different performance tiers:
- Best-in-class properties (Top 10%) achieve $2,518+ monthly, often utilizing dynamic pricing and superior guest experiences.
- Strong performing properties (Top 25%) earn $1,368 or more, indicating effective management and desirable locations/amenities.
- Typical properties (Median) generate around $632 per month, representing the average market performance.
- Entry-level properties (Bottom 25%) see earnings around $384, often with potential for optimization.
Average Monthly Airbnb Earnings Trend in Eboli
Eboli Airbnb Occupancy Rate Trends (2026)
Maximize your bookings by understanding the Eboli STR occupancy trends. Seasonal demand shifts significantly influence how often properties are booked. Typically, Augustsees the highest demand (peak season occupancy), while October experiences the lowest (low season). Effective strategies, like adjusting minimum stays or offering promotions, can boost occupancy during slower periods. Here's how different property tiers perform in Eboli:
- Best-in-class properties (Top 10%) achieve 56%+ occupancy, indicating high desirability and potentially optimized availability.
- Strong performing properties (Top 25%) maintain 44% or higher occupancy, suggesting good market fit and guest satisfaction.
- Typical properties (Median) have an occupancy rate around 27%.
- Entry-level properties (Bottom 25%) average 16% occupancy, potentially facing higher vacancy.
Average Monthly Occupancy Rate Trend in Eboli
Average Daily Rate (ADR) Airbnb Trends in Eboli (2026)
Effective short term rental pricing strategy in Eboli involves understanding monthly ADR fluctuations. The Average Daily Rate (ADR) for Airbnb in Eboli typically peaks in September and dips lowest during February. Leveraging Airbnb dynamic pricing tools or strategies based on this seasonality can significantly boost revenue. Here's a look at the typical nightly rates achieved:
- Best-in-class properties (Top 10%) command rates of $169+ per night, often due to premium features or locations.
- Strong performing properties (Top 25%) achieve nightly rates of $113 or more.
- Typical properties (Median) charge around $78 per night.
- Entry-level properties (Bottom 25%) earn around $53 per night.
Average Daily Rate (ADR) Trend by Month in Eboli
Get Live Eboli Market Intelligence 👇

Explore Real-time Analytics
Airbnb Seasonality Analysis & Trends in Eboli (2026)
Peak Season (August, September, July)
- Revenue averages $1,794 per month
- Occupancy rates average 42.1%
- Daily rates average $111
Shoulder Season
- Revenue averages $844 per month
- Occupancy maintains around 29.5%
- Daily rates hold near $92
Low Season (March, May, October)
- Revenue drops to average $551 per month
- Occupancy decreases to average 20.6%
- Daily rates adjust to average $92
Seasonality Insights for Eboli
- The Airbnb seasonality in Eboli shows highly seasonal trends requiring careful strategy. While the sections above show seasonal averages, it's also insightful to look at the extremes:
- During the high season, the absolute peak month showcases Eboli's highest earning potential, with monthly revenues capable of climbing to $2,466, occupancy reaching a high of 56.4%, and ADRs peaking at $116.
- Conversely, the slowest single month of the year, typically falling within the low season, marks the market's lowest point. In this month, revenue might dip to $461, occupancy could drop to 17.6%, and ADRs may adjust down to $80.
- Understanding both the seasonal averages and these monthly peaks and troughs in revenue, occupancy, and ADR is crucial for maximizing your Airbnb profit potential in Eboli.
Seasonal Strategies for Maximizing Profit
- Peak Season: Maximize revenue through premium pricing and potentially longer minimum stays. Ensure high availability.
- Low Season: Offer competitive pricing, special promotions (e.g., extended stay discounts), and flexible cancellation policies. Target off-season travelers like remote workers or budget-conscious guests.
- Shoulder Seasons: Implement dynamic pricing that balances peak and low rates. Target weekend travelers or specific events. Offer slightly more flexible terms than peak season.
- Regularly analyze your own performance against these Eboli seasonality benchmarks and adjust your pricing and availability strategy accordingly.
Best Areas for Airbnb Investment in Eboli (2026)
Exploring the top neighborhoods for short-term rentals in Eboli? This section highlights key areas, outlining why they are attractive for hosts and guests, along with notable local attractions. Consider these locations based on your target guest profile and investment strategy.
| Neighborhood / Area | Why Host Here? (Target Guests & Appeal) | Key Attractions & Landmarks |
|---|---|---|
| Centro Storico (Historic Center) | Charming historic area filled with medieval architecture and local shops. Ideal for travelers interested in history, culture, and local cuisine. | Eboli Castle, San Lorenzo Church, Piazza della Repubblica, Museo di Eboli e della Pergamena, Church of Santa Maria della Visitazione |
| Campagna | A serene rural area that offers a glimpse into traditional Italian life. Perfect for those looking to escape the city and enjoy nature. | Mount Della Maddalena, Vineyards, Olive Grove Tours, Local Farmhouses, Traditional Italian Cuisine |
| Santa Cecilia | A vibrant residential neighborhood with a mix of local culture and modern amenities. Attracts families and local workers. | Local Markets, Parks and Recreation Areas, Community Events, Cafés and Restaurants |
| Salerno Coast | A short drive away, offering stunning coastal views and beautiful beaches. Popular with tourists looking for sun and sea. | Paestum Beach, Tramonti Village, Tyrrhenian Sea Views |
| Montecorvino Rovella | A neighboring town with rich historical significance and beautiful landscapes. Great for those interested in historical tourism and hiking. | Historical Ruins, Natural Trails, Local Cheese Producers |
| Capaccio-Paestum | Famous for its archaeological sites and beautiful beaches. A great location for both history buffs and beach lovers. | Paestum Archaeological Park, Temple of Hera, Paestum Beach |
| Agropoli | A charming coastal town known for its medieval castle and beautiful beaches. Perfect for summer tourism and family vacations. | Agropoli Castle, The Beaches of Cilento, Historic Old Town |
| Battipaglia | A growing town with modern amenities and close proximity to Eboli. Suitable for business travelers and quick getaways. | Local Shopping Centers, Cafés and Pizzerias, Easy Access to Major Roads |
Understanding Airbnb License Requirements & STR Laws in Eboli (2026)
Yes, Eboli, Campania, Italy enforces high STR regulations. Obtaining a license and ensuring compliance is almost certainly required according to current 2026 STR laws. Always verify the latest short term rental regulations and Airbnb license requirements directly with local government authorities for Eboli to ensure full compliance before hosting.
(Source: AirROI data, 2026, based on 78% licensed listings)
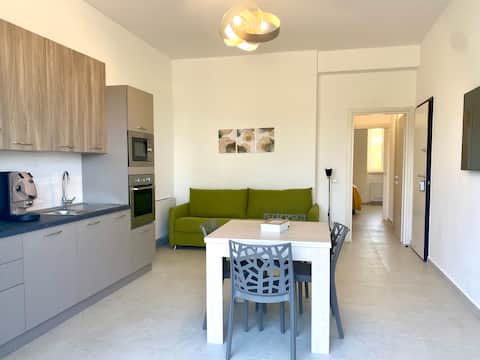
Top Performing Airbnb Properties in Eboli (2026)
Benchmark your potential! Explore examples of top-performing Airbnb properties in Ebolibased on Trailing Twelve Month (TTM) revenue. Analyze their characteristics, revenue, occupancy rate, and ADR to understand what drives success in this market.
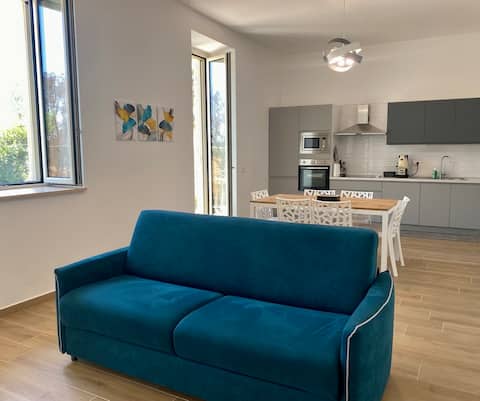
Cilento Contemporary House con Jacuzzi® Bali
Entire Place • 3 bedrooms
Cilento Contemporary House con Jacuzzi® e Terrazzo
Entire Place • 2 bedrooms
Cilento Contemporary House with Jacuzzi® and Garden
Entire Place • 1 bedroom
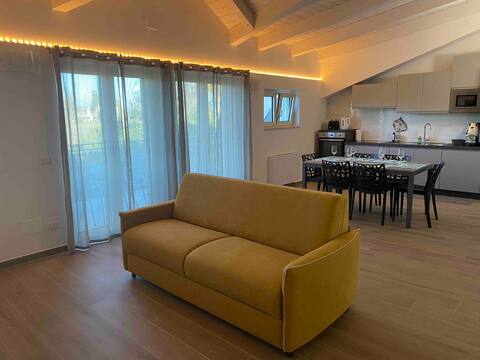
le gatte+
Entire Place • 3 bedrooms
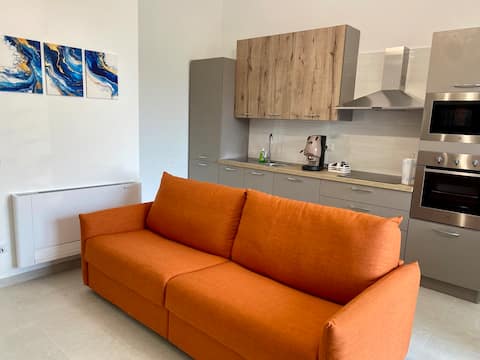
Cilento Contemporary House with Private Garden
Entire Place • 1 bedroom
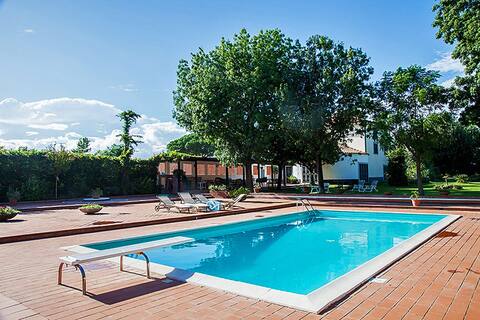
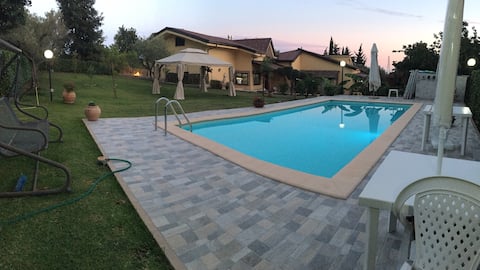
Villa with private pool, 16 guests, tennis court
Entire Place • 7 bedrooms
Note: Performance varies based on location, size, amenities, seasonality, and management quality. Data reflects the past 12 months.
Top Performing Airbnb Hosts in Eboli (2026)
Learn from the best! This table showcases top-performing Airbnb hosts in Eboli based on the number of properties managed and estimated total revenue over the past year. Analyze their scale and performance metrics.
| Host Name | Properties | Grossing Revenue | Stay Reviews | Avg Rating |
|---|---|---|---|---|
| Cosimo | 4 | $94,436 | 153 | 5.00/5.0 |
| Rocco & Annalisa | 2 | $19,889 | 20 | 4.89/5.0 |
| Cilento Key | 1 | $10,158 | 16 | 4.44/5.0 |
| Ruralis | 1 | $9,716 | 4 | 4.75/5.0 |
| Maria | 1 | $6,723 | 81 | 4.89/5.0 |
| Lucianna | 1 | $6,415 | 4 | 5.00/5.0 |
| Enza | 1 | $5,481 | 9 | 5.00/5.0 |
| Antonella | 2 | $4,403 | 11 | 5.00/5.0 |
| Elvira | 1 | $4,196 | 28 | 4.64/5.0 |
| Annarita | 1 | $3,837 | 41 | 4.95/5.0 |
Analyzing the strategies of top hosts, such as their property selection, pricing, and guest communication, can offer valuable lessons for optimizing your own Airbnb operations in Eboli.
Dive Deeper: Advanced Eboli STR Market Data (2026)
Ready to unlock more insights? AirROI provides access to advanced metrics and comprehensive Airbnb data for Eboli. Explore detailed analytics beyond this report to refine your investment strategy, optimize pricing, and maximize your vacation rental profits.
Explore Advanced MetricsEboli Short-Term Rental Market Composition (2026): Property & Room Types
Room Type Distribution
Property Type Distribution
Market Composition Insights for Eboli
- The Eboli Airbnb market composition is heavily skewed towards Entire Home/Apt listings, which make up 82.6% of the 23 active rentals. This indicates strong guest preference for privacy and space.
- Looking at the property type distribution in Eboli, House properties are the most common (47.8%), reflecting the local real estate landscape.
- Houses represent a significant 47.8% portion, catering likely to families or larger groups.
- The presence of 13% Hotel/Boutique listings indicates integration with traditional hospitality.
Eboli Airbnb Room Capacity Analysis (2026): Bedroom Distribution
Distribution of Listings by Number of Bedrooms
Room Capacity Insights for Eboli
- The dominant room capacity in Eboli is 1 bedroom listings, making up 43.5% of the market. This suggests a strong demand for properties suitable for couples or solo travelers.
- Together, 1 bedroom and 2 bedrooms properties represent 69.6% of the active Airbnb listings in Eboli, indicating a high concentration in these sizes.
- A significant 21.7% of listings offer 3+ bedrooms, catering to larger groups and families seeking more space in Eboli.
Eboli Vacation Rental Guest Capacity Trends (2026)
Distribution of Listings by Guest Capacity
Guest Capacity Insights for Eboli
- The most common guest capacity trend in Eboli vacation rentals is listings accommodating 4 guests (26.1%). This suggests the primary traveler segment is likely small families or groups.
- Properties designed for 4 guests and 3 guests dominate the Eboli STR market, accounting for 43.5% of listings.
- 21.7% of properties accommodate 6+ guests, serving the market segment for larger families or group travel in Eboli.
- On average, properties in Eboli are equipped to host 3.7 guests.
Eboli Airbnb Booking Patterns (2026): Available vs. Booked Days
Available Days Distribution
Booked Days Distribution
Booking Pattern Insights for Eboli
- The most common availability pattern in Eboli falls within the 271-366 days range, representing 65.2% of listings. This suggests many properties have significant open periods on their calendars.
- Approximately 100.0% of listings show high availability (181+ days open annually), indicating potential for increased bookings or specific owner usage patterns.
- For booked days, the 1-30 days range is most frequent in Eboli (34.8%), reflecting common guest stay durations or potential owner blocking patterns.
Eboli Airbnb Minimum Stay Requirements Analysis
Distribution of Listings by Minimum Night Requirement
1 Night
10 listings
43.5% of total
2 Nights
2 listings
8.7% of total
7-29 Nights
2 listings
8.7% of total
30+ Nights
9 listings
39.1% of total
Key Insights
- The most prevalent minimum stay requirement in Eboli is 1 Night, adopted by 43.5% of listings. This highlights the market's preference for shorter, flexible bookings.
- A significant segment (39.1%) caters to monthly stays (30+ nights) in Eboli, pointing to opportunities in the extended-stay market.
Recommendations
- Align with the market by considering a 1 Night minimum stay, as 43.5% of Eboli hosts use this setting.
- Explore offering discounts for stays of 30+ nights to attract the 39.1% of the market seeking extended stays.
- Adjust minimum nights based on seasonality – potentially shorter during low season and longer during peak demand periods in Eboli.
Eboli Airbnb Cancellation Policy Trends Analysis (2026)
Super Strict 60 Days
1 listings
4.3% of total
Flexible
11 listings
47.8% of total
Moderate
8 listings
34.8% of total
Firm
1 listings
4.3% of total
Strict
2 listings
8.7% of total
Cancellation Policy Insights for Eboli
- The prevailing Airbnb cancellation policy trend in Eboli is Flexible, used by 47.8% of listings.
- The market strongly favors guest-friendly terms, with 82.6% of listings offering Flexible or Moderate policies. This suggests guests in Eboli may expect booking flexibility.
- Strict cancellation policies are quite rare (8.7%), potentially making listings with this policy less competitive unless justified by high demand or property type.
Recommendations for Hosts
- Consider adopting a Flexible policy to align with the 47.8% market standard in Eboli.
- Using a Strict policy might deter some guests, as only 8.7% of listings use it. Evaluate if potential revenue protection outweighs possible lower booking rates.
- Regularly review your cancellation policy against competitors and market demand shifts in Eboli.
Eboli STR Booking Lead Time Analysis (2026)
Average Booking Lead Time by Month
Booking Lead Time Insights for Eboli
- The overall average booking lead time for vacation rentals in Eboli is 40 days.
- Guests book furthest in advance for stays during August (average 81 days), likely coinciding with peak travel demand or local events.
- The shortest booking windows occur for stays in March (average 8 days), indicating more last-minute travel plans during this time.
- Seasonally, Summer (50 days avg.) sees the longest lead times, while Spring (18 days avg.) has the shortest, reflecting typical travel planning cycles.
Recommendations for Hosts
- Use the overall average lead time (40 days) as a baseline for your pricing and availability strategy in Eboli.
- For August stays, consider implementing length-of-stay discounts or slightly higher rates for bookings made less than 81 days out to capitalize on advance planning.
- During March, focus on last-minute booking availability and promotions, as guests book with very short notice (8 days avg.).
- Target marketing efforts for the Summer season well in advance (at least 50 days) to capture early planners.
- Monitor your own booking lead times against these Eboli averages to identify opportunities for dynamic pricing adjustments.
Popular & Essential Airbnb Amenities in Eboli (2026)
Amenity Prevalence
Amenity Insights for Eboli
- Essential amenities in Eboli that guests expect include: Air conditioning. Lacking these (this) could significantly impact bookings.
- Popular amenities like TV, Hair dryer, Refrigerator are common but not universal. Offering these can provide a competitive edge.
- Warning: Wifi is not universally provided but is considered essential globally. Ensure reliable Wifi is offered.
Recommendations for Hosts
- Ensure your listing includes all essential amenities for Eboli: Air conditioning.
- Prioritize adding missing essentials: Air conditioning.
- Consider adding popular differentiators like TV or Hair dryer to increase appeal.
- Highlight unique or less common amenities you offer (e.g., hot tub, dedicated workspace, EV charger) in your listing description and photos.
- Regularly check competitor amenities in Eboli to stay competitive.
Eboli Airbnb Guest Demographics & Profile Analysis (2026)
Guest Profile Summary for Eboli
- The typical guest profile for Airbnb in Eboli consists of predominantly international visitors (73%), with top international origins including France, typically belonging to the Post-2000s (Gen Z/Alpha) group (50%), primarily speaking English or Italian.
- Domestic travelers account for 27.1% of guests.
- Key international markets include Italy (27.1%) and France (16.9%).
- Top languages spoken are English (41.7%) followed by Italian (23.3%).
- A significant demographic segment is the Post-2000s (Gen Z/Alpha) group, representing 50% of guests.
Recommendations for Hosts
- Focus marketing internationally, particularly towards travelers from France.
- Tailor amenities and listing descriptions to appeal to the dominant Post-2000s (Gen Z/Alpha) demographic (e.g., highlight fast WiFi, smart home features, local guides).
- Highlight unique local experiences or amenities relevant to the primary guest profile.
- Consider seasonal promotions aligned with peak travel times for key origin markets.
Nearby Short-Term Rental Market Comparison
How does the Eboli Airbnb market stack up against its neighbors? Compare key performance metrics like average monthly revenue, ADR, and occupancy rates in surrounding areas to understand the broader regional STR landscape.
| Market | Active Properties | Monthly Revenue | Daily Rate | Avg. Occupancy |
|---|---|---|---|---|
| Positano | 740 | $6,727 | $653.26 | 52% |
| Praiano | 365 | $4,340 | $447.02 | 50% |
| Capri | 424 | $3,912 | $586.24 | 37% |
| Conca dei Marini | 132 | $3,899 | $417.87 | 45% |
| Sorrento | 1,606 | $3,821 | $344.29 | 48% |
| Massa Lubrense | 813 | $3,392 | $408.38 | 42% |
| Furore | 149 | $3,226 | $353.64 | 52% |
| Amalfi | 506 | $3,135 | $319.20 | 45% |
| Ravello | 256 | $3,119 | $333.17 | 42% |
| Atrani | 130 | $2,702 | $224.39 | 50% |