Nocera Inferiore Airbnb Market Analysis 2025: Short Term Rental Data & Vacation Rental Statistics in Campania, Italy
Is Airbnb profitable in Nocera Inferiore in 2025? Explore comprehensive Airbnb analytics for Nocera Inferiore, Campania, Italy to uncover income potential. This 2025 STR market report for Nocera Inferiore, based on AirROI data from September 2024 to August 2025, reveals key trends in the niche market of 18 active listings.
Whether you're considering an Airbnb investment in Nocera Inferiore, optimizing your existing vacation rental, or exploring rental arbitrage opportunities, understanding the Nocera Inferiore Airbnb data is crucial. Leveraging the low regulation environment is key to maximizing your short term rental income potential. Let's dive into the specifics.
Key Nocera Inferiore Airbnb Performance Metrics Overview
Monthly Airbnb Revenue Variations & Income Potential in Nocera Inferiore (2025)
Understanding the monthly revenue variations for Airbnb listings in Nocera Inferiore is key to maximizing your short term rental income potential. Seasonality significantly impacts earnings. Our analysis, based on data from the past 12 months, shows that the peak revenue month for STRs in Nocera Inferiore is typically August, while January often presents the lowest earnings, highlighting opportunities for strategic pricing adjustments during shoulder and low seasons. Explore the typical Airbnb income in Nocera Inferiore across different performance tiers:
- Best-in-class properties (Top 10%) achieve $1,147+ monthly, often utilizing dynamic pricing and superior guest experiences.
- Strong performing properties (Top 25%) earn $867 or more, indicating effective management and desirable locations/amenities.
- Typical properties (Median) generate around $587 per month, representing the average market performance.
- Entry-level properties (Bottom 25%) see earnings around $359, often with potential for optimization.
Average Monthly Airbnb Earnings Trend in Nocera Inferiore
Nocera Inferiore Airbnb Occupancy Rate Trends (2025)
Maximize your bookings by understanding the Nocera Inferiore STR occupancy trends. Seasonal demand shifts significantly influence how often properties are booked. Typically, Augustsees the highest demand (peak season occupancy), while January experiences the lowest (low season). Effective strategies, like adjusting minimum stays or offering promotions, can boost occupancy during slower periods. Here's how different property tiers perform in Nocera Inferiore:
- Best-in-class properties (Top 10%) achieve 51%+ occupancy, indicating high desirability and potentially optimized availability.
- Strong performing properties (Top 25%) maintain 39% or higher occupancy, suggesting good market fit and guest satisfaction.
- Typical properties (Median) have an occupancy rate around 27%.
- Entry-level properties (Bottom 25%) average 18% occupancy, potentially facing higher vacancy.
Average Monthly Occupancy Rate Trend in Nocera Inferiore
Average Daily Rate (ADR) Airbnb Trends in Nocera Inferiore (2025)
Effective short term rental pricing strategy in Nocera Inferiore involves understanding monthly ADR fluctuations. The Average Daily Rate (ADR) for Airbnb in Nocera Inferiore typically peaks in August and dips lowest during April. Leveraging Airbnb dynamic pricing tools or strategies based on this seasonality can significantly boost revenue. Here's a look at the typical nightly rates achieved:
- Best-in-class properties (Top 10%) command rates of $118+ per night, often due to premium features or locations.
- Strong performing properties (Top 25%) achieve nightly rates of $95 or more.
- Typical properties (Median) charge around $74 per night.
- Entry-level properties (Bottom 25%) earn around $54 per night.
Average Daily Rate (ADR) Trend by Month in Nocera Inferiore
Get Live Nocera Inferiore Market Intelligence 👇

Explore Real-time Analytics
Airbnb Seasonality Analysis & Trends in Nocera Inferiore (2025)
Peak Season (August, July, June)
- Revenue averages $915 per month
- Occupancy rates average 37.0%
- Daily rates average $82
Shoulder Season
- Revenue averages $596 per month
- Occupancy maintains around 28.8%
- Daily rates hold near $78
Low Season (January, February, May)
- Revenue drops to average $453 per month
- Occupancy decreases to average 22.6%
- Daily rates adjust to average $77
Seasonality Insights for Nocera Inferiore
- The Airbnb seasonality in Nocera Inferiore shows highly seasonal trends requiring careful strategy. While the sections above show seasonal averages, it's also insightful to look at the extremes:
- During the high season, the absolute peak month showcases Nocera Inferiore's highest earning potential, with monthly revenues capable of climbing to $1,305, occupancy reaching a high of 50.7%, and ADRs peaking at $85.
- Conversely, the slowest single month of the year, typically falling within the low season, marks the market's lowest point. In this month, revenue might dip to $378, occupancy could drop to 17.7%, and ADRs may adjust down to $72.
- Understanding both the seasonal averages and these monthly peaks and troughs in revenue, occupancy, and ADR is crucial for maximizing your Airbnb profit potential in Nocera Inferiore.
Seasonal Strategies for Maximizing Profit
- Peak Season: Maximize revenue through premium pricing and potentially longer minimum stays. Ensure high availability.
- Low Season: Offer competitive pricing, special promotions (e.g., extended stay discounts), and flexible cancellation policies. Target off-season travelers like remote workers or budget-conscious guests.
- Shoulder Seasons: Implement dynamic pricing that balances peak and low rates. Target weekend travelers or specific events. Offer slightly more flexible terms than peak season.
- Regularly analyze your own performance against these Nocera Inferiore seasonality benchmarks and adjust your pricing and availability strategy accordingly.
Best Areas for Airbnb Investment in Nocera Inferiore (2025)
Exploring the top neighborhoods for short-term rentals in Nocera Inferiore? This section highlights key areas, outlining why they are attractive for hosts and guests, along with notable local attractions. Consider these locations based on your target guest profile and investment strategy.
| Neighborhood / Area | Why Host Here? (Target Guests & Appeal) | Key Attractions & Landmarks |
|---|---|---|
| Centro Storico | The historical center of Nocera Inferiore, offering charming streets and historical architecture. A popular area for tourists seeking culture and local cuisine. | Castello di Nocera Inferiore, Basilica di Santa Maria Assunta, Piazza del Corso, Local trattorias, Arts and crafts shops |
| Nocera Superiore | Adjacent to Nocera Inferiore, this area has its own historical sites and is a good base for exploring the larger region, appealing to families and groups. | Castello del Parco, Mausoleo di Cicerone, Local park and green spaces, Shopping areas |
| Viale Garibaldi | A main street in Nocera Inferiore, known for its shops and cafes. It attracts both locals and visitors looking for convenience and activities. | Cafes and restaurants, Shopping boutiques, Cultural events |
| San Matteo | A popular residential area that offers quiet living close to the city center, appealing for longer stays and families. | Parks, Local markets, Family-friendly amenities |
| Via Francesco Crispi | Known for its vibrant atmosphere and local attractions. It's a great spot for tourists wanting local experiences. | Local eateries, Cultural sites, Nearby hiking trails |
| Cimitero Monumentale | Distinctive for its beautiful architecture, this area offers a unique perspective on local heritage and attracts history enthusiasts. | Monumental cemetery, Art and architecture |
| Ponte dei Cani | A scenic area on the outskirts of the town, perfect for travelers looking for nature and outdoor activities, such as hiking. | Nature trails, Scenic views, Peaceful environment |
| Local Vineyards | Nocera Inferiore is near many vineyards, making it a great location for wine lovers and those looking to enjoy local wines and culinary classes. | Wine tours, Gastronomy events, Wine tasting experiences |
Understanding Airbnb License Requirements & STR Laws in Nocera Inferiore (2025)
While Nocera Inferiore, Campania, Italy currently shows low STR regulations, specific Airbnb license requirements might still exist or change. Always verify the latest short term rental regulations and Airbnb license requirements directly with local government authorities for Nocera Inferiore to ensure full compliance before hosting.
(Source: AirROI data, 2025, based on 6% licensed listings)
Top Performing Airbnb Properties in Nocera Inferiore (2025)
Benchmark your potential! Explore examples of top-performing Airbnb properties in Nocera Inferiorebased on Trailing Twelve Month (TTM) revenue. Analyze their characteristics, revenue, occupancy rate, and ADR to understand what drives success in this market.
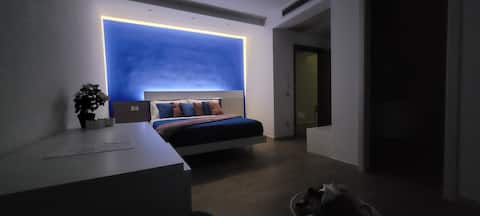
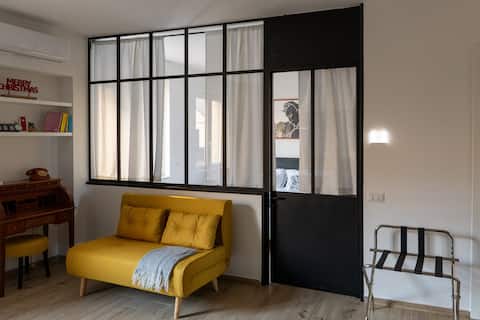
Villa Nasti Luxury Bed Falanghina Room
Private Room • 1 bedroom
Villa Nasti Luxury Bed Taurasi Room
Private Room • 1 bedroom
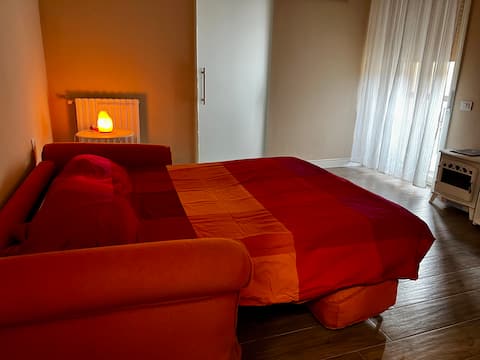
Emilia's house
Entire Place • 1 bedroom
Casa Teresa
Entire Place • 1 bedroom
House Bossa Apartment
Entire Place • 1 bedroom
Apartment Centro Nocera inf
Entire Place • 1 bedroom
Note: Performance varies based on location, size, amenities, seasonality, and management quality. Data reflects the past 12 months.
Top Performing Airbnb Hosts in Nocera Inferiore (2025)
Learn from the best! This table showcases top-performing Airbnb hosts in Nocera Inferiore based on the number of properties managed and estimated total revenue over the past year. Analyze their scale and performance metrics.
| Host Name | Properties | Grossing Revenue | Stay Reviews | Avg Rating |
|---|---|---|---|---|
| Villa Nasti | 2 | $21,817 | 119 | 4.91/5.0 |
| Anna | 1 | $9,205 | 2 | Not Rated |
| Antonio | 1 | $7,266 | 63 | 4.79/5.0 |
| Antonella | 1 | $6,858 | 4 | 5.00/5.0 |
| Alba | 1 | $6,060 | 4 | 4.75/5.0 |
| Daniela | 1 | $5,923 | 45 | 4.73/5.0 |
| Pasquale | 1 | $4,902 | 17 | 4.82/5.0 |
| Alessandra | 1 | $4,862 | 24 | 4.96/5.0 |
| Sabatino | 1 | $3,725 | 1 | Not Rated |
| Michele | 1 | $3,426 | 11 | 4.82/5.0 |
Analyzing the strategies of top hosts, such as their property selection, pricing, and guest communication, can offer valuable lessons for optimizing your own Airbnb operations in Nocera Inferiore.
Dive Deeper: Advanced Nocera Inferiore STR Market Data (2025)
Ready to unlock more insights? AirROI provides access to advanced metrics and comprehensive Airbnb data for Nocera Inferiore. Explore detailed analytics beyond this report to refine your investment strategy, optimize pricing, and maximize your vacation rental profits.
Explore Advanced MetricsNocera Inferiore Short-Term Rental Market Composition (2025): Property & Room Types
Room Type Distribution
Property Type Distribution
Market Composition Insights for Nocera Inferiore
- The Nocera Inferiore Airbnb market composition is heavily skewed towards Entire Home/Apt listings, which make up 83.3% of the 18 active rentals. This indicates strong guest preference for privacy and space.
- Looking at the property type distribution in Nocera Inferiore, Apartment/Condo properties are the most common (61.1%), reflecting the local real estate landscape.
- Houses represent a significant 16.7% portion, catering likely to families or larger groups.
- The presence of 16.7% Hotel/Boutique listings indicates integration with traditional hospitality.
Nocera Inferiore Airbnb Room Capacity Analysis (2025): Bedroom Distribution
Distribution of Listings by Number of Bedrooms
Room Capacity Insights for Nocera Inferiore
- The dominant room capacity in Nocera Inferiore is 1 bedroom listings, making up 77.8% of the market. This suggests a strong demand for properties suitable for couples or solo travelers.
- Together, 1 bedroom and 2 bedrooms properties represent 88.9% of the active Airbnb listings in Nocera Inferiore, indicating a high concentration in these sizes.
- With over half the market (77.8%) consisting of studios or 1-bedroom units, Nocera Inferiore is particularly well-suited for individuals or couples.
Nocera Inferiore Vacation Rental Guest Capacity Trends (2025)
Distribution of Listings by Guest Capacity
Guest Capacity Insights for Nocera Inferiore
- The most common guest capacity trend in Nocera Inferiore vacation rentals is listings accommodating 4 guests (44.4%). This suggests the primary traveler segment is likely small families or groups.
- Properties designed for 4 guests and 3 guests dominate the Nocera Inferiore STR market, accounting for 66.6% of listings.
- On average, properties in Nocera Inferiore are equipped to host 3.4 guests.
Nocera Inferiore Airbnb Booking Patterns (2025): Available vs. Booked Days
Available Days Distribution
Booked Days Distribution
Booking Pattern Insights for Nocera Inferiore
- The most common availability pattern in Nocera Inferiore falls within the 271-366 days range, representing 72.2% of listings. This suggests many properties have significant open periods on their calendars.
- Approximately 100.0% of listings show high availability (181+ days open annually), indicating potential for increased bookings or specific owner usage patterns.
- For booked days, the 31-90 days range is most frequent in Nocera Inferiore (44.4%), reflecting common guest stay durations or potential owner blocking patterns.
Nocera Inferiore Airbnb Minimum Stay Requirements Analysis
Distribution of Listings by Minimum Night Requirement
1 Night
9 listings
52.9% of total
2 Nights
3 listings
17.6% of total
3 Nights
1 listings
5.9% of total
7-29 Nights
3 listings
17.6% of total
30+ Nights
1 listings
5.9% of total
Key Insights
- The most prevalent minimum stay requirement in Nocera Inferiore is 1 Night, adopted by 52.9% of listings. This highlights the market's preference for shorter, flexible bookings.
- A strong majority (70.5%) of the Nocera Inferiore Airbnb data shows acceptance of very short stays (1-2 nights), indicating a dynamic, high-turnover market.
Recommendations
- Align with the market by considering a 1 Night minimum stay, as 52.9% of Nocera Inferiore hosts use this setting.
- Explore offering discounts for stays of 30+ nights to attract the 5.9% of the market seeking extended stays.
- Adjust minimum nights based on seasonality – potentially shorter during low season and longer during peak demand periods in Nocera Inferiore.
Nocera Inferiore Airbnb Cancellation Policy Trends Analysis (2025)
Flexible
10 listings
58.8% of total
Moderate
5 listings
29.4% of total
Strict
2 listings
11.8% of total
Cancellation Policy Insights for Nocera Inferiore
- The prevailing Airbnb cancellation policy trend in Nocera Inferiore is Flexible, used by 58.8% of listings.
- The market strongly favors guest-friendly terms, with 88.2% of listings offering Flexible or Moderate policies. This suggests guests in Nocera Inferiore may expect booking flexibility.
Recommendations for Hosts
- Consider adopting a Flexible policy to align with the 58.8% market standard in Nocera Inferiore.
- Given the high prevalence of Flexible policies (58.8%), offering this can enhance booking appeal, especially during shoulder seasons.
- Using a Strict policy might deter some guests, as only 11.8% of listings use it. Evaluate if potential revenue protection outweighs possible lower booking rates.
- Regularly review your cancellation policy against competitors and market demand shifts in Nocera Inferiore.
Nocera Inferiore STR Booking Lead Time Analysis (2025)
Average Booking Lead Time by Month
Booking Lead Time Insights for Nocera Inferiore
- The overall average booking lead time for vacation rentals in Nocera Inferiore is 31 days.
- Guests book furthest in advance for stays during June (average 76 days), likely coinciding with peak travel demand or local events.
- The shortest booking windows occur for stays in November (average 3 days), indicating more last-minute travel plans during this time.
- Seasonally, Summer (58 days avg.) sees the longest lead times, while Winter (14 days avg.) has the shortest, reflecting typical travel planning cycles.
Recommendations for Hosts
- Use the overall average lead time (31 days) as a baseline for your pricing and availability strategy in Nocera Inferiore.
- For June stays, consider implementing length-of-stay discounts or slightly higher rates for bookings made less than 76 days out to capitalize on advance planning.
- During November, focus on last-minute booking availability and promotions, as guests book with very short notice (3 days avg.).
- Target marketing efforts for the Summer season well in advance (at least 58 days) to capture early planners.
- Monitor your own booking lead times against these Nocera Inferiore averages to identify opportunities for dynamic pricing adjustments.
Popular & Essential Airbnb Amenities in Nocera Inferiore (2025)
Amenity Prevalence
Amenity Insights for Nocera Inferiore
- Popular amenities like Hot water, Bed linens, Hangers are common but not universal. Offering these can provide a competitive edge.
- Warning: Wifi is not universally provided but is considered essential globally. Ensure reliable Wifi is offered.
Recommendations for Hosts
- Consider adding popular differentiators like Hot water or Bed linens to increase appeal.
- Highlight unique or less common amenities you offer (e.g., hot tub, dedicated workspace, EV charger) in your listing description and photos.
- Regularly check competitor amenities in Nocera Inferiore to stay competitive.
Nocera Inferiore Airbnb Guest Demographics & Profile Analysis (2025)
Guest Profile Summary for Nocera Inferiore
- The typical guest profile for Airbnb in Nocera Inferiore consists of a mix of domestic (46%) and international guests, with top international origins including United Kingdom, typically belonging to the Post-2000s (Gen Z/Alpha) group (50%), primarily speaking English or Italian.
- Domestic travelers account for 45.9% of guests.
- Key international markets include Italy (45.9%) and United Kingdom (13.5%).
- Top languages spoken are English (42.1%) followed by Italian (17.5%).
- A significant demographic segment is the Post-2000s (Gen Z/Alpha) group, representing 50% of guests.
Recommendations for Hosts
- Balance marketing efforts between domestic and international channels based on the guest mix.
- Tailor amenities and listing descriptions to appeal to the dominant Post-2000s (Gen Z/Alpha) demographic (e.g., highlight fast WiFi, smart home features, local guides).
- Highlight unique local experiences or amenities relevant to the primary guest profile.
- Consider seasonal promotions aligned with peak travel times for key origin markets.
Nearby Short-Term Rental Market Comparison
How does the Nocera Inferiore Airbnb market stack up against its neighbors? Compare key performance metrics like average monthly revenue, ADR, and occupancy rates in surrounding areas to understand the broader regional STR landscape.
| Market | Active Properties | Monthly Revenue | Daily Rate | Avg. Occupancy |
|---|---|---|---|---|
| Positano | 730 | $6,505 | $634.57 | 50% |
| Praiano | 352 | $4,280 | $444.98 | 50% |
| Conca dei Marini | 127 | $3,694 | $394.01 | 46% |
| Sorrento | 1,565 | $3,600 | $338.63 | 48% |
| Capri | 420 | $3,597 | $577.11 | 36% |
| Massa Lubrense | 821 | $3,198 | $397.88 | 41% |
| Amalfi | 488 | $3,009 | $308.39 | 44% |
| Furore | 156 | $2,800 | $324.75 | 50% |
| Ravello | 272 | $2,798 | $322.35 | 42% |
| Atrani | 124 | $2,686 | $225.86 | 50% |