Nola Airbnb Market Analysis 2025: Short Term Rental Data & Vacation Rental Statistics in Campania, Italy
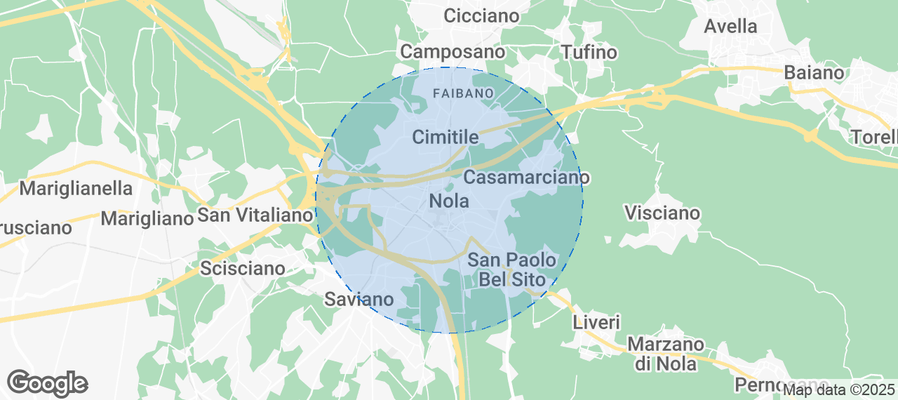
Is Airbnb profitable in Nola in 2025? Explore comprehensive Airbnb analytics for Nola, Campania, Italy to uncover income potential. This 2025 STR market report for Nola, based on AirROI data from December 2024 to November 2025, reveals key trends in the niche market of 19 active listings.
Whether you're considering an Airbnb investment in Nola, optimizing your existing vacation rental, or exploring rental arbitrage opportunities, understanding the Nola Airbnb data is crucial. Navigating the high regulation landscape is key to maximizing your short term rental income potential. Let's dive into the specifics.
Key Nola Airbnb Performance Metrics Overview
Monthly Airbnb Revenue Variations & Income Potential in Nola (2025)
Understanding the monthly revenue variations for Airbnb listings in Nola is key to maximizing your short term rental income potential. Seasonality significantly impacts earnings. Our analysis, based on data from the past 12 months, shows that the peak revenue month for STRs in Nola is typically July, while November often presents the lowest earnings, highlighting opportunities for strategic pricing adjustments during shoulder and low seasons. Explore the typical Airbnb income in Nola across different performance tiers:
- Best-in-class properties (Top 10%) achieve $1,934+ monthly, often utilizing dynamic pricing and superior guest experiences.
- Strong performing properties (Top 25%) earn $1,342 or more, indicating effective management and desirable locations/amenities.
- Typical properties (Median) generate around $759 per month, representing the average market performance.
- Entry-level properties (Bottom 25%) see earnings around $348, often with potential for optimization.
Average Monthly Airbnb Earnings Trend in Nola
Nola Airbnb Occupancy Rate Trends (2025)
Maximize your bookings by understanding the Nola STR occupancy trends. Seasonal demand shifts significantly influence how often properties are booked. Typically, Septembersees the highest demand (peak season occupancy), while November experiences the lowest (low season). Effective strategies, like adjusting minimum stays or offering promotions, can boost occupancy during slower periods. Here's how different property tiers perform in Nola:
- Best-in-class properties (Top 10%) achieve 72%+ occupancy, indicating high desirability and potentially optimized availability.
- Strong performing properties (Top 25%) maintain 52% or higher occupancy, suggesting good market fit and guest satisfaction.
- Typical properties (Median) have an occupancy rate around 30%.
- Entry-level properties (Bottom 25%) average 15% occupancy, potentially facing higher vacancy.
Average Monthly Occupancy Rate Trend in Nola
Average Daily Rate (ADR) Airbnb Trends in Nola (2025)
Effective short term rental pricing strategy in Nola involves understanding monthly ADR fluctuations. The Average Daily Rate (ADR) for Airbnb in Nola typically peaks in June and dips lowest during March. Leveraging Airbnb dynamic pricing tools or strategies based on this seasonality can significantly boost revenue. Here's a look at the typical nightly rates achieved:
- Best-in-class properties (Top 10%) command rates of $118+ per night, often due to premium features or locations.
- Strong performing properties (Top 25%) achieve nightly rates of $88 or more.
- Typical properties (Median) charge around $73 per night.
- Entry-level properties (Bottom 25%) earn around $55 per night.
Average Daily Rate (ADR) Trend by Month in Nola
Get Live Nola Market Intelligence 👇
Explore Real-time Analytics
Airbnb Seasonality Analysis & Trends in Nola (2025)
Peak Season (July, September, June)
- Revenue averages $1,281 per month
- Occupancy rates average 44.5%
- Daily rates average $83
Shoulder Season
- Revenue averages $899 per month
- Occupancy maintains around 36.0%
- Daily rates hold near $75
Low Season (October, November, December)
- Revenue drops to average $664 per month
- Occupancy decreases to average 27.9%
- Daily rates adjust to average $76
Seasonality Insights for Nola
- The Airbnb seasonality in Nola shows highly seasonal trends requiring careful strategy. While the sections above show seasonal averages, it's also insightful to look at the extremes:
- During the high season, the absolute peak month showcases Nola's highest earning potential, with monthly revenues capable of climbing to $1,480, occupancy reaching a high of 50.0%, and ADRs peaking at $90.
- Conversely, the slowest single month of the year, typically falling within the low season, marks the market's lowest point. In this month, revenue might dip to $563, occupancy could drop to 21.4%, and ADRs may adjust down to $73.
- Understanding both the seasonal averages and these monthly peaks and troughs in revenue, occupancy, and ADR is crucial for maximizing your Airbnb profit potential in Nola.
Seasonal Strategies for Maximizing Profit
- Peak Season: Maximize revenue through premium pricing and potentially longer minimum stays. Ensure high availability.
- Low Season: Offer competitive pricing, special promotions (e.g., extended stay discounts), and flexible cancellation policies. Target off-season travelers like remote workers or budget-conscious guests.
- Shoulder Seasons: Implement dynamic pricing that balances peak and low rates. Target weekend travelers or specific events. Offer slightly more flexible terms than peak season.
- Regularly analyze your own performance against these Nola seasonality benchmarks and adjust your pricing and availability strategy accordingly.
Best Areas for Airbnb Investment in Nola (2025)
Exploring the top neighborhoods for short-term rentals in Nola? This section highlights key areas, outlining why they are attractive for hosts and guests, along with notable local attractions. Consider these locations based on your target guest profile and investment strategy.
| Neighborhood / Area | Why Host Here? (Target Guests & Appeal) | Key Attractions & Landmarks |
|---|---|---|
| Centro Storico | The historic center of Naples, full of narrow streets, stunning architecture, and rich history. Ideal for tourists wanting to experience the authentic Neapolitan culture. | Castel Nuovo, Piazza del Plebiscito, Naples Cathedral, Spaccanapoli, National Archaeological Museum of Naples, Santa Chiara |
| Chiaia | An upscale neighborhood known for its shopping, dining, and beautiful sea views. Perfect for travelers looking for luxury and a vibrant nightlife. | Via Chiaia, Lungomare Caracciolo, Villa Comunale, Piazza Sannazaro, Palazzo Donn'Anna, Ciro a Mergellina |
| Vomero | A hilly district that offers panoramic views of Naples. Known for its elegant residences and local boutiques, attracting families and tourists seeking a quieter stay. | Castel Sant'Elmo, Certosa di San Martino, Vomero Park, Piazza Vanvitelli, Via Scarlatti, Panoramic views of the bay |
| Mergellina | A charming waterfront area with a promenade and marina, popular among tourists for its beautiful views of the Bay of Naples and delicious seafood restaurants. | Molo di Mergellina, Lungomare di Napoli, Parco Virgiliano, Santa Maria del Parto, Restaurants along the waterfront, Ferry services to nearby islands |
| Pozzuoli | Known for its rich history and proximity to the Phlegraean Fields. Attracts visitors looking for archaeological sites and natural beauty. | Flavian Amphitheater, Solfatara Crater, Cuma Archaeological Park, Temple of Serapis, Baia Archaeological Park, Coastline views |
| Sorrento | A beautiful coastal town that offers stunning views of the Bay of Naples and is a gateway to the Amalfi Coast. Attracts tourists seeking picturesque landscapes and luxury accommodations. | Piazza Tasso, Marina Grande, Sorrento Cathedral, Museo Correale, Sorrento Beaches, Limoncello tastings |
| Capri | Famous for its breathtaking scenery, luxury resorts, and high-end shopping. A prime destination for affluent travelers looking for an upscale getaway. | Faraglioni Rocks, Villa Jovis, Piazzetta di Capri, Anacapri, Marina Piccola, Blue Grotto |
| Amalfi | The picturesque town on the Amalfi Coast is known for its stunning coastline and historical significance. Perfect for tourists wanting to explore the beauty of southern Italy. | Amalfi Cathedral, Villa Rufolo, Paper Museum, Path of the Gods, Marina Grande, Beach clubs |
Understanding Airbnb License Requirements & STR Laws in Nola (2025)
Yes, Nola, Campania, Italy enforces high STR regulations. Obtaining a license and ensuring compliance is almost certainly required according to current 2025 STR laws. Always verify the latest short term rental regulations and Airbnb license requirements directly with local government authorities for Nola to ensure full compliance before hosting.
(Source: AirROI data, 2025, based on 79% licensed listings)
Top Performing Airbnb Properties in Nola (2025)
Benchmark your potential! Explore examples of top-performing Airbnb properties in Nolabased on Trailing Twelve Month (TTM) revenue. Analyze their characteristics, revenue, occupancy rate, and ADR to understand what drives success in this market.
An oasis of wellness on your travels
Entire Place • 2 bedrooms
Ro's home
Entire Place • 2 bedrooms
![[Piazza Duomo] -Civico 32](https://a0.muscache.com/im/pictures/hosting/Hosting-1284255291182429278/original/4007d1bd-bbd8-49e9-ba78-f674b21008e4.jpeg?im_w=480&im_format=avif)
[Piazza Duomo] -Civico 32
Entire Place • 1 bedroom

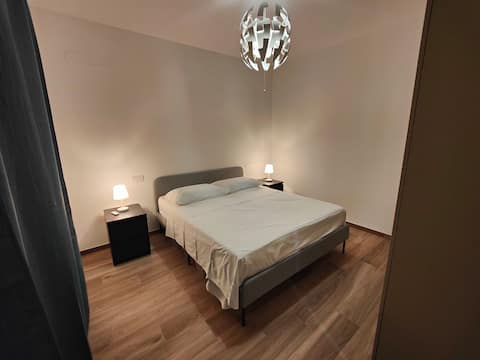
Masseria Mascia Period Residence
Entire Place • 3 bedrooms

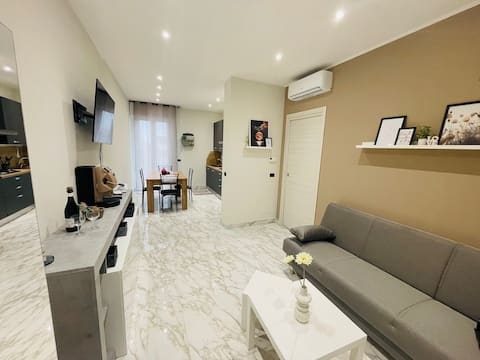
B&B NOLA – Maison Monique
Entire Place • 1 bedroom
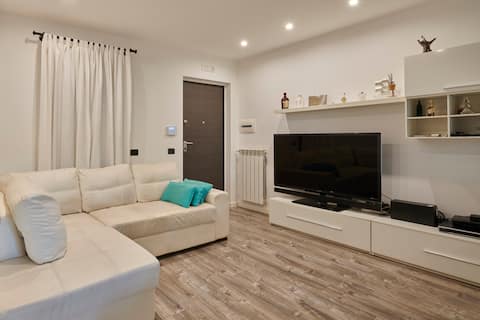
New Apartment in the Center
Entire Place • 1 bedroom
Note: Performance varies based on location, size, amenities, seasonality, and management quality. Data reflects the past 12 months.
Top Performing Airbnb Hosts in Nola (2025)
Learn from the best! This table showcases top-performing Airbnb hosts in Nola based on the number of properties managed and estimated total revenue over the past year. Analyze their scale and performance metrics.
| Host Name | Properties | Grossing Revenue | Stay Reviews | Avg Rating |
|---|---|---|---|---|
| Ciro | 1 | $22,602 | 39 | 4.90/5.0 |
| Romy | 1 | $20,020 | 15 | 4.87/5.0 |
| Fare Casa Srl Management | 2 | $17,661 | 56 | 4.52/5.0 |
| Alessandro | 1 | $13,593 | 13 | 4.92/5.0 |
| MauroMascia Real Estate | 2 | $13,299 | 2 | Not Rated |
| Monica | 1 | $12,613 | 6 | 5.00/5.0 |
| Daniele | 1 | $10,077 | 54 | 4.72/5.0 |
| Maria | 1 | $5,615 | 2 | Not Rated |
| Andrea | 1 | $4,582 | 5 | 4.40/5.0 |
| Andrys | 1 | $3,213 | 25 | 4.56/5.0 |
Analyzing the strategies of top hosts, such as their property selection, pricing, and guest communication, can offer valuable lessons for optimizing your own Airbnb operations in Nola.
Dive Deeper: Advanced Nola STR Market Data (2025)
Ready to unlock more insights? AirROI provides access to advanced metrics and comprehensive Airbnb data for Nola. Explore detailed analytics beyond this report to refine your investment strategy, optimize pricing, and maximize your vacation rental profits.
Explore Advanced MetricsNola Short-Term Rental Market Composition (2025): Property & Room Types
Room Type Distribution
Property Type Distribution
Market Composition Insights for Nola
- The Nola Airbnb market composition is heavily skewed towards Entire Home/Apt listings, which make up 73.7% of the 19 active rentals. This indicates strong guest preference for privacy and space.
- Looking at the property type distribution in Nola, Apartment/Condo properties are the most common (68.4%), reflecting the local real estate landscape.
- The presence of 21.1% Hotel/Boutique listings indicates integration with traditional hospitality.
Nola Airbnb Room Capacity Analysis (2025): Bedroom Distribution
Distribution of Listings by Number of Bedrooms
Room Capacity Insights for Nola
- The dominant room capacity in Nola is 1 bedroom listings, making up 36.8% of the market. This suggests a strong demand for properties suitable for couples or solo travelers.
- Together, 1 bedroom and 2 bedrooms properties represent 68.4% of the active Airbnb listings in Nola, indicating a high concentration in these sizes.
Nola Vacation Rental Guest Capacity Trends (2025)
Distribution of Listings by Guest Capacity
Guest Capacity Insights for Nola
- The most common guest capacity trend in Nola vacation rentals is listings accommodating 4 guests (42.1%). This suggests the primary traveler segment is likely small families or groups.
- Properties designed for 4 guests and 8+ guests dominate the Nola STR market, accounting for 52.6% of listings.
- 15.8% of properties accommodate 6+ guests, serving the market segment for larger families or group travel in Nola.
- On average, properties in Nola are equipped to host 3.4 guests.
Nola Airbnb Booking Patterns (2025): Available vs. Booked Days
Available Days Distribution
Booked Days Distribution
Booking Pattern Insights for Nola
- The most common availability pattern in Nola falls within the 271-366 days range, representing 63.2% of listings. This suggests many properties have significant open periods on their calendars.
- Approximately 89.5% of listings show high availability (181+ days open annually), indicating potential for increased bookings or specific owner usage patterns.
- For booked days, the 1-30 days range is most frequent in Nola (36.8%), reflecting common guest stay durations or potential owner blocking patterns.
- A notable 10.5% of properties secure long booking periods (181+ days booked per year), highlighting successful long-term rental strategies or significant owner usage.
Nola Airbnb Minimum Stay Requirements Analysis
Distribution of Listings by Minimum Night Requirement
1 Night
10 listings
52.6% of total
2 Nights
1 listings
5.3% of total
7-29 Nights
4 listings
21.1% of total
30+ Nights
4 listings
21.1% of total
Key Insights
- The most prevalent minimum stay requirement in Nola is 1 Night, adopted by 52.6% of listings. This highlights the market's preference for shorter, flexible bookings.
- A significant segment (21.1%) caters to monthly stays (30+ nights) in Nola, pointing to opportunities in the extended-stay market.
Recommendations
- Align with the market by considering a 1 Night minimum stay, as 52.6% of Nola hosts use this setting.
- Explore offering discounts for stays of 30+ nights to attract the 21.1% of the market seeking extended stays.
- Adjust minimum nights based on seasonality – potentially shorter during low season and longer during peak demand periods in Nola.
Nola Airbnb Cancellation Policy Trends Analysis (2025)
Super Strict 30 Days
1 listings
5.3% of total
Flexible
12 listings
63.2% of total
Moderate
5 listings
26.3% of total
Firm
1 listings
5.3% of total
Cancellation Policy Insights for Nola
- The prevailing Airbnb cancellation policy trend in Nola is Flexible, used by 63.2% of listings.
- The market strongly favors guest-friendly terms, with 89.5% of listings offering Flexible or Moderate policies. This suggests guests in Nola may expect booking flexibility.
Recommendations for Hosts
- Consider adopting a Flexible policy to align with the 63.2% market standard in Nola.
- Given the high prevalence of Flexible policies (63.2%), offering this can enhance booking appeal, especially during shoulder seasons.
- Regularly review your cancellation policy against competitors and market demand shifts in Nola.
Nola STR Booking Lead Time Analysis (2025)
Average Booking Lead Time by Month
Booking Lead Time Insights for Nola
- The overall average booking lead time for vacation rentals in Nola is 49 days.
- Guests book furthest in advance for stays during June (average 74 days), likely coinciding with peak travel demand or local events.
- The shortest booking windows occur for stays in February (average 14 days), indicating more last-minute travel plans during this time.
- Seasonally, Summer (50 days avg.) sees the longest lead times, while Winter (17 days avg.) has the shortest, reflecting typical travel planning cycles.
Recommendations for Hosts
- Use the overall average lead time (49 days) as a baseline for your pricing and availability strategy in Nola.
- For June stays, consider implementing length-of-stay discounts or slightly higher rates for bookings made less than 74 days out to capitalize on advance planning.
- During February, focus on last-minute booking availability and promotions, as guests book with very short notice (14 days avg.).
- Target marketing efforts for the Summer season well in advance (at least 50 days) to capture early planners.
- Monitor your own booking lead times against these Nola averages to identify opportunities for dynamic pricing adjustments.
Popular & Essential Airbnb Amenities in Nola (2025)
Amenity Prevalence
Amenity Insights for Nola
- Popular amenities like TV, Wifi, Air conditioning are common but not universal. Offering these can provide a competitive edge.
- Warning: Wifi is not universally provided but is considered essential globally. Ensure reliable Wifi is offered.
Recommendations for Hosts
- Consider adding popular differentiators like TV or Wifi to increase appeal.
- Highlight unique or less common amenities you offer (e.g., hot tub, dedicated workspace, EV charger) in your listing description and photos.
- Regularly check competitor amenities in Nola to stay competitive.
Nola Airbnb Guest Demographics & Profile Analysis (2025)
Guest Profile Summary for Nola
- The typical guest profile for Airbnb in Nola consists of a mix of domestic (38%) and international guests, with top international origins including France, typically belonging to the Post-2000s (Gen Z/Alpha) group (50%), primarily speaking English or Italian.
- Domestic travelers account for 38.3% of guests.
- Key international markets include Italy (38.3%) and France (12.8%).
- Top languages spoken are English (33.9%) followed by Italian (22%).
- A significant demographic segment is the Post-2000s (Gen Z/Alpha) group, representing 50% of guests.
Recommendations for Hosts
- Focus marketing internationally, particularly towards travelers from France.
- Tailor amenities and listing descriptions to appeal to the dominant Post-2000s (Gen Z/Alpha) demographic (e.g., highlight fast WiFi, smart home features, local guides).
- Highlight unique local experiences or amenities relevant to the primary guest profile.
- Consider seasonal promotions aligned with peak travel times for key origin markets.
Nearby Short-Term Rental Market Comparison
How does the Nola Airbnb market stack up against its neighbors? Compare key performance metrics like average monthly revenue, ADR, and occupancy rates in surrounding areas to understand the broader regional STR landscape.
| Market | Active Properties | Monthly Revenue | Daily Rate | Avg. Occupancy |
|---|---|---|---|---|
| Positano | 730 | $6,820 | $656.66 | 51% |
| Praiano | 359 | $4,408 | $452.36 | 50% |
| Capri | 417 | $4,000 | $595.95 | 37% |
| Sorrento | 1,580 | $3,839 | $347.94 | 48% |
| Conca dei Marini | 132 | $3,726 | $406.71 | 44% |
| Massa Lubrense | 806 | $3,386 | $404.46 | 41% |
| Furore | 149 | $3,257 | $330.46 | 52% |
| Amalfi | 490 | $3,229 | $321.57 | 44% |
| Ravello | 252 | $3,193 | $332.75 | 42% |
| Atrani | 127 | $2,762 | $227.89 | 50% |