Ameglia Airbnb Market Analysis 2026: Short Term Rental Data & Vacation Rental Statistics in Liguria, Italy
Is Airbnb profitable in Ameglia in 2026? Explore comprehensive Airbnb analytics for Ameglia, Liguria, Italy to uncover income potential. This 2026 STR market report for Ameglia, based on AirROI data from February 2025 to January 2026, reveals key trends in the niche market of 134 active listings.
Whether you're considering an Airbnb investment in Ameglia, optimizing your existing vacation rental, or exploring rental arbitrage opportunities, understanding the Ameglia Airbnb data is crucial. Navigating the high regulation landscape is key to maximizing your short term rental income potential. Let's dive into the specifics.
Key Ameglia Airbnb Performance Metrics Overview
Monthly Airbnb Revenue Variations & Income Potential in Ameglia (2026)
Understanding the monthly revenue variations for Airbnb listings in Ameglia is key to maximizing your short term rental income potential. Seasonality significantly impacts earnings. Our analysis, based on data from the past 12 months, shows that the peak revenue month for STRs in Ameglia is typically August, while February often presents the lowest earnings, highlighting opportunities for strategic pricing adjustments during shoulder and low seasons. Explore the typical Airbnb income in Ameglia across different performance tiers:
- Best-in-class properties (Top 10%) achieve $3,804+ monthly, often utilizing dynamic pricing and superior guest experiences.
- Strong performing properties (Top 25%) earn $1,992 or more, indicating effective management and desirable locations/amenities.
- Typical properties (Median) generate around $1,063 per month, representing the average market performance.
- Entry-level properties (Bottom 25%) see earnings around $476, often with potential for optimization.
Average Monthly Airbnb Earnings Trend in Ameglia
Ameglia Airbnb Occupancy Rate Trends (2026)
Maximize your bookings by understanding the Ameglia STR occupancy trends. Seasonal demand shifts significantly influence how often properties are booked. Typically, Augustsees the highest demand (peak season occupancy), while January experiences the lowest (low season). Effective strategies, like adjusting minimum stays or offering promotions, can boost occupancy during slower periods. Here's how different property tiers perform in Ameglia:
- Best-in-class properties (Top 10%) achieve 66%+ occupancy, indicating high desirability and potentially optimized availability.
- Strong performing properties (Top 25%) maintain 41% or higher occupancy, suggesting good market fit and guest satisfaction.
- Typical properties (Median) have an occupancy rate around 25%.
- Entry-level properties (Bottom 25%) average 12% occupancy, potentially facing higher vacancy.
Average Monthly Occupancy Rate Trend in Ameglia
Average Daily Rate (ADR) Airbnb Trends in Ameglia (2026)
Effective short term rental pricing strategy in Ameglia involves understanding monthly ADR fluctuations. The Average Daily Rate (ADR) for Airbnb in Ameglia typically peaks in August and dips lowest during March. Leveraging Airbnb dynamic pricing tools or strategies based on this seasonality can significantly boost revenue. Here's a look at the typical nightly rates achieved:
- Best-in-class properties (Top 10%) command rates of $274+ per night, often due to premium features or locations.
- Strong performing properties (Top 25%) achieve nightly rates of $187 or more.
- Typical properties (Median) charge around $131 per night.
- Entry-level properties (Bottom 25%) earn around $99 per night.
Average Daily Rate (ADR) Trend by Month in Ameglia
Get Live Ameglia Market Intelligence 👇

Explore Real-time Analytics
Airbnb Seasonality Analysis & Trends in Ameglia (2026)
Peak Season (August, July, June)
- Revenue averages $2,736 per month
- Occupancy rates average 43.8%
- Daily rates average $179
Shoulder Season
- Revenue averages $1,424 per month
- Occupancy maintains around 29.0%
- Daily rates hold near $160
Low Season (January, February, December)
- Revenue drops to average $768 per month
- Occupancy decreases to average 15.7%
- Daily rates adjust to average $159
Seasonality Insights for Ameglia
- The Airbnb seasonality in Ameglia shows highly seasonal trends requiring careful strategy. While the sections above show seasonal averages, it's also insightful to look at the extremes:
- During the high season, the absolute peak month showcases Ameglia's highest earning potential, with monthly revenues capable of climbing to $3,548, occupancy reaching a high of 55.7%, and ADRs peaking at $184.
- Conversely, the slowest single month of the year, typically falling within the low season, marks the market's lowest point. In this month, revenue might dip to $472, occupancy could drop to 13.8%, and ADRs may adjust down to $151.
- Understanding both the seasonal averages and these monthly peaks and troughs in revenue, occupancy, and ADR is crucial for maximizing your Airbnb profit potential in Ameglia.
Seasonal Strategies for Maximizing Profit
- Peak Season: Maximize revenue through premium pricing and potentially longer minimum stays. Ensure high availability.
- Low Season: Offer competitive pricing, special promotions (e.g., extended stay discounts), and flexible cancellation policies. Target off-season travelers like remote workers or budget-conscious guests.
- Shoulder Seasons: Implement dynamic pricing that balances peak and low rates. Target weekend travelers or specific events. Offer slightly more flexible terms than peak season.
- Regularly analyze your own performance against these Ameglia seasonality benchmarks and adjust your pricing and availability strategy accordingly.
Best Areas for Airbnb Investment in Ameglia (2026)
Exploring the top neighborhoods for short-term rentals in Ameglia? This section highlights key areas, outlining why they are attractive for hosts and guests, along with notable local attractions. Consider these locations based on your target guest profile and investment strategy.
| Neighborhood / Area | Why Host Here? (Target Guests & Appeal) | Key Attractions & Landmarks |
|---|---|---|
| Fossola | A picturesque village by the beach, Fossola is perfect for tourists looking for a relaxing seaside getaway. Its scenic views and tranquility attract many visitors. | Fossola Beach, Local seafood restaurants, Hiking trails, Picturesque landscapes, Cultural festivals |
| Ameglia Village Center | The heart of Ameglia, where visitors can experience traditional Italian culture, local shops, and restaurants. It's a great location for tourists wanting to explore local life. | Historic buildings, Local markets, Cafés and restaurants, Nearby hiking trails |
| Montemarcello | A hilltop village offering stunning views of the surrounding landscape and a quiet atmosphere. It's ideal for eco-tourism and those seeking nature. | Montemarcello Regional Park, Beautiful hiking trails, Panoramic viewpoints, Nature observation |
| Nostra Signora della Salute | Known for its local chapel and beautiful walking paths, this area attracts visitors who enjoy spirituality and nature combined. | Chapel of Nostra Signora della Salute, Nature trails, Local flora and fauna, Peaceful surroundings |
| Magra River Area | The area around the Magra River provides opportunities for outdoor activities such as canoeing and fishing, appealing to adventure-seeking tourists. | Magra River boating, Fishing spots, Parks along the river, Cycling paths |
| Lerici | Just a short distance from Ameglia, Lerici is famous for its stunning beaches, castle, and vibrant social scene, making it a desirable location for tourists. | Lerici Castle, Beaches, Piazza Garibaldi, Water sports activities, Local shops |
| Portovenere | A UNESCO World Heritage site, this charming town is known for its colorful buildings and breathtaking coastal views, attracting culture and history lovers. | San Pietro Church, Portovenere Castle, Cinque Terre views, Local seafood |
| Cinque Terre Access Point | Proximity to the stunning Cinque Terre National Park makes this area ideal for tourists wanting to explore the five beautiful villages along the coast. | Cinque Terre villages, Hiking trails, Stunning coastal scenery, Local wines and cuisine |
Understanding Airbnb License Requirements & STR Laws in Ameglia (2026)
Yes, Ameglia, Liguria, Italy enforces high STR regulations. Obtaining a license and ensuring compliance is almost certainly required according to current 2026 STR laws. Always verify the latest short term rental regulations and Airbnb license requirements directly with local government authorities for Ameglia to ensure full compliance before hosting.
(Source: AirROI data, 2026, based on 84% licensed listings)
Top Performing Airbnb Properties in Ameglia (2026)
Benchmark your potential! Explore examples of top-performing Airbnb properties in Amegliabased on Trailing Twelve Month (TTM) revenue. Analyze their characteristics, revenue, occupancy rate, and ADR to understand what drives success in this market.
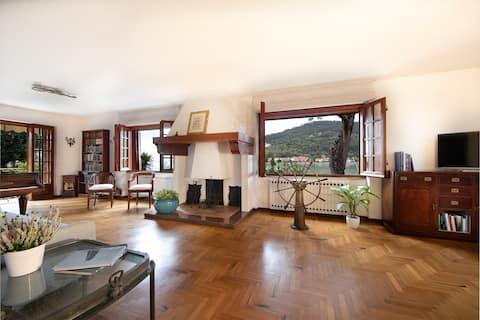
Villa Sottomarino, by the sea in Fiumaretta
Entire Place • 3 bedrooms

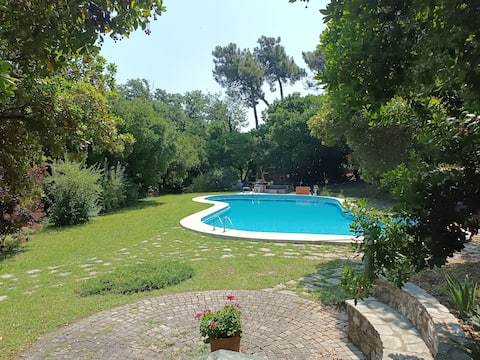
Charming 2 bedroom Villa with pool
Entire Place • 2 bedrooms
Boccamonte#3 - Homes with a stone's throw from the sea
Entire Place • 2 bedrooms
Villa Ameglia Harmony of Nature
Entire Place • 6 bedrooms

Beautiful Il Sogno Pool House
Entire Place • 2 bedrooms
Casa Manuela
Entire Place • 2 bedrooms
Note: Performance varies based on location, size, amenities, seasonality, and management quality. Data reflects the past 12 months.
Top Performing Airbnb Hosts in Ameglia (2026)
Learn from the best! This table showcases top-performing Airbnb hosts in Ameglia based on the number of properties managed and estimated total revenue over the past year. Analyze their scale and performance metrics.
| Host Name | Properties | Grossing Revenue | Stay Reviews | Avg Rating |
|---|---|---|---|---|
| Maddalena | 2 | $95,795 | 102 | 4.89/5.0 |
| Alice | 1 | $59,235 | 14 | 4.71/5.0 |
| Maria Rosa | 1 | $55,876 | 12 | 4.92/5.0 |
| Maisons | 3 | $52,684 | 54 | 4.22/5.0 |
| CD Nautica Srl | 2 | $50,654 | 78 | 4.80/5.0 |
| Jelena | 1 | $49,980 | 22 | 4.95/5.0 |
| Federico | 4 | $48,641 | 144 | 4.54/5.0 |
| Paolo | 2 | $48,324 | 46 | 4.96/5.0 |
| Jacopo | 1 | $47,980 | 49 | 4.98/5.0 |
| Novasol | 1 | $44,334 | 12 | 4.75/5.0 |
Analyzing the strategies of top hosts, such as their property selection, pricing, and guest communication, can offer valuable lessons for optimizing your own Airbnb operations in Ameglia.
Dive Deeper: Advanced Ameglia STR Market Data (2026)
Ready to unlock more insights? AirROI provides access to advanced metrics and comprehensive Airbnb data for Ameglia. Explore detailed analytics beyond this report to refine your investment strategy, optimize pricing, and maximize your vacation rental profits.
Explore Advanced MetricsAmeglia Short-Term Rental Market Composition (2026): Property & Room Types
Room Type Distribution
Property Type Distribution
Market Composition Insights for Ameglia
- The Ameglia Airbnb market composition is heavily skewed towards Entire Home/Apt listings, which make up 90.3% of the 134 active rentals. This indicates strong guest preference for privacy and space.
- Looking at the property type distribution in Ameglia, House properties are the most common (49.3%), reflecting the local real estate landscape.
- Houses represent a significant 49.3% portion, catering likely to families or larger groups.
- Smaller segments like hotel/boutique (combined 0.7%) offer potential for unique stay experiences.
Ameglia Airbnb Room Capacity Analysis (2026): Bedroom Distribution
Distribution of Listings by Number of Bedrooms
Room Capacity Insights for Ameglia
- The dominant room capacity in Ameglia is 2 bedrooms listings, making up 49.3% of the market. This suggests a strong demand for properties suitable for couples or solo travelers.
- Together, 2 bedrooms and 1 bedroom properties represent 75.4% of the active Airbnb listings in Ameglia, indicating a high concentration in these sizes.
Ameglia Vacation Rental Guest Capacity Trends (2026)
Distribution of Listings by Guest Capacity
Guest Capacity Insights for Ameglia
- The most common guest capacity trend in Ameglia vacation rentals is listings accommodating 4 guests (32.1%). This suggests the primary traveler segment is likely small families or groups.
- Properties designed for 4 guests and 5 guests dominate the Ameglia STR market, accounting for 54.5% of listings.
- 25.4% of properties accommodate 6+ guests, serving the market segment for larger families or group travel in Ameglia.
- On average, properties in Ameglia are equipped to host 4.3 guests.
Ameglia Airbnb Booking Patterns (2026): Available vs. Booked Days
Available Days Distribution
Booked Days Distribution
Booking Pattern Insights for Ameglia
- The most common availability pattern in Ameglia falls within the 271-366 days range, representing 76.9% of listings. This suggests many properties have significant open periods on their calendars.
- Approximately 96.3% of listings show high availability (181+ days open annually), indicating potential for increased bookings or specific owner usage patterns.
- For booked days, the 1-30 days range is most frequent in Ameglia (38.1%), reflecting common guest stay durations or potential owner blocking patterns.
- A notable 3.7% of properties secure long booking periods (181+ days booked per year), highlighting successful long-term rental strategies or significant owner usage.
Ameglia Airbnb Minimum Stay Requirements Analysis
Distribution of Listings by Minimum Night Requirement
1 Night
10 listings
7.5% of total
2 Nights
26 listings
19.4% of total
3 Nights
12 listings
9% of total
4-6 Nights
24 listings
17.9% of total
7-29 Nights
6 listings
4.5% of total
30+ Nights
56 listings
41.8% of total
Key Insights
- The most prevalent minimum stay requirement in Ameglia is 30+ Nights, adopted by 41.8% of listings. This highlights the market's preference for longer commitments.
- A significant segment (41.8%) caters to monthly stays (30+ nights) in Ameglia, pointing to opportunities in the extended-stay market.
Recommendations
- Align with the market by considering a 30+ Nights minimum stay, as 41.8% of Ameglia hosts use this setting.
- If feasible, allowing 1-night stays, especially midweek or during low season, could capture last-minute bookings, as only 7.5% currently do.
- Explore offering discounts for stays of 30+ nights to attract the 41.8% of the market seeking extended stays.
- Adjust minimum nights based on seasonality – potentially shorter during low season and longer during peak demand periods in Ameglia.
Ameglia Airbnb Cancellation Policy Trends Analysis (2026)
Super Strict 60 Days
2 listings
1.5% of total
Limited
3 listings
2.3% of total
Super Strict 30 Days
3 listings
2.3% of total
Flexible
22 listings
16.7% of total
Moderate
60 listings
45.5% of total
Firm
28 listings
21.2% of total
Strict
14 listings
10.6% of total
Cancellation Policy Insights for Ameglia
- The prevailing Airbnb cancellation policy trend in Ameglia is Moderate, used by 45.5% of listings.
- There's a relatively balanced mix between guest-friendly (62.2%) and stricter (31.8%) policies, offering choices for different guest needs.
Recommendations for Hosts
- Consider adopting a Moderate policy to align with the 45.5% market standard in Ameglia.
- Using a Strict policy might deter some guests, as only 10.6% of listings use it. Evaluate if potential revenue protection outweighs possible lower booking rates.
- Regularly review your cancellation policy against competitors and market demand shifts in Ameglia.
Ameglia STR Booking Lead Time Analysis (2026)
Average Booking Lead Time by Month
Booking Lead Time Insights for Ameglia
- The overall average booking lead time for vacation rentals in Ameglia is 54 days.
- Guests book furthest in advance for stays during August (average 83 days), likely coinciding with peak travel demand or local events.
- The shortest booking windows occur for stays in February (average 5 days), indicating more last-minute travel plans during this time.
- Seasonally, Summer (66 days avg.) sees the longest lead times, while Winter (33 days avg.) has the shortest, reflecting typical travel planning cycles.
Recommendations for Hosts
- Use the overall average lead time (54 days) as a baseline for your pricing and availability strategy in Ameglia.
- For August stays, consider implementing length-of-stay discounts or slightly higher rates for bookings made less than 83 days out to capitalize on advance planning.
- During February, focus on last-minute booking availability and promotions, as guests book with very short notice (5 days avg.).
- Target marketing efforts for the Summer season well in advance (at least 66 days) to capture early planners.
- Monitor your own booking lead times against these Ameglia averages to identify opportunities for dynamic pricing adjustments.
Popular & Essential Airbnb Amenities in Ameglia (2026)
Amenity Prevalence
Amenity Insights for Ameglia
- Popular amenities like Kitchen, Refrigerator, Hair dryer are common but not universal. Offering these can provide a competitive edge.
- Warning: Wifi is not universally provided but is considered essential globally. Ensure reliable Wifi is offered.
Recommendations for Hosts
- Consider adding popular differentiators like Kitchen or Refrigerator to increase appeal.
- Highlight unique or less common amenities you offer (e.g., hot tub, dedicated workspace, EV charger) in your listing description and photos.
- Regularly check competitor amenities in Ameglia to stay competitive.
Ameglia Airbnb Guest Demographics & Profile Analysis (2026)
Guest Profile Summary for Ameglia
- The typical guest profile for Airbnb in Ameglia consists of predominantly international visitors (72%), with top international origins including Germany, typically belonging to the Post-2000s (Gen Z/Alpha) group (50%), primarily speaking English or Italian.
- Domestic travelers account for 28.0% of guests.
- Key international markets include Italy (28%) and Germany (18.9%).
- Top languages spoken are English (33.9%) followed by Italian (17.9%).
- A significant demographic segment is the Post-2000s (Gen Z/Alpha) group, representing 50% of guests.
Recommendations for Hosts
- Focus marketing internationally, particularly towards travelers from Germany.
- Tailor amenities and listing descriptions to appeal to the dominant Post-2000s (Gen Z/Alpha) demographic (e.g., highlight fast WiFi, smart home features, local guides).
- Highlight unique local experiences or amenities relevant to the primary guest profile.
- Consider seasonal promotions aligned with peak travel times for key origin markets.
Nearby Short-Term Rental Market Comparison
How does the Ameglia Airbnb market stack up against its neighbors? Compare key performance metrics like average monthly revenue, ADR, and occupancy rates in surrounding areas to understand the broader regional STR landscape.
| Market | Active Properties | Monthly Revenue | Daily Rate | Avg. Occupancy |
|---|---|---|---|---|
| Ranco | 12 | $5,691 | $536.46 | 42% |
| Laglio | 64 | $4,334 | $518.58 | 43% |
| Cassinasco | 19 | $3,887 | $718.39 | 40% |
| Castelfranco di Sotto | 47 | $3,777 | $377.39 | 39% |
| Cossano Belbo | 15 | $3,763 | $326.53 | 36% |
| Portofino | 77 | $3,585 | $509.42 | 38% |
| Bellagio | 461 | $3,466 | $325.87 | 49% |
| Vico Morcote | 12 | $3,347 | $317.07 | 46% |
| Sala Comacina | 73 | $3,332 | $451.20 | 46% |
| Carate Urio | 76 | $3,200 | $362.97 | 41% |