Beverino Airbnb Market Analysis 2026: Short Term Rental Data & Vacation Rental Statistics in Liguria, Italy
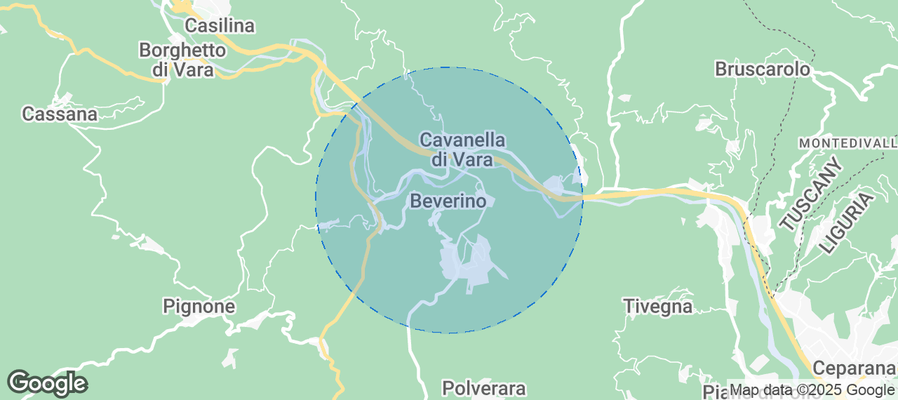
Is Airbnb profitable in Beverino in 2026? Explore comprehensive Airbnb analytics for Beverino, Liguria, Italy to uncover income potential. This 2026 STR market report for Beverino, based on AirROI data from February 2025 to January 2026, reveals key trends in the niche market of 19 active listings.
Whether you're considering an Airbnb investment in Beverino, optimizing your existing vacation rental, or exploring rental arbitrage opportunities, understanding the Beverino Airbnb data is crucial. Navigating the high regulation landscape is key to maximizing your short term rental income potential. Let's dive into the specifics.
Key Beverino Airbnb Performance Metrics Overview
Monthly Airbnb Revenue Variations & Income Potential in Beverino (2026)
Understanding the monthly revenue variations for Airbnb listings in Beverino is key to maximizing your short term rental income potential. Seasonality significantly impacts earnings. Our analysis, based on data from the past 12 months, shows that the peak revenue month for STRs in Beverino is typically August, while December often presents the lowest earnings, highlighting opportunities for strategic pricing adjustments during shoulder and low seasons. Explore the typical Airbnb income in Beverino across different performance tiers:
- Best-in-class properties (Top 10%) achieve $2,020+ monthly, often utilizing dynamic pricing and superior guest experiences.
- Strong performing properties (Top 25%) earn $1,466 or more, indicating effective management and desirable locations/amenities.
- Typical properties (Median) generate around $703 per month, representing the average market performance.
- Entry-level properties (Bottom 25%) see earnings around $483, often with potential for optimization.
Average Monthly Airbnb Earnings Trend in Beverino
Beverino Airbnb Occupancy Rate Trends (2026)
Maximize your bookings by understanding the Beverino STR occupancy trends. Seasonal demand shifts significantly influence how often properties are booked. Typically, Augustsees the highest demand (peak season occupancy), while January experiences the lowest (low season). Effective strategies, like adjusting minimum stays or offering promotions, can boost occupancy during slower periods. Here's how different property tiers perform in Beverino:
- Best-in-class properties (Top 10%) achieve 47%+ occupancy, indicating high desirability and potentially optimized availability.
- Strong performing properties (Top 25%) maintain 35% or higher occupancy, suggesting good market fit and guest satisfaction.
- Typical properties (Median) have an occupancy rate around 22%.
- Entry-level properties (Bottom 25%) average 15% occupancy, potentially facing higher vacancy.
Average Monthly Occupancy Rate Trend in Beverino
Average Daily Rate (ADR) Airbnb Trends in Beverino (2026)
Effective short term rental pricing strategy in Beverino involves understanding monthly ADR fluctuations. The Average Daily Rate (ADR) for Airbnb in Beverino typically peaks in December and dips lowest during April. Leveraging Airbnb dynamic pricing tools or strategies based on this seasonality can significantly boost revenue. Here's a look at the typical nightly rates achieved:
- Best-in-class properties (Top 10%) command rates of $215+ per night, often due to premium features or locations.
- Strong performing properties (Top 25%) achieve nightly rates of $130 or more.
- Typical properties (Median) charge around $95 per night.
- Entry-level properties (Bottom 25%) earn around $85 per night.
Average Daily Rate (ADR) Trend by Month in Beverino
Get Live Beverino Market Intelligence 👇
Explore Real-time Analytics
Airbnb Seasonality Analysis & Trends in Beverino (2026)
Peak Season (August, July, September)
- Revenue averages $1,836 per month
- Occupancy rates average 41.5%
- Daily rates average $123
Shoulder Season
- Revenue averages $1,021 per month
- Occupancy maintains around 28.1%
- Daily rates hold near $112
Low Season (January, October, December)
- Revenue drops to average $305 per month
- Occupancy decreases to average 7.8%
- Daily rates adjust to average $127
Seasonality Insights for Beverino
- The Airbnb seasonality in Beverino shows highly seasonal trends requiring careful strategy. While the sections above show seasonal averages, it's also insightful to look at the extremes:
- During the high season, the absolute peak month showcases Beverino's highest earning potential, with monthly revenues capable of climbing to $2,403, occupancy reaching a high of 54.3%, and ADRs peaking at $128.
- Conversely, the slowest single month of the year, typically falling within the low season, marks the market's lowest point. In this month, revenue might dip to $170, occupancy could drop to 4.5%, and ADRs may adjust down to $106.
- Understanding both the seasonal averages and these monthly peaks and troughs in revenue, occupancy, and ADR is crucial for maximizing your Airbnb profit potential in Beverino.
Seasonal Strategies for Maximizing Profit
- Peak Season: Maximize revenue through premium pricing and potentially longer minimum stays. Ensure high availability.
- Low Season: Offer competitive pricing, special promotions (e.g., extended stay discounts), and flexible cancellation policies. Target off-season travelers like remote workers or budget-conscious guests.
- Shoulder Seasons: Implement dynamic pricing that balances peak and low rates. Target weekend travelers or specific events. Offer slightly more flexible terms than peak season.
- Regularly analyze your own performance against these Beverino seasonality benchmarks and adjust your pricing and availability strategy accordingly.
Best Areas for Airbnb Investment in Beverino (2026)
Exploring the top neighborhoods for short-term rentals in Beverino? This section highlights key areas, outlining why they are attractive for hosts and guests, along with notable local attractions. Consider these locations based on your target guest profile and investment strategy.
| Neighborhood / Area | Why Host Here? (Target Guests & Appeal) | Key Attractions & Landmarks |
|---|---|---|
| Beverino Center | The charming town center offers a blend of local culture and easy access to surrounding attractions in Levanto and Monterosso. Perfect for guests looking to experience the authentic Ligurian lifestyle. | Beverino Castle, Local markets, Church of San Giovanni Battista, Gastronomy tours |
| Cinque Terre National Park | A UNESCO World Heritage site known for its breathtaking coastal views, colorful villages, and hiking trails. Ideal for nature lovers and tourists seeking adventure. | Vernazza, Monterosso al Mare, Riomaggiore, Hiking trails, Beach access |
| Castello di Monteriggioni | A historic castle area that attracts tourists seeking history and beautiful landscapes. Serves as a great base for exploring the nearby Chianti region. | Monteriggioni Castle, Wine tasting, Local vineyards, Historical tours |
| Levanto | A popular seaside town known for its beautiful beaches and as the gateway to the Cinque Terre. Attracts beachgoers and outdoor enthusiasts. | Levanto Beach, Surfing spots, Cycling routes, Lungomare di Levanto |
| La Spezia | Larger city nearby offering excellent transport links to the Cinque Terre, great for travelers who prefer city amenities and close proximity to nature. | Marina di La Spezia, Museo Tecnico Navale, Castello di San Giorgio, Local seafood restaurants |
| Riomaggiore | One of the picturesque villages of Cinque Terre, famous for its colorful buildings and stunning sea views. Attracts tourists looking to immerse themselves in a unique coastal experience. | Via dell'Amore, Riomaggiore Beach, Local seafood dining, Historical architecture |
| Portovenere | A beautiful coastal village known for its stunning views and rich history. Ideal for tourists seeking a more tranquil setting with access to the Gulf of Poets. | Portovenere Church, Doria Castle, Palmaria Island, Scenic boat tours |
| Santo Stefano di Magra | A quieter area compared to the tourist hotspots, offering easy access to both the seaside and the countryside. Ideal for families and longer stays. | Local parks, Hiking trails, Proximity to La Spezia, Cultural festivals |
Understanding Airbnb License Requirements & STR Laws in Beverino (2026)
Yes, Beverino, Liguria, Italy enforces high STR regulations. Obtaining a license and ensuring compliance is almost certainly required according to current 2026 STR laws. Always verify the latest short term rental regulations and Airbnb license requirements directly with local government authorities for Beverino to ensure full compliance before hosting.
(Source: AirROI data, 2026, based on 68% licensed listings)
Top Performing Airbnb Properties in Beverino (2026)
Benchmark your potential! Explore examples of top-performing Airbnb properties in Beverinobased on Trailing Twelve Month (TTM) revenue. Analyze their characteristics, revenue, occupancy rate, and ADR to understand what drives success in this market.
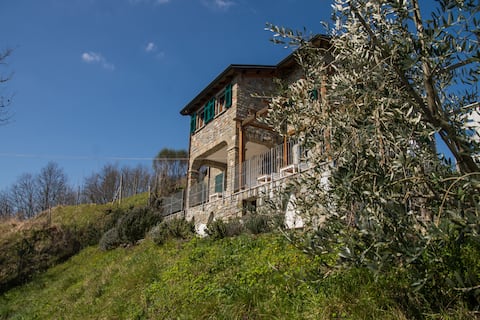
Angiò nel Cere' Farmhouse - 5 Terre
Entire Place • 4 bedrooms
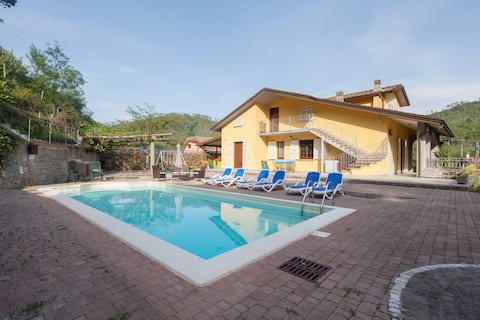
House with pool near 5 Terre-011003-AFF-0008
Entire Place • 3 bedrooms
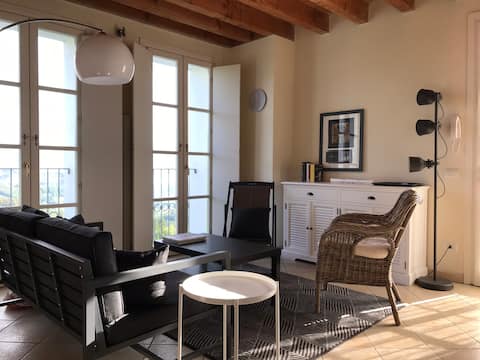
Il Poggio - A nest with a view, in Cinque Terre
Entire Place • 2 bedrooms
Vara House 1890, near 5 Terre
Entire Place • 2 bedrooms
La Collina del Moro
Entire Place • 1 bedroom
Amazing house in "5 Terre" area!
Entire Place • 2 bedrooms
Note: Performance varies based on location, size, amenities, seasonality, and management quality. Data reflects the past 12 months.
Top Performing Airbnb Hosts in Beverino (2026)
Learn from the best! This table showcases top-performing Airbnb hosts in Beverino based on the number of properties managed and estimated total revenue over the past year. Analyze their scale and performance metrics.
| Host Name | Properties | Grossing Revenue | Stay Reviews | Avg Rating |
|---|---|---|---|---|
| Maria-Francesca | 4 | $34,768 | 92 | 4.96/5.0 |
| Laura | 1 | $17,747 | 101 | 4.73/5.0 |
| Marilena & Gianni | 1 | $13,821 | 65 | 4.85/5.0 |
| Chiara | 1 | $13,584 | 5 | 4.80/5.0 |
| Carla Morena | 1 | $13,561 | 38 | 4.97/5.0 |
| Sascha | 1 | $9,855 | 212 | 4.79/5.0 |
| Francesco | 1 | $5,809 | 27 | 4.78/5.0 |
| Giuliana | 1 | $4,866 | 9 | 4.67/5.0 |
| Ornella | 2 | $4,785 | 63 | 4.88/5.0 |
| Giulia | 1 | $4,547 | 9 | 4.89/5.0 |
Analyzing the strategies of top hosts, such as their property selection, pricing, and guest communication, can offer valuable lessons for optimizing your own Airbnb operations in Beverino.
Dive Deeper: Advanced Beverino STR Market Data (2026)
Ready to unlock more insights? AirROI provides access to advanced metrics and comprehensive Airbnb data for Beverino. Explore detailed analytics beyond this report to refine your investment strategy, optimize pricing, and maximize your vacation rental profits.
Explore Advanced MetricsBeverino Short-Term Rental Market Composition (2026): Property & Room Types
Room Type Distribution
Property Type Distribution
Market Composition Insights for Beverino
- The Beverino Airbnb market composition is heavily skewed towards Entire Home/Apt listings, which make up 63.2% of the 19 active rentals. This indicates strong guest preference for privacy and space.
- However, a notable 36.8% share for Private Rooms suggests opportunities for budget-conscious travelers or hosts renting out spare rooms.
- Looking at the property type distribution in Beverino, House properties are the most common (36.8%), reflecting the local real estate landscape.
- Houses represent a significant 36.8% portion, catering likely to families or larger groups.
- The presence of 26.3% Hotel/Boutique listings indicates integration with traditional hospitality.
Beverino Airbnb Room Capacity Analysis (2026): Bedroom Distribution
Distribution of Listings by Number of Bedrooms
Room Capacity Insights for Beverino
- The dominant room capacity in Beverino is 2 bedrooms listings, making up 31.6% of the market. This suggests a strong demand for properties suitable for couples or solo travelers.
- Together, 2 bedrooms and 1 bedroom properties represent 47.4% of the active Airbnb listings in Beverino, indicating a high concentration in these sizes.
Beverino Vacation Rental Guest Capacity Trends (2026)
Distribution of Listings by Guest Capacity
Guest Capacity Insights for Beverino
- The most common guest capacity trend in Beverino vacation rentals is listings accommodating 4 guests (31.6%). This suggests the primary traveler segment is likely small families or groups.
- Properties designed for 4 guests and 2 guests dominate the Beverino STR market, accounting for 42.1% of listings.
- 15.9% of properties accommodate 6+ guests, serving the market segment for larger families or group travel in Beverino.
- On average, properties in Beverino are equipped to host 2.8 guests.
Beverino Airbnb Booking Patterns (2026): Available vs. Booked Days
Available Days Distribution
Booked Days Distribution
Booking Pattern Insights for Beverino
- The most common availability pattern in Beverino falls within the 271-366 days range, representing 84.2% of listings. This suggests many properties have significant open periods on their calendars.
- Approximately 100.0% of listings show high availability (181+ days open annually), indicating potential for increased bookings or specific owner usage patterns.
- For booked days, the 1-30 days range is most frequent in Beverino (42.1%), reflecting common guest stay durations or potential owner blocking patterns.
Beverino Airbnb Minimum Stay Requirements Analysis
Distribution of Listings by Minimum Night Requirement
1 Night
5 listings
26.3% of total
2 Nights
4 listings
21.1% of total
3 Nights
1 listings
5.3% of total
4-6 Nights
3 listings
15.8% of total
30+ Nights
6 listings
31.6% of total
Key Insights
- The most prevalent minimum stay requirement in Beverino is 30+ Nights, adopted by 31.6% of listings. This highlights the market's preference for longer commitments.
- A significant segment (31.6%) caters to monthly stays (30+ nights) in Beverino, pointing to opportunities in the extended-stay market.
Recommendations
- Align with the market by considering a 30+ Nights minimum stay, as 31.6% of Beverino hosts use this setting.
- If feasible, allowing 1-night stays, especially midweek or during low season, could capture last-minute bookings, as only 26.3% currently do.
- Explore offering discounts for stays of 30+ nights to attract the 31.6% of the market seeking extended stays.
- Adjust minimum nights based on seasonality – potentially shorter during low season and longer during peak demand periods in Beverino.
Beverino Airbnb Cancellation Policy Trends Analysis (2026)
Limited
1 listings
5.3% of total
Flexible
5 listings
26.3% of total
Moderate
12 listings
63.2% of total
Firm
1 listings
5.3% of total
Cancellation Policy Insights for Beverino
- The prevailing Airbnb cancellation policy trend in Beverino is Moderate, used by 63.2% of listings.
- The market strongly favors guest-friendly terms, with 89.5% of listings offering Flexible or Moderate policies. This suggests guests in Beverino may expect booking flexibility.
Recommendations for Hosts
- Consider adopting a Moderate policy to align with the 63.2% market standard in Beverino.
- Regularly review your cancellation policy against competitors and market demand shifts in Beverino.
Beverino STR Booking Lead Time Analysis (2026)
Average Booking Lead Time by Month
Booking Lead Time Insights for Beverino
- The overall average booking lead time for vacation rentals in Beverino is 66 days.
- Guests book furthest in advance for stays during August (average 92 days), likely coinciding with peak travel demand or local events.
- The shortest booking windows occur for stays in November (average 1 days), indicating more last-minute travel plans during this time.
- Seasonally, Summer (63 days avg.) sees the longest lead times, while Winter (19 days avg.) has the shortest, reflecting typical travel planning cycles.
Recommendations for Hosts
- Use the overall average lead time (66 days) as a baseline for your pricing and availability strategy in Beverino.
- For August stays, consider implementing length-of-stay discounts or slightly higher rates for bookings made less than 92 days out to capitalize on advance planning.
- During November, focus on last-minute booking availability and promotions, as guests book with very short notice (1 days avg.).
- Target marketing efforts for the Summer season well in advance (at least 63 days) to capture early planners.
- Monitor your own booking lead times against these Beverino averages to identify opportunities for dynamic pricing adjustments.
Popular & Essential Airbnb Amenities in Beverino (2026)
Amenity Prevalence
Amenity Insights for Beverino
- Popular amenities like Hot water, Hair dryer, Heating are common but not universal. Offering these can provide a competitive edge.
- Warning: Wifi is not universally provided but is considered essential globally. Ensure reliable Wifi is offered.
Recommendations for Hosts
- Consider adding popular differentiators like Hot water or Hair dryer to increase appeal.
- Highlight unique or less common amenities you offer (e.g., hot tub, dedicated workspace, EV charger) in your listing description and photos.
- Regularly check competitor amenities in Beverino to stay competitive.
Beverino Airbnb Guest Demographics & Profile Analysis (2026)
Guest Profile Summary for Beverino
- The typical guest profile for Airbnb in Beverino consists of predominantly international visitors (93%), with top international origins including United Kingdom, typically belonging to the Post-2000s (Gen Z/Alpha) group (50%), primarily speaking English or French.
- Domestic travelers account for 6.7% of guests.
- Key international markets include France (23.3%) and United Kingdom (20%).
- Top languages spoken are English (38.2%) followed by French (14.7%).
- A significant demographic segment is the Post-2000s (Gen Z/Alpha) group, representing 50% of guests.
Recommendations for Hosts
- Focus marketing internationally, particularly towards travelers from United Kingdom.
- Tailor amenities and listing descriptions to appeal to the dominant Post-2000s (Gen Z/Alpha) demographic (e.g., highlight fast WiFi, smart home features, local guides).
- Highlight unique local experiences or amenities relevant to the primary guest profile.
- Consider seasonal promotions aligned with peak travel times for key origin markets.
Nearby Short-Term Rental Market Comparison
How does the Beverino Airbnb market stack up against its neighbors? Compare key performance metrics like average monthly revenue, ADR, and occupancy rates in surrounding areas to understand the broader regional STR landscape.
| Market | Active Properties | Monthly Revenue | Daily Rate | Avg. Occupancy |
|---|---|---|---|---|
| Ranco | 12 | $5,691 | $536.46 | 42% |
| Laglio | 64 | $4,334 | $518.58 | 43% |
| Cassinasco | 19 | $3,887 | $718.39 | 40% |
| Castelfranco di Sotto | 47 | $3,777 | $377.39 | 39% |
| Cossano Belbo | 15 | $3,763 | $326.53 | 36% |
| Portofino | 77 | $3,585 | $509.42 | 38% |
| Bellagio | 461 | $3,466 | $325.87 | 49% |
| Vico Morcote | 12 | $3,347 | $317.07 | 46% |
| Sala Comacina | 73 | $3,332 | $451.20 | 46% |
| Carate Urio | 76 | $3,200 | $362.97 | 41% |