Borghetto Santo Spirito Airbnb Market Analysis 2026: Short Term Rental Data & Vacation Rental Statistics in Liguria, Italy
Is Airbnb profitable in Borghetto Santo Spirito in 2026? Explore comprehensive Airbnb analytics for Borghetto Santo Spirito, Liguria, Italy to uncover income potential. This 2026 STR market report for Borghetto Santo Spirito, based on AirROI data from February 2025 to January 2026, reveals key trends in the niche market of 91 active listings.
Whether you're considering an Airbnb investment in Borghetto Santo Spirito, optimizing your existing vacation rental, or exploring rental arbitrage opportunities, understanding the Borghetto Santo Spirito Airbnb data is crucial. Navigating the high regulation landscape is key to maximizing your short term rental income potential. Let's dive into the specifics.
Key Borghetto Santo Spirito Airbnb Performance Metrics Overview
Monthly Airbnb Revenue Variations & Income Potential in Borghetto Santo Spirito (2026)
Understanding the monthly revenue variations for Airbnb listings in Borghetto Santo Spirito is key to maximizing your short term rental income potential. Seasonality significantly impacts earnings. Our analysis, based on data from the past 12 months, shows that the peak revenue month for STRs in Borghetto Santo Spirito is typically August, while January often presents the lowest earnings, highlighting opportunities for strategic pricing adjustments during shoulder and low seasons. Explore the typical Airbnb income in Borghetto Santo Spirito across different performance tiers:
- Best-in-class properties (Top 10%) achieve $3,053+ monthly, often utilizing dynamic pricing and superior guest experiences.
- Strong performing properties (Top 25%) earn $2,041 or more, indicating effective management and desirable locations/amenities.
- Typical properties (Median) generate around $1,344 per month, representing the average market performance.
- Entry-level properties (Bottom 25%) see earnings around $733, often with potential for optimization.
Average Monthly Airbnb Earnings Trend in Borghetto Santo Spirito
Borghetto Santo Spirito Airbnb Occupancy Rate Trends (2026)
Maximize your bookings by understanding the Borghetto Santo Spirito STR occupancy trends. Seasonal demand shifts significantly influence how often properties are booked. Typically, Augustsees the highest demand (peak season occupancy), while January experiences the lowest (low season). Effective strategies, like adjusting minimum stays or offering promotions, can boost occupancy during slower periods. Here's how different property tiers perform in Borghetto Santo Spirito:
- Best-in-class properties (Top 10%) achieve 71%+ occupancy, indicating high desirability and potentially optimized availability.
- Strong performing properties (Top 25%) maintain 51% or higher occupancy, suggesting good market fit and guest satisfaction.
- Typical properties (Median) have an occupancy rate around 33%.
- Entry-level properties (Bottom 25%) average 16% occupancy, potentially facing higher vacancy.
Average Monthly Occupancy Rate Trend in Borghetto Santo Spirito
Average Daily Rate (ADR) Airbnb Trends in Borghetto Santo Spirito (2026)
Effective short term rental pricing strategy in Borghetto Santo Spirito involves understanding monthly ADR fluctuations. The Average Daily Rate (ADR) for Airbnb in Borghetto Santo Spirito typically peaks in August and dips lowest during March. Leveraging Airbnb dynamic pricing tools or strategies based on this seasonality can significantly boost revenue. Here's a look at the typical nightly rates achieved:
- Best-in-class properties (Top 10%) command rates of $211+ per night, often due to premium features or locations.
- Strong performing properties (Top 25%) achieve nightly rates of $163 or more.
- Typical properties (Median) charge around $123 per night.
- Entry-level properties (Bottom 25%) earn around $93 per night.
Average Daily Rate (ADR) Trend by Month in Borghetto Santo Spirito
Get Live Borghetto Santo Spirito Market Intelligence 👇

Explore Real-time Analytics
Airbnb Seasonality Analysis & Trends in Borghetto Santo Spirito (2026)
Peak Season (August, July, June)
- Revenue averages $3,240 per month
- Occupancy rates average 58.6%
- Daily rates average $169
Shoulder Season
- Revenue averages $1,172 per month
- Occupancy maintains around 29.5%
- Daily rates hold near $143
Low Season (January, February, March)
- Revenue drops to average $804 per month
- Occupancy decreases to average 27.5%
- Daily rates adjust to average $136
Seasonality Insights for Borghetto Santo Spirito
- The Airbnb seasonality in Borghetto Santo Spirito shows highly seasonal trends requiring careful strategy. While the sections above show seasonal averages, it's also insightful to look at the extremes:
- During the high season, the absolute peak month showcases Borghetto Santo Spirito's highest earning potential, with monthly revenues capable of climbing to $4,040, occupancy reaching a high of 69.2%, and ADRs peaking at $179.
- Conversely, the slowest single month of the year, typically falling within the low season, marks the market's lowest point. In this month, revenue might dip to $622, occupancy could drop to 16.5%, and ADRs may adjust down to $126.
- Understanding both the seasonal averages and these monthly peaks and troughs in revenue, occupancy, and ADR is crucial for maximizing your Airbnb profit potential in Borghetto Santo Spirito.
Seasonal Strategies for Maximizing Profit
- Peak Season: Maximize revenue through premium pricing and potentially longer minimum stays. Ensure high availability.
- Low Season: Offer competitive pricing, special promotions (e.g., extended stay discounts), and flexible cancellation policies. Target off-season travelers like remote workers or budget-conscious guests.
- Shoulder Seasons: Implement dynamic pricing that balances peak and low rates. Target weekend travelers or specific events. Offer slightly more flexible terms than peak season.
- Regularly analyze your own performance against these Borghetto Santo Spirito seasonality benchmarks and adjust your pricing and availability strategy accordingly.
Best Areas for Airbnb Investment in Borghetto Santo Spirito (2026)
Exploring the top neighborhoods for short-term rentals in Borghetto Santo Spirito? This section highlights key areas, outlining why they are attractive for hosts and guests, along with notable local attractions. Consider these locations based on your target guest profile and investment strategy.
| Neighborhood / Area | Why Host Here? (Target Guests & Appeal) | Key Attractions & Landmarks |
|---|---|---|
| Borghetto Santo Spirito Beachfront | Beautiful sandy beaches ideal for relaxing vacations. Popular destination for families and beach lovers, easy access to the Ligurian Sea. | Borghetto Santo Spirito Beach, Spiaggia Libera, Chiosco Margaret, Beach Bars, Water Sports Activities |
| Historical Center | Charming and picturesque old town with narrow alleys and local shops. Ideal for tourists wanting to experience the authentic Italian lifestyle. | Church of San Matteo, Piazza Italia, Gelateria La Dolce Vita, Local Restaurants, Artisan Shops |
| Cave of Toirano | Nearby natural attraction with stunning caves and historical significance. Popular with nature enthusiasts and adventure seekers. | Toirano Caves, Guided Tours, Nature Trails, Picnic Areas, Stalactites and Stalagmites |
| San Bernardino | A quiet area known for its scenic views and hillside villas. Great for those seeking peace and tranquility near the ocean. | San Bernardino Church, Scenic Lookouts, Hiking Trails, Vineyards, Local Cuisine Restaurants |
| Savona | Nearby city offering more urban amenities, shopping, and dining options. A good contrast to the seaside charm of Borghetto. | Savona Cathedral, Port of Savona, Shopping District, Museums, Food Markets |
| Celle Ligure | Charming neighboring town with beautiful beaches and a relaxed atmosphere, perfect for day trips from Borghetto. | Celle Ligure Beach, Historic Buildings, Seaside Promenade, Walking Trails, Local Seafood Restaurants |
| Varazze | Popular tourist destination known for its beautiful coastline and vibrant summer life, attracting visitors to its beaches and nightlife. | Varazze Beach, Nautical Club, Old Town, Restaurants and Cafes, Nightlife |
| Finale Ligure | Famous for its beautiful landscapes, outdoor sports, and historical sites. Excellent for tourists looking for adventure and culture. | Finalborgo, Rock Climbing Areas, Finale Ligure Beach, Archaeological Sites, Hiking Trails |
Understanding Airbnb License Requirements & STR Laws in Borghetto Santo Spirito (2026)
Yes, Borghetto Santo Spirito, Liguria, Italy enforces high STR regulations. Obtaining a license and ensuring compliance is almost certainly required according to current 2026 STR laws. Always verify the latest short term rental regulations and Airbnb license requirements directly with local government authorities for Borghetto Santo Spirito to ensure full compliance before hosting.
(Source: AirROI data, 2026, based on 96% licensed listings)
Top Performing Airbnb Properties in Borghetto Santo Spirito (2026)
Benchmark your potential! Explore examples of top-performing Airbnb properties in Borghetto Santo Spiritobased on Trailing Twelve Month (TTM) revenue. Analyze their characteristics, revenue, occupancy rate, and ADR to understand what drives success in this market.
Borelli Castle Bella Vista
Entire Place • 2 bedrooms
![[20 meters from the sea] Vacations close to everything](https://a0.muscache.com/im/pictures/miso/Hosting-1115306815200533655/original/5df5873e-6342-4f0e-9a88-bad9d97c2550.jpeg?im_w=480&im_format=avif)
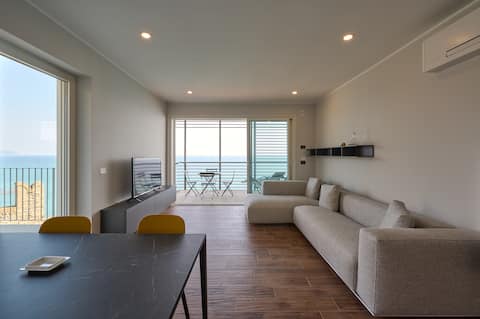
[20 meters from the sea] Vacations close to everything
Entire Place • 1 bedroom
Le Lanterne 1 - Luxury Apartments - Happy Rentals
Entire Place • 1 bedroom

Le Lanterne 3 Luxury Apartments - Happy Rentals
Entire Place • 1 bedroom
![Your Beach Holiday I [100 m from the sea]](https://a0.muscache.com/im/pictures/hosting/Hosting-999783597865998427/original/484ef31b-3135-44df-a366-dcc892f654f4.jpeg?im_w=480&im_format=avif)
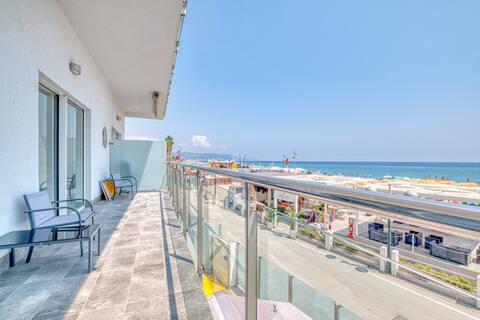
Your Beach Holiday I [100 m from the sea]
Entire Place • 2 bedrooms
![Your Beach Holiday II [100 m from the sea]](https://a0.muscache.com/im/pictures/hosting/Hosting-11473475/original/026e8b56-98bd-46c4-9fec-0e38a03a5052.jpeg?im_w=480&im_format=avif)
Your Beach Holiday II [100 m from the sea]
Entire Place • 2 bedrooms
Note: Performance varies based on location, size, amenities, seasonality, and management quality. Data reflects the past 12 months.
Top Performing Airbnb Hosts in Borghetto Santo Spirito (2026)
Learn from the best! This table showcases top-performing Airbnb hosts in Borghetto Santo Spirito based on the number of properties managed and estimated total revenue over the past year. Analyze their scale and performance metrics.
| Host Name | Properties | Grossing Revenue | Stay Reviews | Avg Rating |
|---|---|---|---|---|
| Anthony | 6 | $147,589 | 38 | 4.19/5.0 |
| Sabia Estate | 5 | $135,446 | 896 | 4.66/5.0 |
| Treehouse Italia | 4 | $102,416 | 127 | 4.53/5.0 |
| Italianway | 11 | $100,218 | 23 | 4.48/5.0 |
| Loyals Srl | 2 | $65,559 | 26 | 4.47/5.0 |
| Enjoy Rentals | 5 | $43,714 | 29 | 4.32/5.0 |
| Fabio | 3 | $30,771 | 60 | 4.88/5.0 |
| Maria Luigia | 2 | $30,446 | 65 | 4.96/5.0 |
| Giuseppe | 1 | $22,885 | 20 | 4.75/5.0 |
| Barbara Anna | 1 | $22,485 | 5 | 4.40/5.0 |
Analyzing the strategies of top hosts, such as their property selection, pricing, and guest communication, can offer valuable lessons for optimizing your own Airbnb operations in Borghetto Santo Spirito.
Dive Deeper: Advanced Borghetto Santo Spirito STR Market Data (2026)
Ready to unlock more insights? AirROI provides access to advanced metrics and comprehensive Airbnb data for Borghetto Santo Spirito. Explore detailed analytics beyond this report to refine your investment strategy, optimize pricing, and maximize your vacation rental profits.
Explore Advanced MetricsBorghetto Santo Spirito Short-Term Rental Market Composition (2026): Property & Room Types
Room Type Distribution
Property Type Distribution
Market Composition Insights for Borghetto Santo Spirito
- The Borghetto Santo Spirito Airbnb market composition is heavily skewed towards Entire Home/Apt listings, which make up 100% of the 91 active rentals. This indicates strong guest preference for privacy and space.
- Looking at the property type distribution in Borghetto Santo Spirito, Apartment/Condo properties are the most common (96.7%), reflecting the local real estate landscape.
- Smaller segments like house (combined 3.3%) offer potential for unique stay experiences.
Borghetto Santo Spirito Airbnb Room Capacity Analysis (2026): Bedroom Distribution
Distribution of Listings by Number of Bedrooms
Room Capacity Insights for Borghetto Santo Spirito
- The dominant room capacity in Borghetto Santo Spirito is 1 bedroom listings, making up 61.5% of the market. This suggests a strong demand for properties suitable for couples or solo travelers.
- Together, 1 bedroom and 2 bedrooms properties represent 87.9% of the active Airbnb listings in Borghetto Santo Spirito, indicating a high concentration in these sizes.
- With over half the market (61.5%) consisting of studios or 1-bedroom units, Borghetto Santo Spirito is particularly well-suited for individuals or couples.
- Listings with 3+ bedrooms (3.3%) represent a smaller niche, potentially indicating an underserved market for larger group accommodations in Borghetto Santo Spirito.
Borghetto Santo Spirito Vacation Rental Guest Capacity Trends (2026)
Distribution of Listings by Guest Capacity
Guest Capacity Insights for Borghetto Santo Spirito
- The most common guest capacity trend in Borghetto Santo Spirito vacation rentals is listings accommodating 4 guests (49.5%). This suggests the primary traveler segment is likely small families or groups.
- Properties designed for 4 guests and 6 guests dominate the Borghetto Santo Spirito STR market, accounting for 73.7% of listings.
- 26.4% of properties accommodate 6+ guests, serving the market segment for larger families or group travel in Borghetto Santo Spirito.
- On average, properties in Borghetto Santo Spirito are equipped to host 4.6 guests.
Borghetto Santo Spirito Airbnb Booking Patterns (2026): Available vs. Booked Days
Available Days Distribution
Booked Days Distribution
Booking Pattern Insights for Borghetto Santo Spirito
- The most common availability pattern in Borghetto Santo Spirito falls within the 271-366 days range, representing 69.2% of listings. This suggests many properties have significant open periods on their calendars.
- Approximately 91.2% of listings show high availability (181+ days open annually), indicating potential for increased bookings or specific owner usage patterns.
- For booked days, the 31-90 days range is most frequent in Borghetto Santo Spirito (47.3%), reflecting common guest stay durations or potential owner blocking patterns.
- A notable 9.9% of properties secure long booking periods (181+ days booked per year), highlighting successful long-term rental strategies or significant owner usage.
Borghetto Santo Spirito Airbnb Minimum Stay Requirements Analysis
Distribution of Listings by Minimum Night Requirement
1 Night
8 listings
8.8% of total
2 Nights
10 listings
11% of total
3 Nights
7 listings
7.7% of total
4-6 Nights
10 listings
11% of total
7-29 Nights
6 listings
6.6% of total
30+ Nights
50 listings
54.9% of total
Key Insights
- The most prevalent minimum stay requirement in Borghetto Santo Spirito is 30+ Nights, adopted by 54.9% of listings. This highlights the market's preference for longer commitments.
- Very short stays (1-2 nights) are less common (19.8%), suggesting hosts prefer slightly longer bookings to optimize turnover.
- A significant segment (54.9%) caters to monthly stays (30+ nights) in Borghetto Santo Spirito, pointing to opportunities in the extended-stay market.
Recommendations
- Align with the market by considering a 30+ Nights minimum stay, as 54.9% of Borghetto Santo Spirito hosts use this setting.
- If feasible, allowing 1-night stays, especially midweek or during low season, could capture last-minute bookings, as only 8.8% currently do.
- Explore offering discounts for stays of 30+ nights to attract the 54.9% of the market seeking extended stays.
- Adjust minimum nights based on seasonality – potentially shorter during low season and longer during peak demand periods in Borghetto Santo Spirito.
Borghetto Santo Spirito Airbnb Cancellation Policy Trends Analysis (2026)
Limited
2 listings
2.2% of total
Super Strict 30 Days
9 listings
9.9% of total
Super Strict 60 Days
1 listings
1.1% of total
Flexible
17 listings
18.7% of total
Moderate
46 listings
50.5% of total
Firm
13 listings
14.3% of total
Strict
3 listings
3.3% of total
Cancellation Policy Insights for Borghetto Santo Spirito
- The prevailing Airbnb cancellation policy trend in Borghetto Santo Spirito is Moderate, used by 50.5% of listings.
- There's a relatively balanced mix between guest-friendly (69.2%) and stricter (17.6%) policies, offering choices for different guest needs.
- Strict cancellation policies are quite rare (3.3%), potentially making listings with this policy less competitive unless justified by high demand or property type.
Recommendations for Hosts
- Consider adopting a Moderate policy to align with the 50.5% market standard in Borghetto Santo Spirito.
- Using a Strict policy might deter some guests, as only 3.3% of listings use it. Evaluate if potential revenue protection outweighs possible lower booking rates.
- Regularly review your cancellation policy against competitors and market demand shifts in Borghetto Santo Spirito.
Borghetto Santo Spirito STR Booking Lead Time Analysis (2026)
Average Booking Lead Time by Month
Booking Lead Time Insights for Borghetto Santo Spirito
- The overall average booking lead time for vacation rentals in Borghetto Santo Spirito is 41 days.
- Guests book furthest in advance for stays during August (average 76 days), likely coinciding with peak travel demand or local events.
- The shortest booking windows occur for stays in February (average 10 days), indicating more last-minute travel plans during this time.
- Seasonally, Summer (61 days avg.) sees the longest lead times, while Winter (23 days avg.) has the shortest, reflecting typical travel planning cycles.
Recommendations for Hosts
- Use the overall average lead time (41 days) as a baseline for your pricing and availability strategy in Borghetto Santo Spirito.
- For August stays, consider implementing length-of-stay discounts or slightly higher rates for bookings made less than 76 days out to capitalize on advance planning.
- During February, focus on last-minute booking availability and promotions, as guests book with very short notice (10 days avg.).
- Target marketing efforts for the Summer season well in advance (at least 61 days) to capture early planners.
- Monitor your own booking lead times against these Borghetto Santo Spirito averages to identify opportunities for dynamic pricing adjustments.
Popular & Essential Airbnb Amenities in Borghetto Santo Spirito (2026)
Amenity Prevalence
Amenity Insights for Borghetto Santo Spirito
- Essential amenities in Borghetto Santo Spirito that guests expect include: Kitchen, TV, Washer. Lacking these (any) could significantly impact bookings.
- Popular amenities like Dishes and silverware, Hair dryer, Hot water are common but not universal. Offering these can provide a competitive edge.
Recommendations for Hosts
- Ensure your listing includes all essential amenities for Borghetto Santo Spirito: Kitchen, TV, Washer.
- Prioritize adding missing essentials: Kitchen, TV, Washer.
- Consider adding popular differentiators like Dishes and silverware or Hair dryer to increase appeal.
- Highlight unique or less common amenities you offer (e.g., hot tub, dedicated workspace, EV charger) in your listing description and photos.
- Regularly check competitor amenities in Borghetto Santo Spirito to stay competitive.
Borghetto Santo Spirito Airbnb Guest Demographics & Profile Analysis (2026)
Guest Profile Summary for Borghetto Santo Spirito
- The typical guest profile for Airbnb in Borghetto Santo Spirito consists of a mix of domestic (64%) and international guests, often arriving from nearby Turin, typically belonging to the Post-2000s (Gen Z/Alpha) group (50%), primarily speaking English or Italian.
- Domestic travelers account for 63.8% of guests.
- Key international markets include Italy (63.8%) and France (9.5%).
- Top languages spoken are English (30.6%) followed by Italian (27.9%).
- A significant demographic segment is the Post-2000s (Gen Z/Alpha) group, representing 50% of guests.
Recommendations for Hosts
- Target domestic marketing efforts towards travelers from Turin and Milan.
- Tailor amenities and listing descriptions to appeal to the dominant Post-2000s (Gen Z/Alpha) demographic (e.g., highlight fast WiFi, smart home features, local guides).
- Highlight unique local experiences or amenities relevant to the primary guest profile.
- Consider seasonal promotions aligned with peak travel times for key origin markets.
Nearby Short-Term Rental Market Comparison
How does the Borghetto Santo Spirito Airbnb market stack up against its neighbors? Compare key performance metrics like average monthly revenue, ADR, and occupancy rates in surrounding areas to understand the broader regional STR landscape.
| Market | Active Properties | Monthly Revenue | Daily Rate | Avg. Occupancy |
|---|---|---|---|---|
| Ranco | 12 | $5,691 | $536.46 | 42% |
| Monteu Roero | 12 | $5,184 | $403.07 | 41% |
| Laglio | 64 | $4,334 | $518.58 | 43% |
| Saint-Jean-Cap-Ferrat | 114 | $3,894 | $465.00 | 44% |
| Cassinasco | 19 | $3,887 | $718.39 | 40% |
| Cossano Belbo | 15 | $3,763 | $326.53 | 36% |
| Portofino | 77 | $3,585 | $509.42 | 38% |
| Bellagio | 461 | $3,466 | $325.87 | 49% |
| Vico Morcote | 12 | $3,347 | $317.07 | 46% |
| Sala Comacina | 73 | $3,332 | $451.20 | 46% |