Ceriale Airbnb Market Analysis 2026: Short Term Rental Data & Vacation Rental Statistics in Liguria, Italy
Is Airbnb profitable in Ceriale in 2026? Explore comprehensive Airbnb analytics for Ceriale, Liguria, Italy to uncover income potential. This 2026 STR market report for Ceriale, based on AirROI data from February 2025 to January 2026, reveals key trends in the niche market of 94 active listings.
Whether you're considering an Airbnb investment in Ceriale, optimizing your existing vacation rental, or exploring rental arbitrage opportunities, understanding the Ceriale Airbnb data is crucial. Navigating the high regulation landscape is key to maximizing your short term rental income potential. Let's dive into the specifics.
Key Ceriale Airbnb Performance Metrics Overview
Monthly Airbnb Revenue Variations & Income Potential in Ceriale (2026)
Understanding the monthly revenue variations for Airbnb listings in Ceriale is key to maximizing your short term rental income potential. Seasonality significantly impacts earnings. Our analysis, based on data from the past 12 months, shows that the peak revenue month for STRs in Ceriale is typically August, while January often presents the lowest earnings, highlighting opportunities for strategic pricing adjustments during shoulder and low seasons. Explore the typical Airbnb income in Ceriale across different performance tiers:
- Best-in-class properties (Top 10%) achieve $2,815+ monthly, often utilizing dynamic pricing and superior guest experiences.
- Strong performing properties (Top 25%) earn $1,963 or more, indicating effective management and desirable locations/amenities.
- Typical properties (Median) generate around $1,190 per month, representing the average market performance.
- Entry-level properties (Bottom 25%) see earnings around $626, often with potential for optimization.
Average Monthly Airbnb Earnings Trend in Ceriale
Ceriale Airbnb Occupancy Rate Trends (2026)
Maximize your bookings by understanding the Ceriale STR occupancy trends. Seasonal demand shifts significantly influence how often properties are booked. Typically, Augustsees the highest demand (peak season occupancy), while January experiences the lowest (low season). Effective strategies, like adjusting minimum stays or offering promotions, can boost occupancy during slower periods. Here's how different property tiers perform in Ceriale:
- Best-in-class properties (Top 10%) achieve 69%+ occupancy, indicating high desirability and potentially optimized availability.
- Strong performing properties (Top 25%) maintain 50% or higher occupancy, suggesting good market fit and guest satisfaction.
- Typical properties (Median) have an occupancy rate around 31%.
- Entry-level properties (Bottom 25%) average 16% occupancy, potentially facing higher vacancy.
Average Monthly Occupancy Rate Trend in Ceriale
Average Daily Rate (ADR) Airbnb Trends in Ceriale (2026)
Effective short term rental pricing strategy in Ceriale involves understanding monthly ADR fluctuations. The Average Daily Rate (ADR) for Airbnb in Ceriale typically peaks in August and dips lowest during March. Leveraging Airbnb dynamic pricing tools or strategies based on this seasonality can significantly boost revenue. Here's a look at the typical nightly rates achieved:
- Best-in-class properties (Top 10%) command rates of $200+ per night, often due to premium features or locations.
- Strong performing properties (Top 25%) achieve nightly rates of $153 or more.
- Typical properties (Median) charge around $117 per night.
- Entry-level properties (Bottom 25%) earn around $93 per night.
Average Daily Rate (ADR) Trend by Month in Ceriale
Get Live Ceriale Market Intelligence 👇

Explore Real-time Analytics
Airbnb Seasonality Analysis & Trends in Ceriale (2026)
Peak Season (August, July, October)
- Revenue averages $2,715 per month
- Occupancy rates average 52.1%
- Daily rates average $155
Shoulder Season
- Revenue averages $1,272 per month
- Occupancy maintains around 33.2%
- Daily rates hold near $141
Low Season (January, February, May)
- Revenue drops to average $747 per month
- Occupancy decreases to average 21.6%
- Daily rates adjust to average $140
Seasonality Insights for Ceriale
- The Airbnb seasonality in Ceriale shows highly seasonal trends requiring careful strategy. While the sections above show seasonal averages, it's also insightful to look at the extremes:
- During the high season, the absolute peak month showcases Ceriale's highest earning potential, with monthly revenues capable of climbing to $3,433, occupancy reaching a high of 69.3%, and ADRs peaking at $158.
- Conversely, the slowest single month of the year, typically falling within the low season, marks the market's lowest point. In this month, revenue might dip to $633, occupancy could drop to 17.2%, and ADRs may adjust down to $129.
- Understanding both the seasonal averages and these monthly peaks and troughs in revenue, occupancy, and ADR is crucial for maximizing your Airbnb profit potential in Ceriale.
Seasonal Strategies for Maximizing Profit
- Peak Season: Maximize revenue through premium pricing and potentially longer minimum stays. Ensure high availability.
- Low Season: Offer competitive pricing, special promotions (e.g., extended stay discounts), and flexible cancellation policies. Target off-season travelers like remote workers or budget-conscious guests.
- Shoulder Seasons: Implement dynamic pricing that balances peak and low rates. Target weekend travelers or specific events. Offer slightly more flexible terms than peak season.
- Regularly analyze your own performance against these Ceriale seasonality benchmarks and adjust your pricing and availability strategy accordingly.
Best Areas for Airbnb Investment in Ceriale (2026)
Exploring the top neighborhoods for short-term rentals in Ceriale? This section highlights key areas, outlining why they are attractive for hosts and guests, along with notable local attractions. Consider these locations based on your target guest profile and investment strategy.
| Neighborhood / Area | Why Host Here? (Target Guests & Appeal) | Key Attractions & Landmarks |
|---|---|---|
| Ceriale Beach | The main attraction for visitors, Ceriale Beach offers beautiful sandy stretches and clear waters, perfect for a relaxing holiday by the sea. | Ceriale Beach, La Caletta Beach, Baia del Sole, Sunset Market |
| Town Center | The historic center of Ceriale is charming with local shops, restaurants, and cafes. Visitors enjoy the authentic Italian atmosphere and easy access to services. | Piazza San Giovanni, San Giovanni Battista Church, Local eateries, Artisan shops |
| Ceriale Nature Reserve | For those who love nature, this reserve offers hiking trails and views of the Ligurian coastline, attracting eco-tourists and nature enthusiasts. | Ceriale Nature Reserve, Hiking trails, Scenic overlook points |
| Capo Torre | This scenic area offers stunning views of the coastline and is popular with walkers and photographers, great for attracting guests looking for a quiet getaway. | Capo Torre viewpoint, Coastal walking paths, Photography spots |
| Close to Albenga | Nearby Albenga is known for its medieval history and architecture, drawing tourists interested in culture and history. It’s a short trip from Ceriale. | Albenga's historic center, Roman ruins, Museo Navale, Beaches of Albenga |
| Local Wine Country | Ceriale is near several vineyards and wine producers, which draws wine enthusiasts eager to explore local wines and tastings. | Local vineyards, Wine tours, Tastings and events |
| Aquarium of Ceriale | A popular family-friendly attraction, this aquarium provides educational experiences and entertainment for children and adults alike, great for family stays. | Aquarium of Ceriale, Interactive exhibits, Children's play area |
| Nearby Hiking Trails | The surrounding hills have numerous hiking trails that offer beautiful landscapes, appealing to adventure tourists and those seeking outdoor activities. | Hiking trails, Panoramic views, Biking routes |
Understanding Airbnb License Requirements & STR Laws in Ceriale (2026)
Yes, Ceriale, Liguria, Italy enforces high STR regulations. Obtaining a license and ensuring compliance is almost certainly required according to current 2026 STR laws. Always verify the latest short term rental regulations and Airbnb license requirements directly with local government authorities for Ceriale to ensure full compliance before hosting.
(Source: AirROI data, 2026, based on 83% licensed listings)
Top Performing Airbnb Properties in Ceriale (2026)
Benchmark your potential! Explore examples of top-performing Airbnb properties in Cerialebased on Trailing Twelve Month (TTM) revenue. Analyze their characteristics, revenue, occupancy rate, and ADR to understand what drives success in this market.
![[Box and A/C] Relax just four minutes from the sea](https://a0.muscache.com/im/pictures/miso/Hosting-683357579787696923/original/20694a45-3ef7-4706-aba7-20d428abfcad.png?im_w=480&im_format=avif)
[Box and A/C] Relax just four minutes from the sea
Entire Place • 2 bedrooms
Les Voiles – Trilocale sul mare
Entire Place • 2 bedrooms
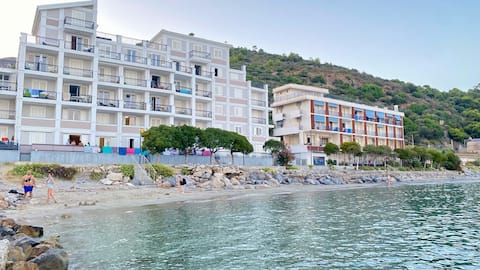
![[Sea View and Garage] New Construction](https://a0.muscache.com/im/pictures/hosting/Hosting-U3RheVN1cHBseUxpc3Rpbmc6MTQ0NDE4MTUxMTMyMTgxNTA4OA==/original/4d704be3-b49c-4b1f-ae4e-f8b917c5c4fa.png?im_w=480&im_format=avif)
[Sea View and Garage] New Construction
Entire Place • 2 bedrooms
Stunning new apartment on the beach
Entire Place • 1 bedroom

Casa La Perla - Terrace with view + Free Parking
Entire Place • 1 bedroom
![[150 m from the sea] 3-room flat with 2 bathrooms.](https://a0.muscache.com/im/pictures/miso/Hosting-1394133812827104628/original/55112d84-7484-46d4-9f2b-9a0ed40ac15a.jpeg?im_w=480&im_format=avif)
[150 m from the sea] 3-room flat with 2 bathrooms.
Entire Place • 2 bedrooms
Note: Performance varies based on location, size, amenities, seasonality, and management quality. Data reflects the past 12 months.
Top Performing Airbnb Hosts in Ceriale (2026)
Learn from the best! This table showcases top-performing Airbnb hosts in Ceriale based on the number of properties managed and estimated total revenue over the past year. Analyze their scale and performance metrics.
| Host Name | Properties | Grossing Revenue | Stay Reviews | Avg Rating |
|---|---|---|---|---|
| Loyals Srl | 4 | $117,938 | 61 | 4.85/5.0 |
| Sabia Estate | 4 | $58,640 | 61 | 4.54/5.0 |
| Nicole | 1 | $53,803 | 42 | 4.88/5.0 |
| Giuseppina | 3 | $42,287 | 150 | 4.79/5.0 |
| Pamela - Interhome | 3 | $33,217 | 4 | Not Rated |
| Laura | 2 | $29,897 | 96 | 4.92/5.0 |
| Alan | 1 | $25,207 | 17 | 5.00/5.0 |
| Anthony | 2 | $24,285 | 2 | Not Rated |
| Andrea | 1 | $23,603 | 25 | 4.84/5.0 |
| Italianway | 1 | $20,858 | 7 | 4.14/5.0 |
Analyzing the strategies of top hosts, such as their property selection, pricing, and guest communication, can offer valuable lessons for optimizing your own Airbnb operations in Ceriale.
Dive Deeper: Advanced Ceriale STR Market Data (2026)
Ready to unlock more insights? AirROI provides access to advanced metrics and comprehensive Airbnb data for Ceriale. Explore detailed analytics beyond this report to refine your investment strategy, optimize pricing, and maximize your vacation rental profits.
Explore Advanced MetricsCeriale Short-Term Rental Market Composition (2026): Property & Room Types
Room Type Distribution
Property Type Distribution
Market Composition Insights for Ceriale
- The Ceriale Airbnb market composition is heavily skewed towards Entire Home/Apt listings, which make up 95.7% of the 94 active rentals. This indicates strong guest preference for privacy and space.
- Looking at the property type distribution in Ceriale, Apartment/Condo properties are the most common (80.9%), reflecting the local real estate landscape.
- Houses represent a significant 16% portion, catering likely to families or larger groups.
- Smaller segments like hotel/boutique (combined 3.2%) offer potential for unique stay experiences.
Ceriale Airbnb Room Capacity Analysis (2026): Bedroom Distribution
Distribution of Listings by Number of Bedrooms
Room Capacity Insights for Ceriale
- The dominant room capacity in Ceriale is 1 bedroom listings, making up 59.6% of the market. This suggests a strong demand for properties suitable for couples or solo travelers.
- Together, 1 bedroom and 2 bedrooms properties represent 90.5% of the active Airbnb listings in Ceriale, indicating a high concentration in these sizes.
- With over half the market (59.6%) consisting of studios or 1-bedroom units, Ceriale is particularly well-suited for individuals or couples.
- Listings with 3+ bedrooms (4.3%) represent a smaller niche, potentially indicating an underserved market for larger group accommodations in Ceriale.
Ceriale Vacation Rental Guest Capacity Trends (2026)
Distribution of Listings by Guest Capacity
Guest Capacity Insights for Ceriale
- The most common guest capacity trend in Ceriale vacation rentals is listings accommodating 4 guests (47.9%). This suggests the primary traveler segment is likely small families or groups.
- Properties designed for 4 guests and 6 guests dominate the Ceriale STR market, accounting for 66.0% of listings.
- 21.3% of properties accommodate 6+ guests, serving the market segment for larger families or group travel in Ceriale.
- On average, properties in Ceriale are equipped to host 4.3 guests.
Ceriale Airbnb Booking Patterns (2026): Available vs. Booked Days
Available Days Distribution
Booked Days Distribution
Booking Pattern Insights for Ceriale
- The most common availability pattern in Ceriale falls within the 271-366 days range, representing 68.1% of listings. This suggests many properties have significant open periods on their calendars.
- Approximately 92.6% of listings show high availability (181+ days open annually), indicating potential for increased bookings or specific owner usage patterns.
- For booked days, the 31-90 days range is most frequent in Ceriale (36.2%), reflecting common guest stay durations or potential owner blocking patterns.
- A notable 8.5% of properties secure long booking periods (181+ days booked per year), highlighting successful long-term rental strategies or significant owner usage.
Ceriale Airbnb Minimum Stay Requirements Analysis
Distribution of Listings by Minimum Night Requirement
1 Night
5 listings
5.3% of total
2 Nights
7 listings
7.4% of total
3 Nights
4 listings
4.3% of total
4-6 Nights
17 listings
18.1% of total
7-29 Nights
9 listings
9.6% of total
30+ Nights
52 listings
55.3% of total
Key Insights
- The most prevalent minimum stay requirement in Ceriale is 30+ Nights, adopted by 55.3% of listings. This highlights the market's preference for longer commitments.
- Very short stays (1-2 nights) are less common (12.7%), suggesting hosts prefer slightly longer bookings to optimize turnover.
- A significant segment (55.3%) caters to monthly stays (30+ nights) in Ceriale, pointing to opportunities in the extended-stay market.
Recommendations
- Align with the market by considering a 30+ Nights minimum stay, as 55.3% of Ceriale hosts use this setting.
- If feasible, allowing 1-night stays, especially midweek or during low season, could capture last-minute bookings, as only 5.3% currently do.
- Explore offering discounts for stays of 30+ nights to attract the 55.3% of the market seeking extended stays.
- Adjust minimum nights based on seasonality – potentially shorter during low season and longer during peak demand periods in Ceriale.
Ceriale Airbnb Cancellation Policy Trends Analysis (2026)
Super Strict 30 Days
2 listings
2.1% of total
Flexible
19 listings
20.2% of total
Moderate
44 listings
46.8% of total
Firm
22 listings
23.4% of total
Strict
7 listings
7.4% of total
Cancellation Policy Insights for Ceriale
- The prevailing Airbnb cancellation policy trend in Ceriale is Moderate, used by 46.8% of listings.
- There's a relatively balanced mix between guest-friendly (67.0%) and stricter (30.8%) policies, offering choices for different guest needs.
- Strict cancellation policies are quite rare (7.4%), potentially making listings with this policy less competitive unless justified by high demand or property type.
Recommendations for Hosts
- Consider adopting a Moderate policy to align with the 46.8% market standard in Ceriale.
- Using a Strict policy might deter some guests, as only 7.4% of listings use it. Evaluate if potential revenue protection outweighs possible lower booking rates.
- Regularly review your cancellation policy against competitors and market demand shifts in Ceriale.
Ceriale STR Booking Lead Time Analysis (2026)
Average Booking Lead Time by Month
Booking Lead Time Insights for Ceriale
- The overall average booking lead time for vacation rentals in Ceriale is 50 days.
- Guests book furthest in advance for stays during August (average 103 days), likely coinciding with peak travel demand or local events.
- The shortest booking windows occur for stays in November (average 15 days), indicating more last-minute travel plans during this time.
- Seasonally, Summer (73 days avg.) sees the longest lead times, while Winter (23 days avg.) has the shortest, reflecting typical travel planning cycles.
Recommendations for Hosts
- Use the overall average lead time (50 days) as a baseline for your pricing and availability strategy in Ceriale.
- For August stays, consider implementing length-of-stay discounts or slightly higher rates for bookings made less than 103 days out to capitalize on advance planning.
- Target marketing efforts for the Summer season well in advance (at least 73 days) to capture early planners.
- Monitor your own booking lead times against these Ceriale averages to identify opportunities for dynamic pricing adjustments.
Popular & Essential Airbnb Amenities in Ceriale (2026)
Amenity Prevalence
Amenity Insights for Ceriale
- Essential amenities in Ceriale that guests expect include: Kitchen. Lacking these (this) could significantly impact bookings.
- Popular amenities like Hot water, TV, Hair dryer are common but not universal. Offering these can provide a competitive edge.
Recommendations for Hosts
- Ensure your listing includes all essential amenities for Ceriale: Kitchen.
- Prioritize adding missing essentials: Kitchen.
- Consider adding popular differentiators like Hot water or TV to increase appeal.
- Highlight unique or less common amenities you offer (e.g., hot tub, dedicated workspace, EV charger) in your listing description and photos.
- Regularly check competitor amenities in Ceriale to stay competitive.
Ceriale Airbnb Guest Demographics & Profile Analysis (2026)
Guest Profile Summary for Ceriale
- The typical guest profile for Airbnb in Ceriale consists of a mix of domestic (57%) and international guests, often arriving from nearby Turin, typically belonging to the Post-2000s (Gen Z/Alpha) group (50%), primarily speaking English or Italian.
- Domestic travelers account for 56.9% of guests.
- Key international markets include Italy (56.9%) and Switzerland (12.2%).
- Top languages spoken are English (31.4%) followed by Italian (19.4%).
- A significant demographic segment is the Post-2000s (Gen Z/Alpha) group, representing 50% of guests.
Recommendations for Hosts
- Balance marketing efforts between domestic and international channels based on the guest mix.
- Tailor amenities and listing descriptions to appeal to the dominant Post-2000s (Gen Z/Alpha) demographic (e.g., highlight fast WiFi, smart home features, local guides).
- Highlight unique local experiences or amenities relevant to the primary guest profile.
- Consider seasonal promotions aligned with peak travel times for key origin markets.
Nearby Short-Term Rental Market Comparison
How does the Ceriale Airbnb market stack up against its neighbors? Compare key performance metrics like average monthly revenue, ADR, and occupancy rates in surrounding areas to understand the broader regional STR landscape.
| Market | Active Properties | Monthly Revenue | Daily Rate | Avg. Occupancy |
|---|---|---|---|---|
| Ranco | 12 | $5,691 | $536.46 | 42% |
| Monteu Roero | 12 | $5,184 | $403.07 | 41% |
| Laglio | 64 | $4,334 | $518.58 | 43% |
| Saint-Jean-Cap-Ferrat | 114 | $3,894 | $465.00 | 44% |
| Cassinasco | 19 | $3,887 | $718.39 | 40% |
| Cossano Belbo | 15 | $3,763 | $326.53 | 36% |
| Portofino | 77 | $3,585 | $509.42 | 38% |
| Bellagio | 461 | $3,466 | $325.87 | 49% |
| Vico Morcote | 12 | $3,347 | $317.07 | 46% |
| Sala Comacina | 73 | $3,332 | $451.20 | 46% |