Taggia Airbnb Market Analysis 2026: Short Term Rental Data & Vacation Rental Statistics in Liguria, Italy
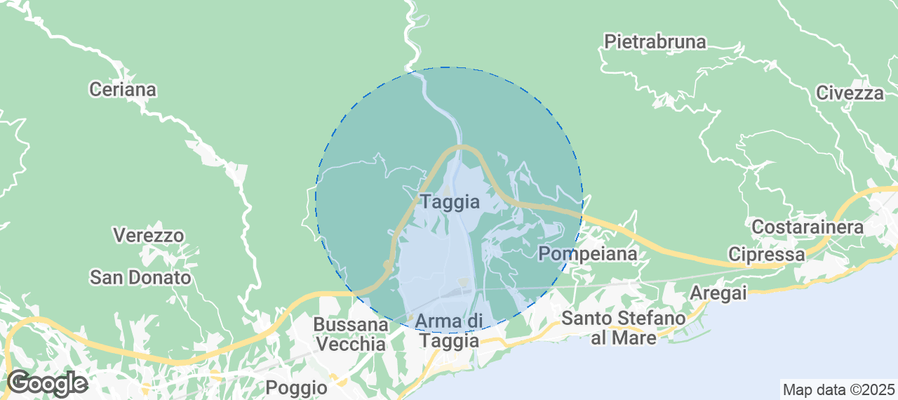
Is Airbnb profitable in Taggia in 2026? Explore comprehensive Airbnb analytics for Taggia, Liguria, Italy to uncover income potential. This 2026 STR market report for Taggia, based on AirROI data from February 2025 to January 2026, reveals key trends in the niche market of 20 active listings.
Whether you're considering an Airbnb investment in Taggia, optimizing your existing vacation rental, or exploring rental arbitrage opportunities, understanding the Taggia Airbnb data is crucial. Navigating the high regulation landscape is key to maximizing your short term rental income potential. Let's dive into the specifics.
Key Taggia Airbnb Performance Metrics Overview
Monthly Airbnb Revenue Variations & Income Potential in Taggia (2026)
Understanding the monthly revenue variations for Airbnb listings in Taggia is key to maximizing your short term rental income potential. Seasonality significantly impacts earnings. Our analysis, based on data from the past 12 months, shows that the peak revenue month for STRs in Taggia is typically August, while November often presents the lowest earnings, highlighting opportunities for strategic pricing adjustments during shoulder and low seasons. Explore the typical Airbnb income in Taggia across different performance tiers:
- Best-in-class properties (Top 10%) achieve $3,356+ monthly, often utilizing dynamic pricing and superior guest experiences.
- Strong performing properties (Top 25%) earn $2,292 or more, indicating effective management and desirable locations/amenities.
- Typical properties (Median) generate around $1,208 per month, representing the average market performance.
- Entry-level properties (Bottom 25%) see earnings around $684, often with potential for optimization.
Average Monthly Airbnb Earnings Trend in Taggia
Taggia Airbnb Occupancy Rate Trends (2026)
Maximize your bookings by understanding the Taggia STR occupancy trends. Seasonal demand shifts significantly influence how often properties are booked. Typically, Augustsees the highest demand (peak season occupancy), while November experiences the lowest (low season). Effective strategies, like adjusting minimum stays or offering promotions, can boost occupancy during slower periods. Here's how different property tiers perform in Taggia:
- Best-in-class properties (Top 10%) achieve 52%+ occupancy, indicating high desirability and potentially optimized availability.
- Strong performing properties (Top 25%) maintain 41% or higher occupancy, suggesting good market fit and guest satisfaction.
- Typical properties (Median) have an occupancy rate around 26%.
- Entry-level properties (Bottom 25%) average 13% occupancy, potentially facing higher vacancy.
Average Monthly Occupancy Rate Trend in Taggia
Average Daily Rate (ADR) Airbnb Trends in Taggia (2026)
Effective short term rental pricing strategy in Taggia involves understanding monthly ADR fluctuations. The Average Daily Rate (ADR) for Airbnb in Taggia typically peaks in August and dips lowest during October. Leveraging Airbnb dynamic pricing tools or strategies based on this seasonality can significantly boost revenue. Here's a look at the typical nightly rates achieved:
- Best-in-class properties (Top 10%) command rates of $337+ per night, often due to premium features or locations.
- Strong performing properties (Top 25%) achieve nightly rates of $195 or more.
- Typical properties (Median) charge around $150 per night.
- Entry-level properties (Bottom 25%) earn around $105 per night.
Average Daily Rate (ADR) Trend by Month in Taggia
Get Live Taggia Market Intelligence 👇
Explore Real-time Analytics
Airbnb Seasonality Analysis & Trends in Taggia (2026)
Peak Season (August, July, March)
- Revenue averages $2,966 per month
- Occupancy rates average 46.0%
- Daily rates average $209
Shoulder Season
- Revenue averages $1,540 per month
- Occupancy maintains around 29.3%
- Daily rates hold near $178
Low Season (January, May, November)
- Revenue drops to average $520 per month
- Occupancy decreases to average 11.6%
- Daily rates adjust to average $165
Seasonality Insights for Taggia
- The Airbnb seasonality in Taggia shows highly seasonal trends requiring careful strategy. While the sections above show seasonal averages, it's also insightful to look at the extremes:
- During the high season, the absolute peak month showcases Taggia's highest earning potential, with monthly revenues capable of climbing to $3,828, occupancy reaching a high of 56.7%, and ADRs peaking at $234.
- Conversely, the slowest single month of the year, typically falling within the low season, marks the market's lowest point. In this month, revenue might dip to $322, occupancy could drop to 8.7%, and ADRs may adjust down to $159.
- Understanding both the seasonal averages and these monthly peaks and troughs in revenue, occupancy, and ADR is crucial for maximizing your Airbnb profit potential in Taggia.
Seasonal Strategies for Maximizing Profit
- Peak Season: Maximize revenue through premium pricing and potentially longer minimum stays. Ensure high availability.
- Low Season: Offer competitive pricing, special promotions (e.g., extended stay discounts), and flexible cancellation policies. Target off-season travelers like remote workers or budget-conscious guests.
- Shoulder Seasons: Implement dynamic pricing that balances peak and low rates. Target weekend travelers or specific events. Offer slightly more flexible terms than peak season.
- Regularly analyze your own performance against these Taggia seasonality benchmarks and adjust your pricing and availability strategy accordingly.
Best Areas for Airbnb Investment in Taggia (2026)
Exploring the top neighborhoods for short-term rentals in Taggia? This section highlights key areas, outlining why they are attractive for hosts and guests, along with notable local attractions. Consider these locations based on your target guest profile and investment strategy.
| Neighborhood / Area | Why Host Here? (Target Guests & Appeal) | Key Attractions & Landmarks |
|---|---|---|
| Centro Storico | The historic center of Taggia, known for its charming medieval streets, local shops, and authentic cuisine. A prime location for tourists looking to explore the cultural heritage of the region. | Church of San Domenico, Antico Frantoio Sommariva, Piazza della Vittoria, Museo della Città, Via San Dalmazio |
| Sanremo | Nearby Sanremo is famous for its beautiful beaches and the famous Sanremo Music Festival. It attracts tourists year-round and offers vibrant nightlife and shopping. | Casino di Sanremo, Sanremo Music Festival, La Pigna, Victory Morgana Bay, Piazza Colombo |
| Riva Ligure | This lovely seaside village is popular for families and beach lovers, providing a tranquil atmosphere with stunning views and local dining options. | Riva Ligure Beach, Promenade dei Fiori, Restaurants along the coast, Piazza della Libertà |
| Arma di Taggia | A coastal neighborhood with beautiful beaches and a more relaxed vibe. It offers various activities along the waterfront and is ideal for family holidays. | Arma di Taggia Beach, Borgo di Taggia, Local seafood restaurants, Parks along the coast |
| Val Prino | A picturesque valley that offers hiking and outdoor activities. It attracts nature lovers and those looking for a retreat from the hustle and bustle of coastal life. | Hiking trails, Local vineyards, Scenic views, Agriturismi |
| Dolcedo | A short drive from Taggia, this village is known for its beautiful scenery and olive oil production. Great for tourists seeking authenticity and tranquility. | Historic town center, Olive oil tasting, Borgo di Dolcedo, Riverside walks |
| Bussana Vecchia | An artist village known for its bohemian atmosphere and artistic community. This unique location attracts artistic travelers and those seeking inspiration. | Bussana Vecchia ruins, Art studios, Local crafts, Scenic views over the coastline |
| Pietrabruna | A peaceful hillside village surrounded by nature, ideal for tourists seeking hiking, tranquility, and panoramic views of the sea and mountains. | Hiking trails, Beautiful viewpoints, Local architecture, Vineyards and olive groves |
Understanding Airbnb License Requirements & STR Laws in Taggia (2026)
Yes, Taggia, Liguria, Italy enforces high STR regulations. Obtaining a license and ensuring compliance is almost certainly required according to current 2026 STR laws. Always verify the latest short term rental regulations and Airbnb license requirements directly with local government authorities for Taggia to ensure full compliance before hosting.
(Source: AirROI data, 2026, based on 95% licensed listings)
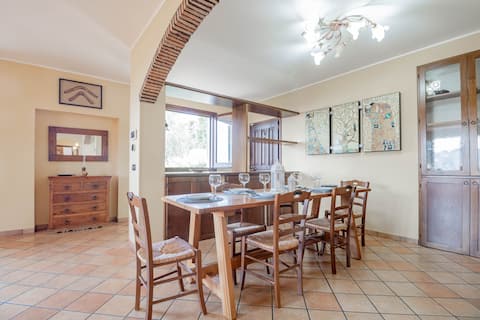
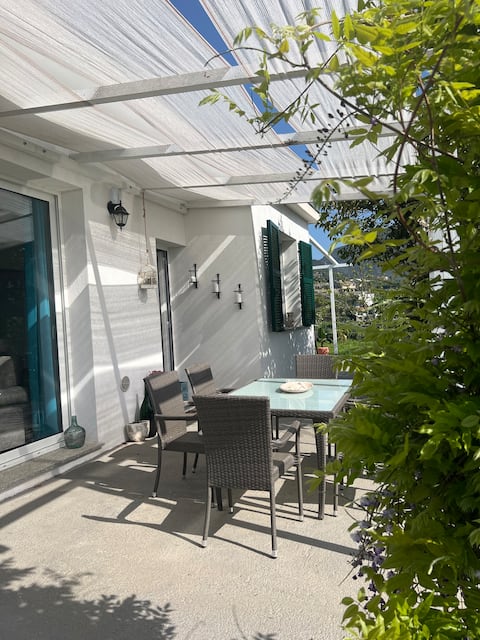
Top Performing Airbnb Properties in Taggia (2026)
Benchmark your potential! Explore examples of top-performing Airbnb properties in Taggiabased on Trailing Twelve Month (TTM) revenue. Analyze their characteristics, revenue, occupancy rate, and ADR to understand what drives success in this market.
𝐇𝟏𝟏 Oasi Serena Parking-Garden
Entire Place • 3 bedrooms
Casa Il Giuggiolo
Entire Place • 2 bedrooms

A step from the Beach - Roomy Apt with Sea Glimpse
Entire Place • 3 bedrooms
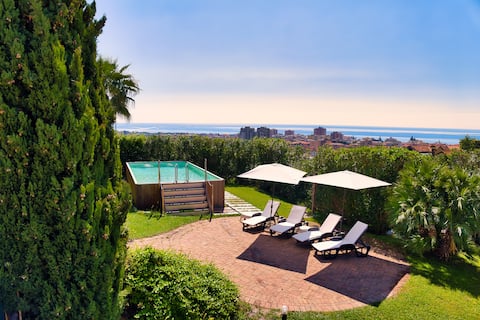
Villa Sabrina with a View and GHM Pool
Entire Place • 4 bedrooms
![Magic Among the Olive Trees [Huge Garden + Pool]](https://a0.muscache.com/im/pictures/hosting/Hosting-U3RheVN1cHBseUxpc3Rpbmc6MTMxODcyNzY4OTIyODAxNDQ2NQ%3D%3D/original/ad253af9-5275-4e22-9845-0fd081928fcc.jpeg?im_w=480&im_format=avif)
Magic Among the Olive Trees [Huge Garden + Pool]
Entire Place • 2 bedrooms

Simone Case Vacanze - At Gina's
Entire Place • 1 bedroom
Note: Performance varies based on location, size, amenities, seasonality, and management quality. Data reflects the past 12 months.
Top Performing Airbnb Hosts in Taggia (2026)
Learn from the best! This table showcases top-performing Airbnb hosts in Taggia based on the number of properties managed and estimated total revenue over the past year. Analyze their scale and performance metrics.
| Host Name | Properties | Grossing Revenue | Stay Reviews | Avg Rating |
|---|---|---|---|---|
| Homeleven S.R.L.S. | 3 | $50,797 | 28 | 4.03/5.0 |
| Sandra - Interhome | 2 | $28,009 | 8 | 4.37/5.0 |
| Lorenza | 1 | $24,372 | 62 | 4.94/5.0 |
| GuestHost - Welcome To Liguria | 1 | $24,248 | 9 | 4.56/5.0 |
| Giulia | 1 | $23,213 | 5 | 5.00/5.0 |
| Chiara | 1 | $20,963 | 16 | 5.00/5.0 |
| Gina | 1 | $17,592 | 1 | Not Rated |
| Holidu | 1 | $16,150 | 1 | Not Rated |
| Immobiliare Rossi | 1 | $14,120 | 2 | Not Rated |
| Scero | 1 | $10,798 | 2 | Not Rated |
Analyzing the strategies of top hosts, such as their property selection, pricing, and guest communication, can offer valuable lessons for optimizing your own Airbnb operations in Taggia.
Dive Deeper: Advanced Taggia STR Market Data (2026)
Ready to unlock more insights? AirROI provides access to advanced metrics and comprehensive Airbnb data for Taggia. Explore detailed analytics beyond this report to refine your investment strategy, optimize pricing, and maximize your vacation rental profits.
Explore Advanced MetricsTaggia Short-Term Rental Market Composition (2026): Property & Room Types
Room Type Distribution
Property Type Distribution
Market Composition Insights for Taggia
- The Taggia Airbnb market composition is heavily skewed towards Entire Home/Apt listings, which make up 95% of the 20 active rentals. This indicates strong guest preference for privacy and space.
- Looking at the property type distribution in Taggia, Apartment/Condo properties are the most common (55%), reflecting the local real estate landscape.
- Houses represent a significant 45% portion, catering likely to families or larger groups.
Taggia Airbnb Room Capacity Analysis (2026): Bedroom Distribution
Distribution of Listings by Number of Bedrooms
Room Capacity Insights for Taggia
- The dominant room capacity in Taggia is 2 bedrooms listings, making up 60% of the market. This suggests a strong demand for properties suitable for couples or solo travelers.
- Together, 2 bedrooms and 1 bedroom properties represent 80.0% of the active Airbnb listings in Taggia, indicating a high concentration in these sizes.
Taggia Vacation Rental Guest Capacity Trends (2026)
Distribution of Listings by Guest Capacity
Guest Capacity Insights for Taggia
- The most common guest capacity trend in Taggia vacation rentals is listings accommodating 6 guests (30%). This suggests the primary traveler segment is likely larger groups.
- Properties designed for 6 guests and 4 guests dominate the Taggia STR market, accounting for 60.0% of listings.
- 45.0% of properties accommodate 6+ guests, serving the market segment for larger families or group travel in Taggia.
- On average, properties in Taggia are equipped to host 5.0 guests.
Taggia Airbnb Booking Patterns (2026): Available vs. Booked Days
Available Days Distribution
Booked Days Distribution
Booking Pattern Insights for Taggia
- The most common availability pattern in Taggia falls within the 271-366 days range, representing 65% of listings. This suggests many properties have significant open periods on their calendars.
- Approximately 100.0% of listings show high availability (181+ days open annually), indicating potential for increased bookings or specific owner usage patterns.
- For booked days, the 31-90 days range is most frequent in Taggia (50%), reflecting common guest stay durations or potential owner blocking patterns.
Taggia Airbnb Minimum Stay Requirements Analysis
Distribution of Listings by Minimum Night Requirement
1 Night
2 listings
10% of total
2 Nights
6 listings
30% of total
4-6 Nights
2 listings
10% of total
7-29 Nights
1 listings
5% of total
30+ Nights
9 listings
45% of total
Key Insights
- The most prevalent minimum stay requirement in Taggia is 30+ Nights, adopted by 45% of listings. This highlights the market's preference for longer commitments.
- A significant segment (45%) caters to monthly stays (30+ nights) in Taggia, pointing to opportunities in the extended-stay market.
Recommendations
- Align with the market by considering a 30+ Nights minimum stay, as 45% of Taggia hosts use this setting.
- If feasible, allowing 1-night stays, especially midweek or during low season, could capture last-minute bookings, as only 10% currently do.
- Explore offering discounts for stays of 30+ nights to attract the 45% of the market seeking extended stays.
- Adjust minimum nights based on seasonality – potentially shorter during low season and longer during peak demand periods in Taggia.
Taggia Airbnb Cancellation Policy Trends Analysis (2026)
Super Strict 60 Days
3 listings
15% of total
Flexible
2 listings
10% of total
Moderate
12 listings
60% of total
Firm
3 listings
15% of total
Cancellation Policy Insights for Taggia
- The prevailing Airbnb cancellation policy trend in Taggia is Moderate, used by 60% of listings.
- There's a relatively balanced mix between guest-friendly (70.0%) and stricter (15.0%) policies, offering choices for different guest needs.
Recommendations for Hosts
- Consider adopting a Moderate policy to align with the 60% market standard in Taggia.
- Regularly review your cancellation policy against competitors and market demand shifts in Taggia.
Taggia STR Booking Lead Time Analysis (2026)
Average Booking Lead Time by Month
Booking Lead Time Insights for Taggia
- The overall average booking lead time for vacation rentals in Taggia is 23 days.
- Guests book furthest in advance for stays during August (average 40 days), likely coinciding with peak travel demand or local events.
- The shortest booking windows occur for stays in November (average 12 days), indicating more last-minute travel plans during this time.
- Seasonally, Summer (29 days avg.) sees the longest lead times, while Spring (19 days avg.) has the shortest, reflecting typical travel planning cycles.
Recommendations for Hosts
- Use the overall average lead time (23 days) as a baseline for your pricing and availability strategy in Taggia.
- For August stays, consider implementing length-of-stay discounts or slightly higher rates for bookings made less than 40 days out to capitalize on advance planning.
- During November, focus on last-minute booking availability and promotions, as guests book with very short notice (12 days avg.).
- Target marketing efforts for the Summer season well in advance (at least 29 days) to capture early planners.
- Monitor your own booking lead times against these Taggia averages to identify opportunities for dynamic pricing adjustments.
Popular & Essential Airbnb Amenities in Taggia (2026)
Amenity Prevalence
Amenity Insights for Taggia
- Popular amenities like Washer, Wifi, Kitchen are common but not universal. Offering these can provide a competitive edge.
- Warning: Wifi is not universally provided but is considered essential globally. Ensure reliable Wifi is offered.
Recommendations for Hosts
- Consider adding popular differentiators like Washer or Wifi to increase appeal.
- Highlight unique or less common amenities you offer (e.g., hot tub, dedicated workspace, EV charger) in your listing description and photos.
- Regularly check competitor amenities in Taggia to stay competitive.
Taggia Airbnb Guest Demographics & Profile Analysis (2026)
Guest Profile Summary for Taggia
- The typical guest profile for Airbnb in Taggia consists of predominantly international visitors (67%), with top international origins including Italy, typically belonging to the Post-2000s (Gen Z/Alpha) group (50%), primarily speaking English or French.
- Domestic travelers account for 33.3% of guests.
- Key international markets include France (36.7%) and Italy (33.3%).
- Top languages spoken are English (29.7%) followed by French (21.6%).
- A significant demographic segment is the Post-2000s (Gen Z/Alpha) group, representing 50% of guests.
Recommendations for Hosts
- Focus marketing internationally, particularly towards travelers from Italy.
- Tailor amenities and listing descriptions to appeal to the dominant Post-2000s (Gen Z/Alpha) demographic (e.g., highlight fast WiFi, smart home features, local guides).
- Highlight unique local experiences or amenities relevant to the primary guest profile.
- Consider seasonal promotions aligned with peak travel times for key origin markets.
Nearby Short-Term Rental Market Comparison
How does the Taggia Airbnb market stack up against its neighbors? Compare key performance metrics like average monthly revenue, ADR, and occupancy rates in surrounding areas to understand the broader regional STR landscape.
| Market | Active Properties | Monthly Revenue | Daily Rate | Avg. Occupancy |
|---|---|---|---|---|
| Monteu Roero | 12 | $5,184 | $403.07 | 41% |
| Ramatuelle | 231 | $4,086 | $662.31 | 40% |
| Saint-Jean-Cap-Ferrat | 114 | $3,894 | $465.00 | 44% |
| Cassinasco | 19 | $3,887 | $718.39 | 40% |
| Cossano Belbo | 15 | $3,763 | $326.53 | 36% |
| Saint-Tropez | 847 | $3,591 | $514.76 | 39% |
| Monaco | 193 | $3,208 | $490.13 | 36% |
| Opio | 41 | $3,101 | $542.89 | 41% |
| Villefranche-sur-Mer | 494 | $3,095 | $295.76 | 50% |
| Tourrettes-sur-Loup | 168 | $3,021 | $399.67 | 44% |