Veravo Airbnb Market Analysis 2026: Short Term Rental Data & Vacation Rental Statistics in Liguria, Italy
Is Airbnb profitable in Veravo in 2026? Explore comprehensive Airbnb analytics for Veravo, Liguria, Italy to uncover income potential. This 2026 STR market report for Veravo, based on AirROI data from February 2025 to January 2026, reveals key trends in the niche market of 43 active listings.
Whether you're considering an Airbnb investment in Veravo, optimizing your existing vacation rental, or exploring rental arbitrage opportunities, understanding the Veravo Airbnb data is crucial. Navigating the high regulation landscape is key to maximizing your short term rental income potential. Let's dive into the specifics.
Key Veravo Airbnb Performance Metrics Overview
Monthly Airbnb Revenue Variations & Income Potential in Veravo (2026)
Understanding the monthly revenue variations for Airbnb listings in Veravo is key to maximizing your short term rental income potential. Seasonality significantly impacts earnings. Our analysis, based on data from the past 12 months, shows that the peak revenue month for STRs in Veravo is typically August, while January often presents the lowest earnings, highlighting opportunities for strategic pricing adjustments during shoulder and low seasons. Explore the typical Airbnb income in Veravo across different performance tiers:
- Best-in-class properties (Top 10%) achieve $2,456+ monthly, often utilizing dynamic pricing and superior guest experiences.
- Strong performing properties (Top 25%) earn $1,634 or more, indicating effective management and desirable locations/amenities.
- Typical properties (Median) generate around $852 per month, representing the average market performance.
- Entry-level properties (Bottom 25%) see earnings around $542, often with potential for optimization.
Average Monthly Airbnb Earnings Trend in Veravo
Veravo Airbnb Occupancy Rate Trends (2026)
Maximize your bookings by understanding the Veravo STR occupancy trends. Seasonal demand shifts significantly influence how often properties are booked. Typically, Augustsees the highest demand (peak season occupancy), while January experiences the lowest (low season). Effective strategies, like adjusting minimum stays or offering promotions, can boost occupancy during slower periods. Here's how different property tiers perform in Veravo:
- Best-in-class properties (Top 10%) achieve 57%+ occupancy, indicating high desirability and potentially optimized availability.
- Strong performing properties (Top 25%) maintain 44% or higher occupancy, suggesting good market fit and guest satisfaction.
- Typical properties (Median) have an occupancy rate around 25%.
- Entry-level properties (Bottom 25%) average 14% occupancy, potentially facing higher vacancy.
Average Monthly Occupancy Rate Trend in Veravo
Average Daily Rate (ADR) Airbnb Trends in Veravo (2026)
Effective short term rental pricing strategy in Veravo involves understanding monthly ADR fluctuations. The Average Daily Rate (ADR) for Airbnb in Veravo typically peaks in August and dips lowest during March. Leveraging Airbnb dynamic pricing tools or strategies based on this seasonality can significantly boost revenue. Here's a look at the typical nightly rates achieved:
- Best-in-class properties (Top 10%) command rates of $244+ per night, often due to premium features or locations.
- Strong performing properties (Top 25%) achieve nightly rates of $202 or more.
- Typical properties (Median) charge around $135 per night.
- Entry-level properties (Bottom 25%) earn around $98 per night.
Average Daily Rate (ADR) Trend by Month in Veravo
Get Live Veravo Market Intelligence 👇

Explore Real-time Analytics
Airbnb Seasonality Analysis & Trends in Veravo (2026)
Peak Season (August, July, October)
- Revenue averages $2,064 per month
- Occupancy rates average 44.1%
- Daily rates average $154
Shoulder Season
- Revenue averages $946 per month
- Occupancy maintains around 26.4%
- Daily rates hold near $148
Low Season (January, February, May)
- Revenue drops to average $657 per month
- Occupancy decreases to average 21.3%
- Daily rates adjust to average $147
Seasonality Insights for Veravo
- The Airbnb seasonality in Veravo shows highly seasonal trends requiring careful strategy. While the sections above show seasonal averages, it's also insightful to look at the extremes:
- During the high season, the absolute peak month showcases Veravo's highest earning potential, with monthly revenues capable of climbing to $2,543, occupancy reaching a high of 53.8%, and ADRs peaking at $158.
- Conversely, the slowest single month of the year, typically falling within the low season, marks the market's lowest point. In this month, revenue might dip to $549, occupancy could drop to 13.8%, and ADRs may adjust down to $139.
- Understanding both the seasonal averages and these monthly peaks and troughs in revenue, occupancy, and ADR is crucial for maximizing your Airbnb profit potential in Veravo.
Seasonal Strategies for Maximizing Profit
- Peak Season: Maximize revenue through premium pricing and potentially longer minimum stays. Ensure high availability.
- Low Season: Offer competitive pricing, special promotions (e.g., extended stay discounts), and flexible cancellation policies. Target off-season travelers like remote workers or budget-conscious guests.
- Shoulder Seasons: Implement dynamic pricing that balances peak and low rates. Target weekend travelers or specific events. Offer slightly more flexible terms than peak season.
- Regularly analyze your own performance against these Veravo seasonality benchmarks and adjust your pricing and availability strategy accordingly.
Best Areas for Airbnb Investment in Veravo (2026)
Exploring the top neighborhoods for short-term rentals in Veravo? This section highlights key areas, outlining why they are attractive for hosts and guests, along with notable local attractions. Consider these locations based on your target guest profile and investment strategy.
| Neighborhood / Area | Why Host Here? (Target Guests & Appeal) | Key Attractions & Landmarks |
|---|---|---|
| Cinque Terre | A stunning coastal region known for its picturesque villages and beautiful hiking trails. Popular with tourists looking for scenic views and local culture. | Monterosso al Mare, Vernazza, Corniglia, Manarola, Riomaggiore, Cinque Terre National Park |
| Portofino | An exclusive Mediterranean resort destination famous for its picturesque harbor and upscale lifestyle. Ideal for upscale tourists seeking luxury and stunning views. | Portofino Harbor, Castello Brown, Church of St. George, Paraggi Beach, Portofino Natural Park |
| La Spezia | A vibrant city that serves as a gateway to the Cinque Terre. Attracts tourists looking for cultural experiences and local cuisine. | The Naval Museum, La Spezia Castle, Museum Amedeo Lia, Piazza Garibaldi, Cinque Terre Ferry Dock |
| Rapallo | A charming seaside town with a beautiful waterfront and historic architecture. Ideal for tourists seeking a laid-back coastal experience. | Rapallo Castle, San Michele di Pagana, Lungomare Vittorio Veneto, Porto di Rapallo, Santa Margherita Ligure |
| Sestri Levante | Known for its stunning beaches and charming old town, it attracts families and beach lovers looking for a memorable seaside vacation. | Baia del Silenzio, Baia delle Favole, Sestri Levante Beaches, Cascina Mandrin, Chiesa di San Niccolò |
| Levanto | A peaceful coastal town known for its beautiful beaches and as a surfing destination. Popular with active travelers seeking outdoor activities. | Levanto Beach, Church of St. Andrew, Sanctuary of Our Lady of the Guard, Levanto Hiking Trails, Locanda La Santissima |
| Genoa | The capital of Liguria, rich in history and culture, making it ideal for tourists interested in art, history, and local cuisine. | Genoa Aquarium, Palazzo Ducale, Via Garibaldi, Porto Antico, Lanterna di Genova |
| Bordighera | A beautiful town known for its Mediterranean climate and stunning gardens. Attractive to tourists seeking tranquility and nature. | Bordighera Beach, Villa Garnier, Pallanca Exotic Garden, Historic Old Town, Promenade |
Understanding Airbnb License Requirements & STR Laws in Veravo (2026)
Yes, Veravo, Liguria, Italy enforces high STR regulations. Obtaining a license and ensuring compliance is almost certainly required according to current 2026 STR laws. Always verify the latest short term rental regulations and Airbnb license requirements directly with local government authorities for Veravo to ensure full compliance before hosting.
(Source: AirROI data, 2026, based on 81% licensed listings)
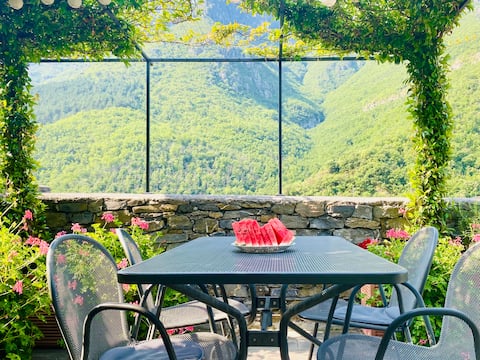
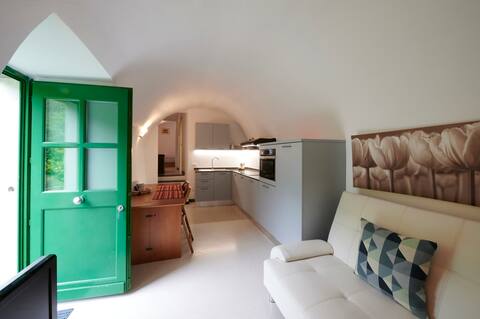
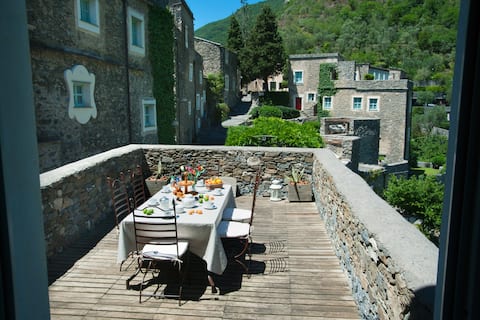
Top Performing Airbnb Properties in Veravo (2026)
Benchmark your potential! Explore examples of top-performing Airbnb properties in Veravobased on Trailing Twelve Month (TTM) revenue. Analyze their characteristics, revenue, occupancy rate, and ADR to understand what drives success in this market.
Mountains and the sea
Entire Place • 2 bedrooms

Old mill by the stream
Entire Place • 1 bedroom

Apartment with pool in the mountains, near the sea, Liguria
Entire Place • 2 bedrooms

Appartamento Olivo with garden
Entire Place • 2 bedrooms
Albicocco Apartment in Colletta
Entire Place • 2 bedrooms
Large apartment with pool
Entire Place • 2 bedrooms
Note: Performance varies based on location, size, amenities, seasonality, and management quality. Data reflects the past 12 months.
Top Performing Airbnb Hosts in Veravo (2026)
Learn from the best! This table showcases top-performing Airbnb hosts in Veravo based on the number of properties managed and estimated total revenue over the past year. Analyze their scale and performance metrics.
| Host Name | Properties | Grossing Revenue | Stay Reviews | Avg Rating |
|---|---|---|---|---|
| Treehouse Italia | 4 | $35,801 | 33 | 4.28/5.0 |
| Andrea | 5 | $31,561 | 81 | 4.95/5.0 |
| Joakim | 1 | $26,097 | 8 | 4.88/5.0 |
| Laura | 3 | $25,370 | 78 | 4.70/5.0 |
| Greg | 2 | $23,728 | 89 | 4.85/5.0 |
| Marinella | 1 | $22,641 | 128 | 4.86/5.0 |
| Stephan | 1 | $22,044 | 40 | 4.90/5.0 |
| Maria | 1 | $15,882 | 6 | 5.00/5.0 |
| Alexandra | 1 | $15,079 | 11 | 4.55/5.0 |
| Anthony | 1 | $12,643 | 121 | 4.94/5.0 |
Analyzing the strategies of top hosts, such as their property selection, pricing, and guest communication, can offer valuable lessons for optimizing your own Airbnb operations in Veravo.
Dive Deeper: Advanced Veravo STR Market Data (2026)
Ready to unlock more insights? AirROI provides access to advanced metrics and comprehensive Airbnb data for Veravo. Explore detailed analytics beyond this report to refine your investment strategy, optimize pricing, and maximize your vacation rental profits.
Explore Advanced MetricsVeravo Short-Term Rental Market Composition (2026): Property & Room Types
Room Type Distribution
Property Type Distribution
Market Composition Insights for Veravo
- The Veravo Airbnb market composition is heavily skewed towards Entire Home/Apt listings, which make up 95.3% of the 43 active rentals. This indicates strong guest preference for privacy and space.
- Looking at the property type distribution in Veravo, Apartment/Condo properties are the most common (65.1%), reflecting the local real estate landscape.
- Houses represent a significant 25.6% portion, catering likely to families or larger groups.
- Smaller segments like outdoor/unique, others, hotel/boutique (combined 9.3%) offer potential for unique stay experiences.
Veravo Airbnb Room Capacity Analysis (2026): Bedroom Distribution
Distribution of Listings by Number of Bedrooms
Room Capacity Insights for Veravo
- The dominant room capacity in Veravo is 2 bedrooms listings, making up 44.2% of the market. This suggests a strong demand for properties suitable for couples or solo travelers.
- Together, 2 bedrooms and 1 bedroom properties represent 83.7% of the active Airbnb listings in Veravo, indicating a high concentration in these sizes.
- Listings with 3+ bedrooms (4.7%) represent a smaller niche, potentially indicating an underserved market for larger group accommodations in Veravo.
Veravo Vacation Rental Guest Capacity Trends (2026)
Distribution of Listings by Guest Capacity
Guest Capacity Insights for Veravo
- The most common guest capacity trend in Veravo vacation rentals is listings accommodating 4 guests (39.5%). This suggests the primary traveler segment is likely small families or groups.
- Properties designed for 4 guests and 6 guests dominate the Veravo STR market, accounting for 65.1% of listings.
- 27.9% of properties accommodate 6+ guests, serving the market segment for larger families or group travel in Veravo.
- On average, properties in Veravo are equipped to host 4.3 guests.
Veravo Airbnb Booking Patterns (2026): Available vs. Booked Days
Available Days Distribution
Booked Days Distribution
Booking Pattern Insights for Veravo
- The most common availability pattern in Veravo falls within the 271-366 days range, representing 74.4% of listings. This suggests many properties have significant open periods on their calendars.
- Approximately 97.7% of listings show high availability (181+ days open annually), indicating potential for increased bookings or specific owner usage patterns.
- For booked days, the 31-90 days range is most frequent in Veravo (51.2%), reflecting common guest stay durations or potential owner blocking patterns.
- A notable 2.3% of properties secure long booking periods (181+ days booked per year), highlighting successful long-term rental strategies or significant owner usage.
Veravo Airbnb Minimum Stay Requirements Analysis
Distribution of Listings by Minimum Night Requirement
1 Night
1 listings
2.3% of total
2 Nights
7 listings
16.3% of total
3 Nights
4 listings
9.3% of total
4-6 Nights
10 listings
23.3% of total
7-29 Nights
3 listings
7% of total
30+ Nights
18 listings
41.9% of total
Key Insights
- The most prevalent minimum stay requirement in Veravo is 30+ Nights, adopted by 41.9% of listings. This highlights the market's preference for longer commitments.
- Very short stays (1-2 nights) are less common (18.6%), suggesting hosts prefer slightly longer bookings to optimize turnover.
- A significant segment (41.9%) caters to monthly stays (30+ nights) in Veravo, pointing to opportunities in the extended-stay market.
Recommendations
- Align with the market by considering a 30+ Nights minimum stay, as 41.9% of Veravo hosts use this setting.
- If feasible, allowing 1-night stays, especially midweek or during low season, could capture last-minute bookings, as only 2.3% currently do.
- Explore offering discounts for stays of 30+ nights to attract the 41.9% of the market seeking extended stays.
- Adjust minimum nights based on seasonality – potentially shorter during low season and longer during peak demand periods in Veravo.
Veravo Airbnb Cancellation Policy Trends Analysis (2026)
Super Strict 30 Days
5 listings
11.6% of total
Limited
3 listings
7% of total
Flexible
6 listings
14% of total
Moderate
17 listings
39.5% of total
Firm
10 listings
23.3% of total
Strict
2 listings
4.7% of total
Cancellation Policy Insights for Veravo
- The prevailing Airbnb cancellation policy trend in Veravo is Moderate, used by 39.5% of listings.
- There's a relatively balanced mix between guest-friendly (53.5%) and stricter (28.0%) policies, offering choices for different guest needs.
- Strict cancellation policies are quite rare (4.7%), potentially making listings with this policy less competitive unless justified by high demand or property type.
Recommendations for Hosts
- Consider adopting a Moderate policy to align with the 39.5% market standard in Veravo.
- Using a Strict policy might deter some guests, as only 4.7% of listings use it. Evaluate if potential revenue protection outweighs possible lower booking rates.
- Regularly review your cancellation policy against competitors and market demand shifts in Veravo.
Veravo STR Booking Lead Time Analysis (2026)
Average Booking Lead Time by Month
Booking Lead Time Insights for Veravo
- The overall average booking lead time for vacation rentals in Veravo is 55 days.
- Guests book furthest in advance for stays during July (average 89 days), likely coinciding with peak travel demand or local events.
- The shortest booking windows occur for stays in January (average 7 days), indicating more last-minute travel plans during this time.
- Seasonally, Summer (70 days avg.) sees the longest lead times, while Winter (27 days avg.) has the shortest, reflecting typical travel planning cycles.
Recommendations for Hosts
- Use the overall average lead time (55 days) as a baseline for your pricing and availability strategy in Veravo.
- For July stays, consider implementing length-of-stay discounts or slightly higher rates for bookings made less than 89 days out to capitalize on advance planning.
- During January, focus on last-minute booking availability and promotions, as guests book with very short notice (7 days avg.).
- Target marketing efforts for the Summer season well in advance (at least 70 days) to capture early planners.
- Monitor your own booking lead times against these Veravo averages to identify opportunities for dynamic pricing adjustments.
Popular & Essential Airbnb Amenities in Veravo (2026)
Amenity Prevalence
Amenity Insights for Veravo
- Essential amenities in Veravo that guests expect include: Wifi, Kitchen. Lacking these (any) could significantly impact bookings.
- Popular amenities like Heating, Refrigerator, Essentials are common but not universal. Offering these can provide a competitive edge.
Recommendations for Hosts
- Ensure your listing includes all essential amenities for Veravo: Wifi, Kitchen.
- Prioritize adding missing essentials: Wifi, Kitchen.
- Consider adding popular differentiators like Heating or Refrigerator to increase appeal.
- Highlight unique or less common amenities you offer (e.g., hot tub, dedicated workspace, EV charger) in your listing description and photos.
- Regularly check competitor amenities in Veravo to stay competitive.
Veravo Airbnb Guest Demographics & Profile Analysis (2026)
Guest Profile Summary for Veravo
- The typical guest profile for Airbnb in Veravo consists of predominantly international visitors (84%), with top international origins including Italy, typically belonging to the Post-2000s (Gen Z/Alpha) group (50%), primarily speaking English or German.
- Domestic travelers account for 16.3% of guests.
- Key international markets include Germany (26%) and Italy (16.3%).
- Top languages spoken are English (33.6%) followed by German (16.4%).
- A significant demographic segment is the Post-2000s (Gen Z/Alpha) group, representing 50% of guests.
Recommendations for Hosts
- Focus marketing internationally, particularly towards travelers from Italy.
- Tailor amenities and listing descriptions to appeal to the dominant Post-2000s (Gen Z/Alpha) demographic (e.g., highlight fast WiFi, smart home features, local guides).
- Highlight unique local experiences or amenities relevant to the primary guest profile.
- Consider seasonal promotions aligned with peak travel times for key origin markets.
Nearby Short-Term Rental Market Comparison
How does the Veravo Airbnb market stack up against its neighbors? Compare key performance metrics like average monthly revenue, ADR, and occupancy rates in surrounding areas to understand the broader regional STR landscape.
| Market | Active Properties | Monthly Revenue | Daily Rate | Avg. Occupancy |
|---|---|---|---|---|
| Ranco | 12 | $5,691 | $536.46 | 42% |
| Monteu Roero | 12 | $5,184 | $403.07 | 41% |
| Laglio | 64 | $4,334 | $518.58 | 43% |
| Saint-Jean-Cap-Ferrat | 114 | $3,894 | $465.00 | 44% |
| Cassinasco | 19 | $3,887 | $718.39 | 40% |
| Cossano Belbo | 15 | $3,763 | $326.53 | 36% |
| Portofino | 77 | $3,585 | $509.42 | 38% |
| Bellagio | 461 | $3,466 | $325.87 | 49% |
| Vico Morcote | 12 | $3,347 | $317.07 | 46% |
| Sala Comacina | 73 | $3,332 | $451.20 | 46% |