Arcevia Airbnb Market Analysis 2026: Short Term Rental Data & Vacation Rental Statistics in Marche, Italy
Is Airbnb profitable in Arcevia in 2026? Explore comprehensive Airbnb analytics for Arcevia, Marche, Italy to uncover income potential. This 2026 STR market report for Arcevia, based on AirROI data from February 2025 to January 2026, reveals key trends in the niche market of 30 active listings.
Whether you're considering an Airbnb investment in Arcevia, optimizing your existing vacation rental, or exploring rental arbitrage opportunities, understanding the Arcevia Airbnb data is crucial. Navigating the high regulation landscape is key to maximizing your short term rental income potential. Let's dive into the specifics.
Key Arcevia Airbnb Performance Metrics Overview
Monthly Airbnb Revenue Variations & Income Potential in Arcevia (2026)
Understanding the monthly revenue variations for Airbnb listings in Arcevia is key to maximizing your short term rental income potential. Seasonality significantly impacts earnings. Our analysis, based on data from the past 12 months, shows that the peak revenue month for STRs in Arcevia is typically August, while November often presents the lowest earnings, highlighting opportunities for strategic pricing adjustments during shoulder and low seasons. Explore the typical Airbnb income in Arcevia across different performance tiers:
- Best-in-class properties (Top 10%) achieve $3,069+ monthly, often utilizing dynamic pricing and superior guest experiences.
- Strong performing properties (Top 25%) earn $1,829 or more, indicating effective management and desirable locations/amenities.
- Typical properties (Median) generate around $1,132 per month, representing the average market performance.
- Entry-level properties (Bottom 25%) see earnings around $463, often with potential for optimization.
Average Monthly Airbnb Earnings Trend in Arcevia
Arcevia Airbnb Occupancy Rate Trends (2026)
Maximize your bookings by understanding the Arcevia STR occupancy trends. Seasonal demand shifts significantly influence how often properties are booked. Typically, Augustsees the highest demand (peak season occupancy), while March experiences the lowest (low season). Effective strategies, like adjusting minimum stays or offering promotions, can boost occupancy during slower periods. Here's how different property tiers perform in Arcevia:
- Best-in-class properties (Top 10%) achieve 48%+ occupancy, indicating high desirability and potentially optimized availability.
- Strong performing properties (Top 25%) maintain 37% or higher occupancy, suggesting good market fit and guest satisfaction.
- Typical properties (Median) have an occupancy rate around 22%.
- Entry-level properties (Bottom 25%) average 11% occupancy, potentially facing higher vacancy.
Average Monthly Occupancy Rate Trend in Arcevia
Average Daily Rate (ADR) Airbnb Trends in Arcevia (2026)
Effective short term rental pricing strategy in Arcevia involves understanding monthly ADR fluctuations. The Average Daily Rate (ADR) for Airbnb in Arcevia typically peaks in August and dips lowest during October. Leveraging Airbnb dynamic pricing tools or strategies based on this seasonality can significantly boost revenue. Here's a look at the typical nightly rates achieved:
- Best-in-class properties (Top 10%) command rates of $299+ per night, often due to premium features or locations.
- Strong performing properties (Top 25%) achieve nightly rates of $217 or more.
- Typical properties (Median) charge around $130 per night.
- Entry-level properties (Bottom 25%) earn around $91 per night.
Average Daily Rate (ADR) Trend by Month in Arcevia
Get Live Arcevia Market Intelligence 👇

Explore Real-time Analytics
Airbnb Seasonality Analysis & Trends in Arcevia (2026)
Peak Season (August, July, June)
- Revenue averages $2,927 per month
- Occupancy rates average 46.5%
- Daily rates average $194
Shoulder Season
- Revenue averages $1,145 per month
- Occupancy maintains around 21.5%
- Daily rates hold near $170
Low Season (March, November, December)
- Revenue drops to average $446 per month
- Occupancy decreases to average 12.1%
- Daily rates adjust to average $162
Seasonality Insights for Arcevia
- The Airbnb seasonality in Arcevia shows highly seasonal trends requiring careful strategy. While the sections above show seasonal averages, it's also insightful to look at the extremes:
- During the high season, the absolute peak month showcases Arcevia's highest earning potential, with monthly revenues capable of climbing to $3,484, occupancy reaching a high of 53.2%, and ADRs peaking at $197.
- Conversely, the slowest single month of the year, typically falling within the low season, marks the market's lowest point. In this month, revenue might dip to $338, occupancy could drop to 11.6%, and ADRs may adjust down to $147.
- Understanding both the seasonal averages and these monthly peaks and troughs in revenue, occupancy, and ADR is crucial for maximizing your Airbnb profit potential in Arcevia.
Seasonal Strategies for Maximizing Profit
- Peak Season: Maximize revenue through premium pricing and potentially longer minimum stays. Ensure high availability.
- Low Season: Offer competitive pricing, special promotions (e.g., extended stay discounts), and flexible cancellation policies. Target off-season travelers like remote workers or budget-conscious guests.
- Shoulder Seasons: Implement dynamic pricing that balances peak and low rates. Target weekend travelers or specific events. Offer slightly more flexible terms than peak season.
- Regularly analyze your own performance against these Arcevia seasonality benchmarks and adjust your pricing and availability strategy accordingly.
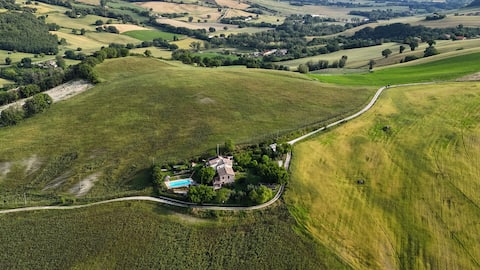
Best Areas for Airbnb Investment in Arcevia (2026)
Exploring the top neighborhoods for short-term rentals in Arcevia? This section highlights key areas, outlining why they are attractive for hosts and guests, along with notable local attractions. Consider these locations based on your target guest profile and investment strategy.
| Neighborhood / Area | Why Host Here? (Target Guests & Appeal) | Key Attractions & Landmarks |
|---|---|---|
| Centro Storico | The historic center of Arcevia, rich in medieval architecture and charm. A prime spot for tourists seeking a quaint Italian experience with local cafes and historic sites. | Rocca Piazza, Chiesa di San Medardo, Piazza del Municipio, Teatro della Concordia, Castello di Arcevia |
| Colle di Boccadirosa | A beautiful hillside area offering stunning views and a peaceful atmosphere, ideal for those looking to escape into nature while still being close to town. | Parco Regionale del Conero, Nature trails, Scenic viewpoints, Local vineyards, Hiking paths |
| San Pietro | This locality is known for its picturesque landscapes and agricultural charm, attracting tourists who enjoy rural life and local produce. | Local farms, Olive oil festivals, Countryside views, Cooking classes, Biking trails |
| Montegliano | A more secluded area excellent for travelers seeking tranquility and beautiful natural settings, perfect for a relaxing Airbnb getaway. | Nature parks, Historical ruins, Tranquil surroundings, Walking paths, Stargazing spots |
| Piobbico | Nearby Piobbico offers unique attractions with a castle and picturesque villages, making it a great spot for tourists eager to explore. | Fortress of Piobbico, Exploriens Adventure Park, Local artisans, Scenic roads, Culinary tours |
| Frasassi Caves | A natural wonder nearby that attracts countless visitors interested in geology and outdoor activities, perfect for eco-tourism. | Frasassi Caves, hiking trails, River Gola della Rossa, Picnic areas, Adventure sports |
| Cartoceto | Known for its high-quality olive oil production, this area appeals to gourmet travelers and food lovers seeking authentic culinary experiences. | Olive oil tastings, Local markets, Traditional cooking classes, Scenic farms, Culinary festivals |
| Sassoferrato | A lovely nearby town with historic significance and beautiful scenery, providing easy access to various hiking opportunities and cultural sites. | Historical sites, Art galleries, Nature reserves, Local festivals, Vineyards |
Understanding Airbnb License Requirements & STR Laws in Arcevia (2026)
Yes, Arcevia, Marche, Italy enforces high STR regulations. Obtaining a license and ensuring compliance is almost certainly required according to current 2026 STR laws. Always verify the latest short term rental regulations and Airbnb license requirements directly with local government authorities for Arcevia to ensure full compliance before hosting.
(Source: AirROI data, 2026, based on 83% licensed listings)
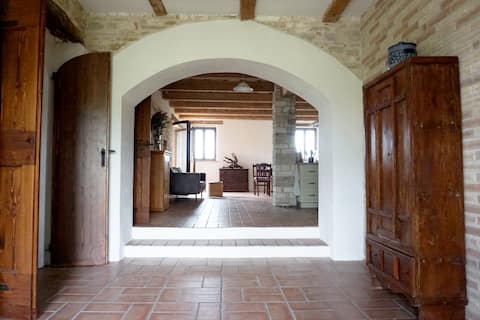
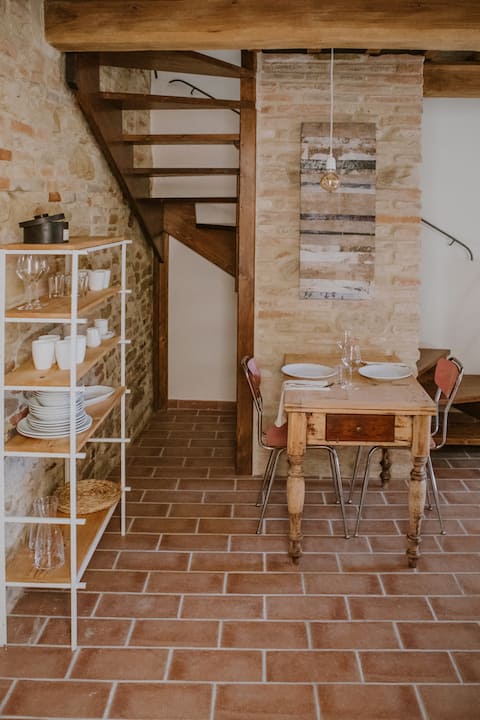
Top Performing Airbnb Properties in Arcevia (2026)
Benchmark your potential! Explore examples of top-performing Airbnb properties in Arceviabased on Trailing Twelve Month (TTM) revenue. Analyze their characteristics, revenue, occupancy rate, and ADR to understand what drives success in this market.
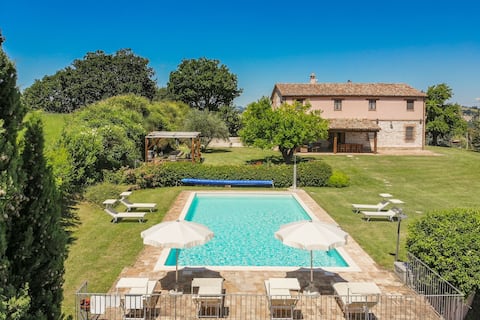
Villa Fufi
Entire Place • 4 bedrooms
360º view at vacation home Mozzafiato
Entire Place • 2 bedrooms
The house in the alley
Entire Place • 1 bedroom

The suite in the square
Entire Place • 1 bedroom

The house in the square
Entire Place • 3 bedrooms
"Casa dei Sogni d'Oro" with large shared pool
Entire Place • 2 bedrooms
Note: Performance varies based on location, size, amenities, seasonality, and management quality. Data reflects the past 12 months.
Top Performing Airbnb Hosts in Arcevia (2026)
Learn from the best! This table showcases top-performing Airbnb hosts in Arcevia based on the number of properties managed and estimated total revenue over the past year. Analyze their scale and performance metrics.
| Host Name | Properties | Grossing Revenue | Stay Reviews | Avg Rating |
|---|---|---|---|---|
| BorgoLoretello | 4 | $54,271 | 81 | 4.87/5.0 |
| Alessandro | 4 | $45,254 | 50 | 4.91/5.0 |
| Maria Silvia | 1 | $42,479 | 6 | 5.00/5.0 |
| Anouk | 1 | $37,301 | 24 | 5.00/5.0 |
| Gino Gustaaf Alice | 2 | $26,585 | 11 | 5.00/5.0 |
| Veronique Marcella L. | 2 | $23,986 | 24 | 4.86/5.0 |
| Carolina | 5 | $13,421 | 23 | 4.75/5.0 |
| Carla | 1 | $9,438 | 1 | Not Rated |
| Lovanio | 1 | $8,908 | 14 | 5.00/5.0 |
| Geraldine | 1 | $7,107 | 9 | 5.00/5.0 |
Analyzing the strategies of top hosts, such as their property selection, pricing, and guest communication, can offer valuable lessons for optimizing your own Airbnb operations in Arcevia.
Dive Deeper: Advanced Arcevia STR Market Data (2026)
Ready to unlock more insights? AirROI provides access to advanced metrics and comprehensive Airbnb data for Arcevia. Explore detailed analytics beyond this report to refine your investment strategy, optimize pricing, and maximize your vacation rental profits.
Explore Advanced MetricsArcevia Short-Term Rental Market Composition (2026): Property & Room Types
Room Type Distribution
Property Type Distribution
Market Composition Insights for Arcevia
- The Arcevia Airbnb market composition is heavily skewed towards Entire Home/Apt listings, which make up 90% of the 30 active rentals. This indicates strong guest preference for privacy and space.
- Looking at the property type distribution in Arcevia, House properties are the most common (50%), reflecting the local real estate landscape.
- Houses represent a significant 50% portion, catering likely to families or larger groups.
- Smaller segments like hotel/boutique (combined 3.3%) offer potential for unique stay experiences.
Arcevia Airbnb Room Capacity Analysis (2026): Bedroom Distribution
Distribution of Listings by Number of Bedrooms
Room Capacity Insights for Arcevia
- The dominant room capacity in Arcevia is 2 bedrooms listings, making up 40% of the market. This suggests a strong demand for properties suitable for couples or solo travelers.
- Together, 2 bedrooms and 1 bedroom properties represent 76.7% of the active Airbnb listings in Arcevia, indicating a high concentration in these sizes.
Arcevia Vacation Rental Guest Capacity Trends (2026)
Distribution of Listings by Guest Capacity
Guest Capacity Insights for Arcevia
- The most common guest capacity trend in Arcevia vacation rentals is listings accommodating 4 guests (40%). This suggests the primary traveler segment is likely small families or groups.
- Properties designed for 4 guests and 3 guests dominate the Arcevia STR market, accounting for 66.7% of listings.
- On average, properties in Arcevia are equipped to host 3.6 guests.
Arcevia Airbnb Booking Patterns (2026): Available vs. Booked Days
Available Days Distribution
Booked Days Distribution
Booking Pattern Insights for Arcevia
- The most common availability pattern in Arcevia falls within the 271-366 days range, representing 83.3% of listings. This suggests many properties have significant open periods on their calendars.
- Approximately 100.0% of listings show high availability (181+ days open annually), indicating potential for increased bookings or specific owner usage patterns.
- For booked days, the 1-30 days range is most frequent in Arcevia (43.3%), reflecting common guest stay durations or potential owner blocking patterns.
Arcevia Airbnb Minimum Stay Requirements Analysis
Distribution of Listings by Minimum Night Requirement
1 Night
1 listings
3.3% of total
2 Nights
1 listings
3.3% of total
4-6 Nights
3 listings
10% of total
7-29 Nights
2 listings
6.7% of total
30+ Nights
23 listings
76.7% of total
Key Insights
- The most prevalent minimum stay requirement in Arcevia is 30+ Nights, adopted by 76.7% of listings. This highlights the market's preference for longer commitments.
- Very short stays (1-2 nights) are less common (6.6%), suggesting hosts prefer slightly longer bookings to optimize turnover.
- A significant segment (76.7%) caters to monthly stays (30+ nights) in Arcevia, pointing to opportunities in the extended-stay market.
Recommendations
- Align with the market by considering a 30+ Nights minimum stay, as 76.7% of Arcevia hosts use this setting.
- If feasible, allowing 1-night stays, especially midweek or during low season, could capture last-minute bookings, as only 3.3% currently do.
- Explore offering discounts for stays of 30+ nights to attract the 76.7% of the market seeking extended stays.
- Adjust minimum nights based on seasonality – potentially shorter during low season and longer during peak demand periods in Arcevia.
Arcevia Airbnb Cancellation Policy Trends Analysis (2026)
Super Strict 30 Days
6 listings
20% of total
Flexible
2 listings
6.7% of total
Moderate
13 listings
43.3% of total
Firm
9 listings
30% of total
Cancellation Policy Insights for Arcevia
- The prevailing Airbnb cancellation policy trend in Arcevia is Moderate, used by 43.3% of listings.
- There's a relatively balanced mix between guest-friendly (50.0%) and stricter (30.0%) policies, offering choices for different guest needs.
Recommendations for Hosts
- Consider adopting a Moderate policy to align with the 43.3% market standard in Arcevia.
- Regularly review your cancellation policy against competitors and market demand shifts in Arcevia.
Arcevia STR Booking Lead Time Analysis (2026)
Average Booking Lead Time by Month
Booking Lead Time Insights for Arcevia
- The overall average booking lead time for vacation rentals in Arcevia is 75 days.
- Guests book furthest in advance for stays during July (average 126 days), likely coinciding with peak travel demand or local events.
- The shortest booking windows occur for stays in November (average 7 days), indicating more last-minute travel plans during this time.
- Seasonally, Summer (98 days avg.) sees the longest lead times, while Winter (32 days avg.) has the shortest, reflecting typical travel planning cycles.
Recommendations for Hosts
- Use the overall average lead time (75 days) as a baseline for your pricing and availability strategy in Arcevia.
- For July stays, consider implementing length-of-stay discounts or slightly higher rates for bookings made less than 126 days out to capitalize on advance planning.
- During November, focus on last-minute booking availability and promotions, as guests book with very short notice (7 days avg.).
- Target marketing efforts for the Summer season well in advance (at least 98 days) to capture early planners.
- Monitor your own booking lead times against these Arcevia averages to identify opportunities for dynamic pricing adjustments.
Popular & Essential Airbnb Amenities in Arcevia (2026)
Amenity Prevalence
Amenity Insights for Arcevia
- Popular amenities like Hair dryer, Kitchen, Pool are common but not universal. Offering these can provide a competitive edge.
- A pool is a highly desired but not standard amenity, making it a key feature for attracting guests seeking leisure in Arcevia.
Recommendations for Hosts
- Consider adding popular differentiators like Hair dryer or Kitchen to increase appeal.
- Highlight unique or less common amenities you offer (e.g., hot tub, dedicated workspace, EV charger) in your listing description and photos.
- Regularly check competitor amenities in Arcevia to stay competitive.
Arcevia Airbnb Guest Demographics & Profile Analysis (2026)
Guest Profile Summary for Arcevia
- The typical guest profile for Airbnb in Arcevia consists of predominantly international visitors (72%), with top international origins including Italy, typically belonging to the Post-2000s (Gen Z/Alpha) group (50%), primarily speaking English or German.
- Domestic travelers account for 28.2% of guests.
- Key international markets include Germany (28.2%) and Italy (28.2%).
- Top languages spoken are English (34.7%) followed by German (18.4%).
- A significant demographic segment is the Post-2000s (Gen Z/Alpha) group, representing 50% of guests.
Recommendations for Hosts
- Focus marketing internationally, particularly towards travelers from Italy.
- Tailor amenities and listing descriptions to appeal to the dominant Post-2000s (Gen Z/Alpha) demographic (e.g., highlight fast WiFi, smart home features, local guides).
- Highlight unique local experiences or amenities relevant to the primary guest profile.
- Consider seasonal promotions aligned with peak travel times for key origin markets.
Nearby Short-Term Rental Market Comparison
How does the Arcevia Airbnb market stack up against its neighbors? Compare key performance metrics like average monthly revenue, ADR, and occupancy rates in surrounding areas to understand the broader regional STR landscape.
| Market | Active Properties | Monthly Revenue | Daily Rate | Avg. Occupancy |
|---|---|---|---|---|
| Tignano | 12 | $4,160 | $366.92 | 45% |
| Celleno | 13 | $4,041 | $594.80 | 28% |
| Marciano della Chiana | 17 | $3,823 | $545.25 | 35% |
| Buonconvento | 60 | $3,186 | $440.58 | 43% |
| Collevecchio | 14 | $3,140 | $334.97 | 40% |
| Radda in Chianti | 94 | $3,098 | $361.57 | 39% |
| Palombara Sabina | 15 | $2,914 | $309.11 | 38% |
| Impruneta | 146 | $2,887 | $297.45 | 40% |
| Lastra a Signa | 96 | $2,760 | $311.91 | 43% |
| Florence | 10,496 | $2,755 | $225.30 | 49% |