Genga Airbnb Market Analysis 2026: Short Term Rental Data & Vacation Rental Statistics in Marche, Italy
Is Airbnb profitable in Genga in 2026? Explore comprehensive Airbnb analytics for Genga, Marche, Italy to uncover income potential. This 2026 STR market report for Genga, based on AirROI data from October 2024 to September 2025, reveals key trends in the niche market of 18 active listings.
Whether you're considering an Airbnb investment in Genga, optimizing your existing vacation rental, or exploring rental arbitrage opportunities, understanding the Genga Airbnb data is crucial. Navigating the high regulation landscape is key to maximizing your short term rental income potential. Let's dive into the specifics.
Key Genga Airbnb Performance Metrics Overview
Monthly Airbnb Revenue Variations & Income Potential in Genga (2026)
Understanding the monthly revenue variations for Airbnb listings in Genga is key to maximizing your short term rental income potential. Seasonality significantly impacts earnings. Our analysis, based on data from the past 12 months, shows that the peak revenue month for STRs in Genga is typically August, while February often presents the lowest earnings, highlighting opportunities for strategic pricing adjustments during shoulder and low seasons. Explore the typical Airbnb income in Genga across different performance tiers:
- Best-in-class properties (Top 10%) achieve $4,431+ monthly, often utilizing dynamic pricing and superior guest experiences.
- Strong performing properties (Top 25%) earn $1,529 or more, indicating effective management and desirable locations/amenities.
- Typical properties (Median) generate around $611 per month, representing the average market performance.
- Entry-level properties (Bottom 25%) see earnings around $243, often with potential for optimization.
Average Monthly Airbnb Earnings Trend in Genga
Genga Airbnb Occupancy Rate Trends (2026)
Maximize your bookings by understanding the Genga STR occupancy trends. Seasonal demand shifts significantly influence how often properties are booked. Typically, Augustsees the highest demand (peak season occupancy), while February experiences the lowest (low season). Effective strategies, like adjusting minimum stays or offering promotions, can boost occupancy during slower periods. Here's how different property tiers perform in Genga:
- Best-in-class properties (Top 10%) achieve 68%+ occupancy, indicating high desirability and potentially optimized availability.
- Strong performing properties (Top 25%) maintain 40% or higher occupancy, suggesting good market fit and guest satisfaction.
- Typical properties (Median) have an occupancy rate around 15%.
- Entry-level properties (Bottom 25%) average 6% occupancy, potentially facing higher vacancy.
Average Monthly Occupancy Rate Trend in Genga
Average Daily Rate (ADR) Airbnb Trends in Genga (2026)
Effective short term rental pricing strategy in Genga involves understanding monthly ADR fluctuations. The Average Daily Rate (ADR) for Airbnb in Genga typically peaks in July and dips lowest during October. Leveraging Airbnb dynamic pricing tools or strategies based on this seasonality can significantly boost revenue. Here's a look at the typical nightly rates achieved:
- Best-in-class properties (Top 10%) command rates of $336+ per night, often due to premium features or locations.
- Strong performing properties (Top 25%) achieve nightly rates of $176 or more.
- Typical properties (Median) charge around $89 per night.
- Entry-level properties (Bottom 25%) earn around $76 per night.
Average Daily Rate (ADR) Trend by Month in Genga
Get Live Genga Market Intelligence 👇

Explore Real-time Analytics
Airbnb Seasonality Analysis & Trends in Genga (2025)
Peak Season (August, May, July)
- Revenue averages $2,345 per month
- Occupancy rates average 31.5%
- Daily rates average $170
Shoulder Season
- Revenue averages $1,502 per month
- Occupancy maintains around 26.7%
- Daily rates hold near $147
Low Season (January, February, March)
- Revenue drops to average $429 per month
- Occupancy decreases to average 15.4%
- Daily rates adjust to average $138
Seasonality Insights for Genga
- The Airbnb seasonality in Genga shows highly seasonal trends requiring careful strategy. While the sections above show seasonal averages, it's also insightful to look at the extremes:
- During the high season, the absolute peak month showcases Genga's highest earning potential, with monthly revenues capable of climbing to $2,569, occupancy reaching a high of 36.0%, and ADRs peaking at $173.
- Conversely, the slowest single month of the year, typically falling within the low season, marks the market's lowest point. In this month, revenue might dip to $156, occupancy could drop to 3.6%, and ADRs may adjust down to $133.
- Understanding both the seasonal averages and these monthly peaks and troughs in revenue, occupancy, and ADR is crucial for maximizing your Airbnb profit potential in Genga.
Seasonal Strategies for Maximizing Profit
- Peak Season: Maximize revenue through premium pricing and potentially longer minimum stays. Ensure high availability.
- Low Season: Offer competitive pricing, special promotions (e.g., extended stay discounts), and flexible cancellation policies. Target off-season travelers like remote workers or budget-conscious guests.
- Shoulder Seasons: Implement dynamic pricing that balances peak and low rates. Target weekend travelers or specific events. Offer slightly more flexible terms than peak season.
- Regularly analyze your own performance against these Genga seasonality benchmarks and adjust your pricing and availability strategy accordingly.
Best Areas for Airbnb Investment in Genga (2026)
Exploring the top neighborhoods for short-term rentals in Genga? This section highlights key areas, outlining why they are attractive for hosts and guests, along with notable local attractions. Consider these locations based on your target guest profile and investment strategy.
| Neighborhood / Area | Why Host Here? (Target Guests & Appeal) | Key Attractions & Landmarks |
|---|---|---|
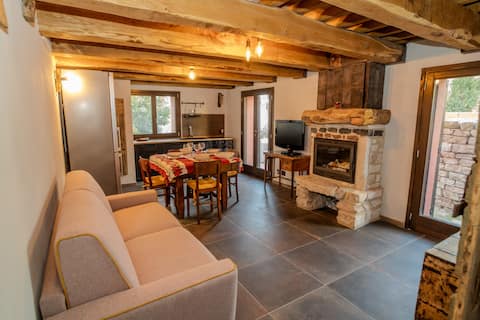
| Genga Historical Center | Charming area known for its medieval architecture and historical significance. Perfect for tourists who want to explore the rich history and culture of Genga, including the nearby Frasassi Caves. | Frasassi Caves, San Vittore Church, Castello di Genga, Civita di Fabriano, Parco Naturale Regionale della Gola della Rossa |
| Le Marche Countryside | Scenic countryside surrounding Genga, ideal for those seeking tranquility and natural beauty. Attracts visitors looking to explore the rolling hills and enjoy outdoor activities. | Hiking Trails, Wine Tours, Local Farms, Biking Routes, Nature Reserves |
| Near Frasassi Caves | The proximity to the famous Frasassi Caves, a major tourist attraction, makes this area very appealing for visitors eager to explore these natural wonders. | Frasassi Caves, Outdoor Activities, Guided Tours, Camping Sites, Gastronomy |
| Fabriano | A nearby town known for its paper-making tradition, offering tourists additional cultural experiences and historical sites. | Paper Museum, Historical City Center, Cathedral of San Benedetto, Fortress of Sant'Antonio, Piazza Matteotti |
| Jesi | A charming historical town not far from Genga, known for its Renaissance architecture and cultural events. It offers lively festivals and arts scenes. | Jesi Cathedral, Papal Palace, Piazza della Repubblica, Teatro Pergolesi, Museo di Storia della Stampa |
| Sassoferrato | Another nearby town with beautiful landscapes and historical sites, providing a peaceful destination for visitors. | Basilica di Santa Maria della Misericordia, Rocca di Sassoferrato, Fossato di Vico, Hiking Trails, Local Cuisine |
| Casnigo | A small town that offers a serene environment with opportunities for relaxation and nature, attracting visitors who want a quiet getaway. | Natural Parks, Tranquil Landscape, Local Markets, Traditional Restaurants, Hiking Paths |
| Arcevia | Known for its medieval villages and natural parks, it's perfect for travelers looking for rural tourism and beautiful landscapes. | Arcevia Fortress, Castles, Parco Naturale del Monte San Vicino, Local Festivals, Cultural Heritage |
Understanding Airbnb License Requirements & STR Laws in Genga (2026)
Yes, Genga, Marche, Italy enforces high STR regulations. Obtaining a license and ensuring compliance is almost certainly required according to current 2026 STR laws. Always verify the latest short term rental regulations and Airbnb license requirements directly with local government authorities for Genga to ensure full compliance before hosting.
(Source: AirROI data, 2026, based on 61% licensed listings)
Top Performing Airbnb Properties in Genga (2026)
Benchmark your potential! Explore examples of top-performing Airbnb properties in Gengabased on Trailing Twelve Month (TTM) revenue. Analyze their characteristics, revenue, occupancy rate, and ADR to understand what drives success in this market.
VacanzeNelVerdeGenga2 /4guests Exclusive
Entire Place • 2 bedrooms
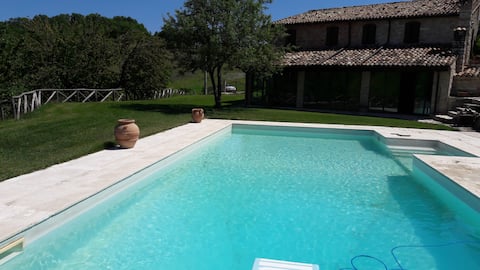
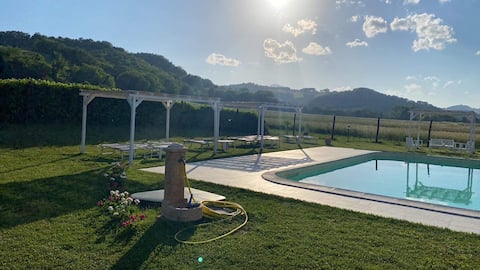
AndreoliScipioniLoriana 4/8 Guests Exclusive pool
Entire Place • 4 bedrooms
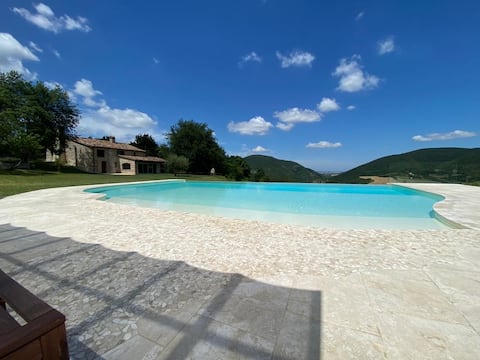
Villa Claudia with pool for exclusive use
Entire Place • 4 bedrooms
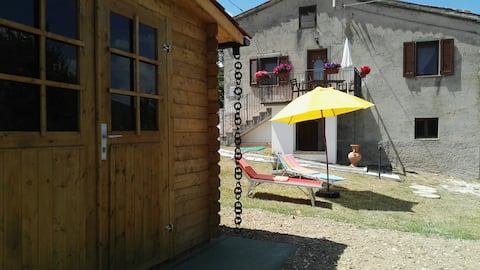
Holiday home Oasi delle Gazze
Entire Place • 2 bedrooms
The Pope's Caprice
Entire Place • 1 bedroom
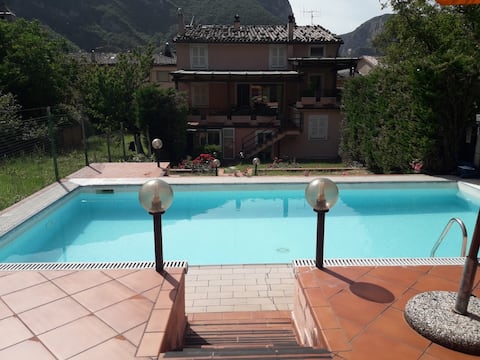
CHARMING APARTMENT WITH SWIMMING POOL
Entire Place • 2 bedrooms
Note: Performance varies based on location, size, amenities, seasonality, and management quality. Data reflects the past 12 months.
Top Performing Airbnb Hosts in Genga (2026)
Learn from the best! This table showcases top-performing Airbnb hosts in Genga based on the number of properties managed and estimated total revenue over the past year. Analyze their scale and performance metrics.
| Host Name | Properties | Grossing Revenue | Stay Reviews | Avg Rating |
|---|---|---|---|---|
| Claudia | 2 | $105,348 | 77 | 4.97/5.0 |
| Luca | 1 | $15,493 | 20 | 4.70/5.0 |
| Andrea A. | 6 | $15,349 | 27 | 4.83/5.0 |
| Sabina Mariani Michele Mariani | 1 | $12,003 | 72 | 4.90/5.0 |
| Ruralis | 1 | $9,541 | 20 | 4.80/5.0 |
| Casa Vacanze Garofoli | 1 | $7,501 | 2 | Not Rated |
| Stefano | 1 | $6,282 | 3 | 5.00/5.0 |
| Daniele | 1 | $4,848 | 6 | 5.00/5.0 |
| Lorenzo | 1 | $4,233 | 30 | 4.77/5.0 |
| Laura | 1 | $1,370 | 22 | 4.95/5.0 |
Analyzing the strategies of top hosts, such as their property selection, pricing, and guest communication, can offer valuable lessons for optimizing your own Airbnb operations in Genga.
Dive Deeper: Advanced Genga STR Market Data (2026)
Ready to unlock more insights? AirROI provides access to advanced metrics and comprehensive Airbnb data for Genga. Explore detailed analytics beyond this report to refine your investment strategy, optimize pricing, and maximize your vacation rental profits.
Explore Advanced MetricsGenga Short-Term Rental Market Composition (2026): Property & Room Types
Room Type Distribution
Property Type Distribution
Market Composition Insights for Genga
- The Genga Airbnb market composition is heavily skewed towards Entire Home/Apt listings, which make up 66.7% of the 18 active rentals. This indicates strong guest preference for privacy and space.
- However, a notable 33.3% share for Private Rooms suggests opportunities for budget-conscious travelers or hosts renting out spare rooms.
- Looking at the property type distribution in Genga, House properties are the most common (50%), reflecting the local real estate landscape.
- Houses represent a significant 50% portion, catering likely to families or larger groups.
- The presence of 22.2% Hotel/Boutique listings indicates integration with traditional hospitality.
Genga Airbnb Room Capacity Analysis (2026): Bedroom Distribution
Distribution of Listings by Number of Bedrooms
Room Capacity Insights for Genga
- The dominant room capacity in Genga is 2 bedrooms listings, making up 38.9% of the market. This suggests a strong demand for properties suitable for couples or solo travelers.
- Together, 2 bedrooms and 1 bedroom properties represent 55.6% of the active Airbnb listings in Genga, indicating a high concentration in these sizes.
- A significant 22.3% of listings offer 3+ bedrooms, catering to larger groups and families seeking more space in Genga.
Genga Vacation Rental Guest Capacity Trends (2026)
Distribution of Listings by Guest Capacity
Guest Capacity Insights for Genga
- The most common guest capacity trend in Genga vacation rentals is listings accommodating 8+ guests (22.2%). This suggests the primary traveler segment is likely larger groups.
- Properties designed for 8+ guests and 6 guests dominate the Genga STR market, accounting for 33.3% of listings.
- 44.4% of properties accommodate 6+ guests, serving the market segment for larger families or group travel in Genga.
- On average, properties in Genga are equipped to host 4.4 guests.
Genga Airbnb Booking Patterns (2026): Available vs. Booked Days
Available Days Distribution
Booked Days Distribution
Booking Pattern Insights for Genga
- The most common availability pattern in Genga falls within the 271-366 days range, representing 77.8% of listings. This suggests many properties have significant open periods on their calendars.
- Approximately 94.5% of listings show high availability (181+ days open annually), indicating potential for increased bookings or specific owner usage patterns.
- For booked days, the 31-90 days range is most frequent in Genga (44.4%), reflecting common guest stay durations or potential owner blocking patterns.
- A notable 5.6% of properties secure long booking periods (181+ days booked per year), highlighting successful long-term rental strategies or significant owner usage.
Genga Airbnb Minimum Stay Requirements Analysis
Distribution of Listings by Minimum Night Requirement
1 Night
7 listings
38.9% of total
2 Nights
4 listings
22.2% of total
4-6 Nights
2 listings
11.1% of total
30+ Nights
5 listings
27.8% of total
Key Insights
- The most prevalent minimum stay requirement in Genga is 1 Night, adopted by 38.9% of listings. This highlights the market's preference for shorter, flexible bookings.
- A strong majority (61.1%) of the Genga Airbnb data shows acceptance of very short stays (1-2 nights), indicating a dynamic, high-turnover market.
- A significant segment (27.8%) caters to monthly stays (30+ nights) in Genga, pointing to opportunities in the extended-stay market.
Recommendations
- Align with the market by considering a 1 Night minimum stay, as 38.9% of Genga hosts use this setting.
- Explore offering discounts for stays of 30+ nights to attract the 27.8% of the market seeking extended stays.
- Adjust minimum nights based on seasonality – potentially shorter during low season and longer during peak demand periods in Genga.
Genga Airbnb Cancellation Policy Trends Analysis (2026)
Flexible
8 listings
44.4% of total
Moderate
8 listings
44.4% of total
Strict
2 listings
11.1% of total
Cancellation Policy Insights for Genga
- The prevailing Airbnb cancellation policy trend in Genga is Flexible, used by 44.4% of listings.
- The market strongly favors guest-friendly terms, with 88.8% of listings offering Flexible or Moderate policies. This suggests guests in Genga may expect booking flexibility.
Recommendations for Hosts
- Consider adopting a Flexible policy to align with the 44.4% market standard in Genga.
- Using a Strict policy might deter some guests, as only 11.1% of listings use it. Evaluate if potential revenue protection outweighs possible lower booking rates.
- Regularly review your cancellation policy against competitors and market demand shifts in Genga.
Genga STR Booking Lead Time Analysis (2026)
Average Booking Lead Time by Month
Booking Lead Time Insights for Genga
- The overall average booking lead time for vacation rentals in Genga is 47 days.
- Guests book furthest in advance for stays during August (average 77 days), likely coinciding with peak travel demand or local events.
- The shortest booking windows occur for stays in October (average 19 days), indicating more last-minute travel plans during this time.
- Seasonally, Summer (64 days avg.) sees the longest lead times, while Winter (29 days avg.) has the shortest, reflecting typical travel planning cycles.
Recommendations for Hosts
- Use the overall average lead time (47 days) as a baseline for your pricing and availability strategy in Genga.
- For August stays, consider implementing length-of-stay discounts or slightly higher rates for bookings made less than 77 days out to capitalize on advance planning.
- Target marketing efforts for the Summer season well in advance (at least 64 days) to capture early planners.
- Monitor your own booking lead times against these Genga averages to identify opportunities for dynamic pricing adjustments.
Popular & Essential Airbnb Amenities in Genga (2026)
Amenity Prevalence
Amenity Insights for Genga
- Essential amenities in Genga that guests expect include: Kitchen, Hair dryer. Lacking these (any) could significantly impact bookings.
- Popular amenities like Essentials, Iron, Washer are common but not universal. Offering these can provide a competitive edge.
- Warning: Wifi is not universally provided but is considered essential globally. Ensure reliable Wifi is offered.
Recommendations for Hosts
- Ensure your listing includes all essential amenities for Genga: Kitchen, Hair dryer.
- Consider adding popular differentiators like Essentials or Iron to increase appeal.
- Highlight unique or less common amenities you offer (e.g., hot tub, dedicated workspace, EV charger) in your listing description and photos.
- Regularly check competitor amenities in Genga to stay competitive.
Genga Airbnb Guest Demographics & Profile Analysis (2026)
Guest Profile Summary for Genga
- The typical guest profile for Airbnb in Genga consists of a mix of domestic (58%) and international guests, often arriving from nearby Rome, typically belonging to the Post-2000s (Gen Z/Alpha) group (50%), primarily speaking English or Italian.
- Domestic travelers account for 57.6% of guests.
- Key international markets include Italy (57.6%) and Germany (12.1%).
- Top languages spoken are English (41.4%) followed by Italian (20.7%).
- A significant demographic segment is the Post-2000s (Gen Z/Alpha) group, representing 50% of guests.
Recommendations for Hosts
- Balance marketing efforts between domestic and international channels based on the guest mix.
- Tailor amenities and listing descriptions to appeal to the dominant Post-2000s (Gen Z/Alpha) demographic (e.g., highlight fast WiFi, smart home features, local guides).
- Highlight unique local experiences or amenities relevant to the primary guest profile.
- Consider seasonal promotions aligned with peak travel times for key origin markets.
Nearby Short-Term Rental Market Comparison
How does the Genga Airbnb market stack up against its neighbors? Compare key performance metrics like average monthly revenue, ADR, and occupancy rates in surrounding areas to understand the broader regional STR landscape.
| Market | Active Properties | Monthly Revenue | Daily Rate | Avg. Occupancy |
|---|---|---|---|---|
| Tignano | 11 | $3,884 | $359.81 | 43% |
| Marciano della Chiana | 18 | $3,566 | $504.64 | 33% |
| Celleno | 15 | $3,181 | $539.65 | 26% |
| Collevecchio | 14 | $2,851 | $322.32 | 34% |
| Impruneta | 141 | $2,814 | $293.16 | 39% |
| Allerona | 10 | $2,803 | $457.58 | 39% |
| Marcialla | 28 | $2,778 | $257.49 | 50% |
| Florence | 10,004 | $2,734 | $222.56 | 49% |
| Lastra a Signa | 92 | $2,675 | $319.19 | 43% |
| Monte San Savino | 96 | $2,671 | $353.51 | 35% |