Mogliano Airbnb Market Analysis 2026: Short Term Rental Data & Vacation Rental Statistics in Marche, Italy
Is Airbnb profitable in Mogliano in 2026? Explore comprehensive Airbnb analytics for Mogliano, Marche, Italy to uncover income potential. This 2026 STR market report for Mogliano, based on AirROI data from December 2024 to November 2025, reveals key trends in the niche market of 18 active listings.
Whether you're considering an Airbnb investment in Mogliano, optimizing your existing vacation rental, or exploring rental arbitrage opportunities, understanding the Mogliano Airbnb data is crucial. Navigating the high regulation landscape is key to maximizing your short term rental income potential. Let's dive into the specifics.
Key Mogliano Airbnb Performance Metrics Overview
Monthly Airbnb Revenue Variations & Income Potential in Mogliano (2026)
Understanding the monthly revenue variations for Airbnb listings in Mogliano is key to maximizing your short term rental income potential. Seasonality significantly impacts earnings. Our analysis, based on data from the past 12 months, shows that the peak revenue month for STRs in Mogliano is typically July, while November often presents the lowest earnings, highlighting opportunities for strategic pricing adjustments during shoulder and low seasons. Explore the typical Airbnb income in Mogliano across different performance tiers:
- Best-in-class properties (Top 10%) achieve $7,392+ monthly, often utilizing dynamic pricing and superior guest experiences.
- Strong performing properties (Top 25%) earn $2,691 or more, indicating effective management and desirable locations/amenities.
- Typical properties (Median) generate around $1,479 per month, representing the average market performance.
- Entry-level properties (Bottom 25%) see earnings around $783, often with potential for optimization.
Average Monthly Airbnb Earnings Trend in Mogliano
Mogliano Airbnb Occupancy Rate Trends (2026)
Maximize your bookings by understanding the Mogliano STR occupancy trends. Seasonal demand shifts significantly influence how often properties are booked. Typically, Julysees the highest demand (peak season occupancy), while January experiences the lowest (low season). Effective strategies, like adjusting minimum stays or offering promotions, can boost occupancy during slower periods. Here's how different property tiers perform in Mogliano:
- Best-in-class properties (Top 10%) achieve 57%+ occupancy, indicating high desirability and potentially optimized availability.
- Strong performing properties (Top 25%) maintain 42% or higher occupancy, suggesting good market fit and guest satisfaction.
- Typical properties (Median) have an occupancy rate around 25%.
- Entry-level properties (Bottom 25%) average 16% occupancy, potentially facing higher vacancy.
Average Monthly Occupancy Rate Trend in Mogliano
Average Daily Rate (ADR) Airbnb Trends in Mogliano (2026)
Effective short term rental pricing strategy in Mogliano involves understanding monthly ADR fluctuations. The Average Daily Rate (ADR) for Airbnb in Mogliano typically peaks in July and dips lowest during November. Leveraging Airbnb dynamic pricing tools or strategies based on this seasonality can significantly boost revenue. Here's a look at the typical nightly rates achieved:
- Best-in-class properties (Top 10%) command rates of $503+ per night, often due to premium features or locations.
- Strong performing properties (Top 25%) achieve nightly rates of $238 or more.
- Typical properties (Median) charge around $161 per night.
- Entry-level properties (Bottom 25%) earn around $111 per night.
Average Daily Rate (ADR) Trend by Month in Mogliano
Get Live Mogliano Market Intelligence 👇

Explore Real-time Analytics
Airbnb Seasonality Analysis & Trends in Mogliano (2025)
Peak Season (July, August, May)
- Revenue averages $6,122 per month
- Occupancy rates average 55.0%
- Daily rates average $263
Shoulder Season
- Revenue averages $2,865 per month
- Occupancy maintains around 27.9%
- Daily rates hold near $244
Low Season (January, February, November)
- Revenue drops to average $750 per month
- Occupancy decreases to average 14.4%
- Daily rates adjust to average $233
Seasonality Insights for Mogliano
- The Airbnb seasonality in Mogliano shows highly seasonal trends requiring careful strategy. While the sections above show seasonal averages, it's also insightful to look at the extremes:
- During the high season, the absolute peak month showcases Mogliano's highest earning potential, with monthly revenues capable of climbing to $7,609, occupancy reaching a high of 67.7%, and ADRs peaking at $271.
- Conversely, the slowest single month of the year, typically falling within the low season, marks the market's lowest point. In this month, revenue might dip to $693, occupancy could drop to 8.6%, and ADRs may adjust down to $228.
- Understanding both the seasonal averages and these monthly peaks and troughs in revenue, occupancy, and ADR is crucial for maximizing your Airbnb profit potential in Mogliano.
Seasonal Strategies for Maximizing Profit
- Peak Season: Maximize revenue through premium pricing and potentially longer minimum stays. Ensure high availability.
- Low Season: Offer competitive pricing, special promotions (e.g., extended stay discounts), and flexible cancellation policies. Target off-season travelers like remote workers or budget-conscious guests.
- Shoulder Seasons: Implement dynamic pricing that balances peak and low rates. Target weekend travelers or specific events. Offer slightly more flexible terms than peak season.
- Regularly analyze your own performance against these Mogliano seasonality benchmarks and adjust your pricing and availability strategy accordingly.
Best Areas for Airbnb Investment in Mogliano (2026)
Exploring the top neighborhoods for short-term rentals in Mogliano? This section highlights key areas, outlining why they are attractive for hosts and guests, along with notable local attractions. Consider these locations based on your target guest profile and investment strategy.
| Neighborhood / Area | Why Host Here? (Target Guests & Appeal) | Key Attractions & Landmarks |
|---|---|---|
| Centro Storico | The historic center of Mogliano offers charming streets, beautiful architecture, and a rich cultural heritage. It's a great spot for tourists wanting to explore the local history and enjoy quaint cafes and shops. | Mogliano Church, Piazza della Repubblica, Local artisan shops, Historic palazzos, Cafes and restaurants |
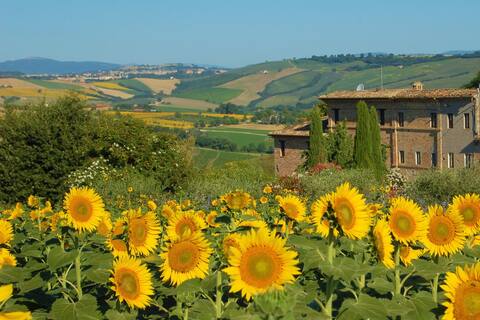
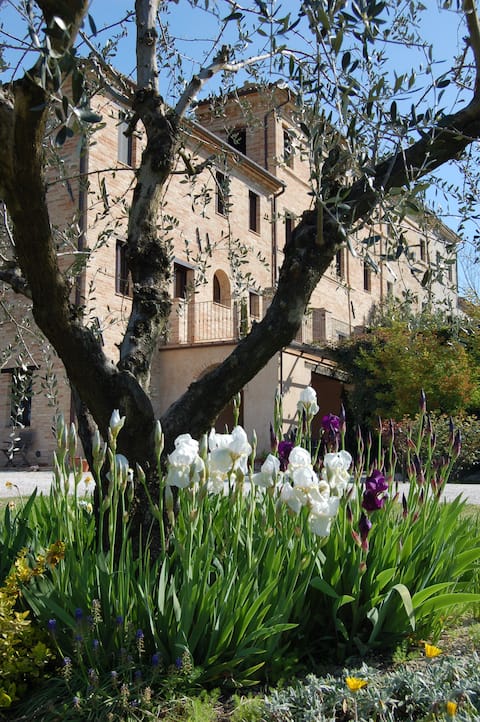
| Mogliano Countryside | The surrounding countryside provides a tranquil escape with picturesque landscapes, vineyards, and farms. Ideal for guests seeking relaxation and nature. | Vineyards, Hiking trails, Scenic views, Agriturismo experiences, Local markets |
| Parco Comunale | This public park is a green oasis for both locals and visitors. It attracts families and those looking to enjoy outdoor activities and events. | Walking trails, Playgrounds, Picnic areas, Seasonal events, Cultural activities |
| Via Roma | A bustling street known for its shops and cafes, perfect for travelers who wish to experience the local lifestyle and vibrant atmosphere of Mogliano. | Shops, Cafes, Restaurants, Local street food, Cultural festivals |
| Castello di Mogliano | The castle area provides historical insight and stunning views of the region. A must-see for history buffs and photographers alike. | Castle views, Historical exhibitions, Guided tours, Photography spots, Local history displays |
| Near Lago di Cingoli | Proximity to the lake offers scenic beauty and water-related activities. Great for tourists who enjoy outdoor adventures. | Boating, Fishing, Picnic spots, Walking paths, Nature observation |
| Local Vineyards | Mogliano is near famous wine regions. Hosting around these areas attracts wine lovers and gourmets. | Wine tastings, Vineyard tours, Local wine shops, Culinary experiences, Gastronomy events |
| Nearby Cities (Recanati, Loreto) | Close to other historical towns, providing guests with day trip opportunities to explore more of the Marche region's rich culture and history. | Loreto Sanctuary, Recanati's Leopardi's House, Historic streets of Recanati, Local museums, Cultural experiences |
Understanding Airbnb License Requirements & STR Laws in Mogliano (2026)
Yes, Mogliano, Marche, Italy enforces high STR regulations. Obtaining a license and ensuring compliance is almost certainly required according to current 2026 STR laws. Always verify the latest short term rental regulations and Airbnb license requirements directly with local government authorities for Mogliano to ensure full compliance before hosting.
(Source: AirROI data, 2026, based on 44% licensed listings)
Top Performing Airbnb Properties in Mogliano (2026)
Benchmark your potential! Explore examples of top-performing Airbnb properties in Moglianobased on Trailing Twelve Month (TTM) revenue. Analyze their characteristics, revenue, occupancy rate, and ADR to understand what drives success in this market.
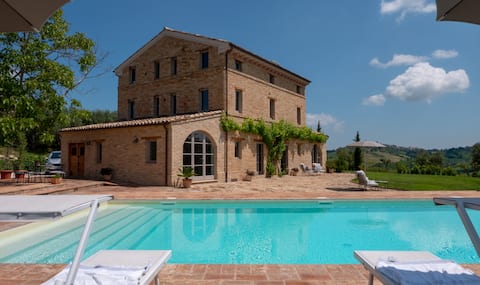
Casa Preziosa, Mogliano, Marche, Italy
Entire Place • 7 bedrooms
Charming Italian Country House With Pool
Entire Place • 3 bedrooms
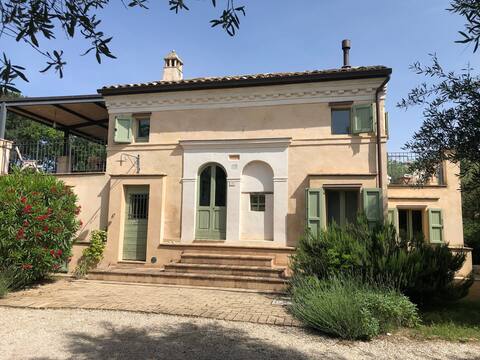
Experience Authentic Italian Village Life
Entire Place • 2 bedrooms
Charming Italian Village Retreat - 2 Apartments
Entire Place • 2 bedrooms

Casa Infinito - Villa with pool in le Marche
Entire Place • 2 bedrooms
Tranquil apartment with pool
Entire Place • 2 bedrooms
Note: Performance varies based on location, size, amenities, seasonality, and management quality. Data reflects the past 12 months.
Top Performing Airbnb Hosts in Mogliano (2026)
Learn from the best! This table showcases top-performing Airbnb hosts in Mogliano based on the number of properties managed and estimated total revenue over the past year. Analyze their scale and performance metrics.
| Host Name | Properties | Grossing Revenue | Stay Reviews | Avg Rating |
|---|---|---|---|---|
| Ingrid | 1 | $173,321 | 50 | 4.98/5.0 |
| Kristy And James | 6 | $63,748 | 102 | 4.98/5.0 |
| Paul | 1 | $42,165 | 66 | 4.89/5.0 |
| Tamsin | 3 | $24,907 | 69 | 4.84/5.0 |
| Barbara - DH Villas | 3 | $22,067 | 10 | 5.00/5.0 |
| Arno | 1 | $8,908 | 5 | 5.00/5.0 |
| Zoe | 1 | $5,176 | 1 | Not Rated |
| Letizia | 1 | $1,737 | 4 | 5.00/5.0 |
| Fabio | 1 | $174 | 25 | 4.96/5.0 |
Analyzing the strategies of top hosts, such as their property selection, pricing, and guest communication, can offer valuable lessons for optimizing your own Airbnb operations in Mogliano.
Dive Deeper: Advanced Mogliano STR Market Data (2026)
Ready to unlock more insights? AirROI provides access to advanced metrics and comprehensive Airbnb data for Mogliano. Explore detailed analytics beyond this report to refine your investment strategy, optimize pricing, and maximize your vacation rental profits.
Explore Advanced MetricsMogliano Short-Term Rental Market Composition (2026): Property & Room Types
Room Type Distribution
Property Type Distribution
Market Composition Insights for Mogliano
- The Mogliano Airbnb market composition is heavily skewed towards Entire Home/Apt listings, which make up 88.9% of the 18 active rentals. This indicates strong guest preference for privacy and space.
- Looking at the property type distribution in Mogliano, Apartment/Condo properties are the most common (55.6%), reflecting the local real estate landscape.
- Houses represent a significant 38.9% portion, catering likely to families or larger groups.
Mogliano Airbnb Room Capacity Analysis (2026): Bedroom Distribution
Distribution of Listings by Number of Bedrooms
Room Capacity Insights for Mogliano
- The dominant room capacity in Mogliano is 2 bedrooms listings, making up 33.3% of the market. This suggests a strong demand for properties suitable for couples or solo travelers.
- Together, 2 bedrooms and 5+ bedrooms properties represent 50.0% of the active Airbnb listings in Mogliano, indicating a high concentration in these sizes.
- A significant 39.0% of listings offer 3+ bedrooms, catering to larger groups and families seeking more space in Mogliano.
Mogliano Vacation Rental Guest Capacity Trends (2026)
Distribution of Listings by Guest Capacity
Guest Capacity Insights for Mogliano
- The most common guest capacity trend in Mogliano vacation rentals is listings accommodating 4 guests (27.8%). This suggests the primary traveler segment is likely small families or groups.
- Properties designed for 4 guests and 8+ guests dominate the Mogliano STR market, accounting for 55.6% of listings.
- 50.0% of properties accommodate 6+ guests, serving the market segment for larger families or group travel in Mogliano.
- On average, properties in Mogliano are equipped to host 4.9 guests.
Mogliano Airbnb Booking Patterns (2026): Available vs. Booked Days
Available Days Distribution
Booked Days Distribution
Booking Pattern Insights for Mogliano
- The most common availability pattern in Mogliano falls within the 271-366 days range, representing 88.9% of listings. This suggests many properties have significant open periods on their calendars.
- Approximately 100.0% of listings show high availability (181+ days open annually), indicating potential for increased bookings or specific owner usage patterns.
- For booked days, the 31-90 days range is most frequent in Mogliano (44.4%), reflecting common guest stay durations or potential owner blocking patterns.
Mogliano Airbnb Minimum Stay Requirements Analysis
Distribution of Listings by Minimum Night Requirement
2 Nights
1 listings
5.6% of total
3 Nights
2 listings
11.1% of total
4-6 Nights
3 listings
16.7% of total
7-29 Nights
7 listings
38.9% of total
30+ Nights
5 listings
27.8% of total
Key Insights
- The most prevalent minimum stay requirement in Mogliano is 7-29 Nights, adopted by 38.9% of listings. This highlights the market's preference for shorter, flexible bookings.
- Very short stays (1-2 nights) are less common (5.6%), suggesting hosts prefer slightly longer bookings to optimize turnover.
- A significant segment (27.8%) caters to monthly stays (30+ nights) in Mogliano, pointing to opportunities in the extended-stay market.
Recommendations
- Align with the market by considering a 7-29 Nights minimum stay, as 38.9% of Mogliano hosts use this setting.
- Explore offering discounts for stays of 30+ nights to attract the 27.8% of the market seeking extended stays.
- Adjust minimum nights based on seasonality – potentially shorter during low season and longer during peak demand periods in Mogliano.
Mogliano Airbnb Cancellation Policy Trends Analysis (2026)
Super Strict 60 Days
3 listings
16.7% of total
Flexible
3 listings
16.7% of total
Moderate
8 listings
44.4% of total
Strict
4 listings
22.2% of total
Cancellation Policy Insights for Mogliano
- The prevailing Airbnb cancellation policy trend in Mogliano is Moderate, used by 44.4% of listings.
- There's a relatively balanced mix between guest-friendly (61.1%) and stricter (22.2%) policies, offering choices for different guest needs.
Recommendations for Hosts
- Consider adopting a Moderate policy to align with the 44.4% market standard in Mogliano.
- Regularly review your cancellation policy against competitors and market demand shifts in Mogliano.
Mogliano STR Booking Lead Time Analysis (2026)
Average Booking Lead Time by Month
Booking Lead Time Insights for Mogliano
- The overall average booking lead time for vacation rentals in Mogliano is 85 days.
- Guests book furthest in advance for stays during August (average 149 days), likely coinciding with peak travel demand or local events.
- The shortest booking windows occur for stays in February (average 34 days), indicating more last-minute travel plans during this time.
- Seasonally, Summer (116 days avg.) sees the longest lead times, while Winter (67 days avg.) has the shortest, reflecting typical travel planning cycles.
Recommendations for Hosts
- Use the overall average lead time (85 days) as a baseline for your pricing and availability strategy in Mogliano.
- For August stays, consider implementing length-of-stay discounts or slightly higher rates for bookings made less than 149 days out to capitalize on advance planning.
- Target marketing efforts for the Summer season well in advance (at least 116 days) to capture early planners.
- Monitor your own booking lead times against these Mogliano averages to identify opportunities for dynamic pricing adjustments.
Popular & Essential Airbnb Amenities in Mogliano (2026)
Amenity Prevalence
Amenity Insights for Mogliano
- Essential amenities in Mogliano that guests expect include: Wifi, Hair dryer, Free parking on premises. Lacking these (any) could significantly impact bookings.
- Popular amenities like Essentials, Kitchen, Washer are common but not universal. Offering these can provide a competitive edge.
- A pool is a highly desired but not standard amenity, making it a key feature for attracting guests seeking leisure in Mogliano.
Recommendations for Hosts
- Ensure your listing includes all essential amenities for Mogliano: Wifi, Hair dryer, Free parking on premises.
- Consider adding popular differentiators like Essentials or Kitchen to increase appeal.
- Highlight unique or less common amenities you offer (e.g., hot tub, dedicated workspace, EV charger) in your listing description and photos.
- Regularly check competitor amenities in Mogliano to stay competitive.
Mogliano Airbnb Guest Demographics & Profile Analysis (2026)
Guest Profile Summary for Mogliano
- The typical guest profile for Airbnb in Mogliano consists of predominantly international visitors (93%), with top international origins including Netherlands, typically belonging to the Post-2000s (Gen Z/Alpha) group (50%), primarily speaking English or German.
- Domestic travelers account for 6.9% of guests.
- Key international markets include Germany (27.6%) and Netherlands (17.2%).
- Top languages spoken are English (37.5%) followed by German (25%).
- A significant demographic segment is the Post-2000s (Gen Z/Alpha) group, representing 50% of guests.
Recommendations for Hosts
- Focus marketing internationally, particularly towards travelers from Netherlands.
- Tailor amenities and listing descriptions to appeal to the dominant Post-2000s (Gen Z/Alpha) demographic (e.g., highlight fast WiFi, smart home features, local guides).
- Highlight unique local experiences or amenities relevant to the primary guest profile.
- Consider seasonal promotions aligned with peak travel times for key origin markets.
Nearby Short-Term Rental Market Comparison
How does the Mogliano Airbnb market stack up against its neighbors? Compare key performance metrics like average monthly revenue, ADR, and occupancy rates in surrounding areas to understand the broader regional STR landscape.
| Market | Active Properties | Monthly Revenue | Daily Rate | Avg. Occupancy |
|---|---|---|---|---|
| Celleno | 13 | $3,899 | $607.95 | 27% |
| Collevecchio | 13 | $3,300 | $348.91 | 35% |
| Parrano | 17 | $2,720 | $336.22 | 32% |
| Bertinoro | 14 | $2,706 | $406.81 | 25% |
| San Leo | 19 | $2,682 | $293.62 | 32% |
| Guardea | 13 | $2,636 | $429.29 | 32% |
| Palombara Sabina | 15 | $2,626 | $305.39 | 34% |
| Monteleone d'Orvieto | 35 | $2,550 | $330.27 | 31% |
| Stanišovi | 23 | $2,448 | $466.55 | 34% |
| Monte Santa Maria Tiberina | 36 | $2,369 | $342.37 | 29% |