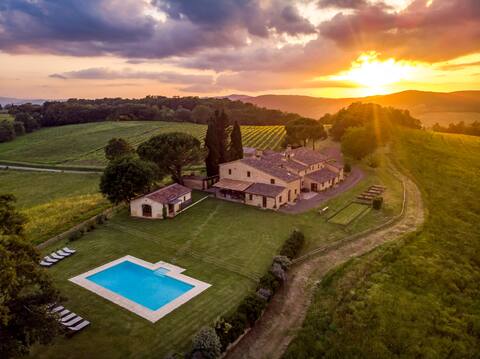
Buonconvento Airbnb Market Analysis 2026: Short Term Rental Data & Vacation Rental Statistics in Tuscany, Italy
Is Airbnb profitable in Buonconvento in 2026? Explore comprehensive Airbnb analytics for Buonconvento, Tuscany, Italy to uncover income potential. This 2026 STR market report for Buonconvento, based on AirROI data from February 2025 to January 2026, reveals key trends in the niche market of 60 active listings.
Whether you're considering an Airbnb investment in Buonconvento, optimizing your existing vacation rental, or exploring rental arbitrage opportunities, understanding the Buonconvento Airbnb data is crucial. Navigating the high regulation landscape is key to maximizing your short term rental income potential. Let's dive into the specifics.
Key Buonconvento Airbnb Performance Metrics Overview
Monthly Airbnb Revenue Variations & Income Potential in Buonconvento (2026)
Understanding the monthly revenue variations for Airbnb listings in Buonconvento is key to maximizing your short term rental income potential. Seasonality significantly impacts earnings. Our analysis, based on data from the past 12 months, shows that the peak revenue month for STRs in Buonconvento is typically July, while January often presents the lowest earnings, highlighting opportunities for strategic pricing adjustments during shoulder and low seasons. Explore the typical Airbnb income in Buonconvento across different performance tiers:
- Best-in-class properties (Top 10%) achieve $11,848+ monthly, often utilizing dynamic pricing and superior guest experiences.
- Strong performing properties (Top 25%) earn $5,010 or more, indicating effective management and desirable locations/amenities.
- Typical properties (Median) generate around $2,309 per month, representing the average market performance.
- Entry-level properties (Bottom 25%) see earnings around $921, often with potential for optimization.
Average Monthly Airbnb Earnings Trend in Buonconvento
Buonconvento Airbnb Occupancy Rate Trends (2026)
Maximize your bookings by understanding the Buonconvento STR occupancy trends. Seasonal demand shifts significantly influence how often properties are booked. Typically, Julysees the highest demand (peak season occupancy), while January experiences the lowest (low season). Effective strategies, like adjusting minimum stays or offering promotions, can boost occupancy during slower periods. Here's how different property tiers perform in Buonconvento:
- Best-in-class properties (Top 10%) achieve 74%+ occupancy, indicating high desirability and potentially optimized availability.
- Strong performing properties (Top 25%) maintain 59% or higher occupancy, suggesting good market fit and guest satisfaction.
- Typical properties (Median) have an occupancy rate around 38%.
- Entry-level properties (Bottom 25%) average 18% occupancy, potentially facing higher vacancy.
Average Monthly Occupancy Rate Trend in Buonconvento
Average Daily Rate (ADR) Airbnb Trends in Buonconvento (2026)
Effective short term rental pricing strategy in Buonconvento involves understanding monthly ADR fluctuations. The Average Daily Rate (ADR) for Airbnb in Buonconvento typically peaks in September and dips lowest during March. Leveraging Airbnb dynamic pricing tools or strategies based on this seasonality can significantly boost revenue. Here's a look at the typical nightly rates achieved:
- Best-in-class properties (Top 10%) command rates of $1,618+ per night, often due to premium features or locations.
- Strong performing properties (Top 25%) achieve nightly rates of $375 or more.
- Typical properties (Median) charge around $167 per night.
- Entry-level properties (Bottom 25%) earn around $110 per night.
Average Daily Rate (ADR) Trend by Month in Buonconvento
Get Live Buonconvento Market Intelligence 👇

Explore Real-time Analytics
Airbnb Seasonality Analysis & Trends in Buonconvento (2026)
Peak Season (July, August, September)
- Revenue averages $7,971 per month
- Occupancy rates average 56.5%
- Daily rates average $473
Shoulder Season
- Revenue averages $4,067 per month
- Occupancy maintains around 40.2%
- Daily rates hold near $441
Low Season (January, March, December)
- Revenue drops to average $1,918 per month
- Occupancy decreases to average 25.1%
- Daily rates adjust to average $445
Seasonality Insights for Buonconvento
- The Airbnb seasonality in Buonconvento shows highly seasonal trends requiring careful strategy. While the sections above show seasonal averages, it's also insightful to look at the extremes:
- During the high season, the absolute peak month showcases Buonconvento's highest earning potential, with monthly revenues capable of climbing to $9,074, occupancy reaching a high of 59.4%, and ADRs peaking at $495.
- Conversely, the slowest single month of the year, typically falling within the low season, marks the market's lowest point. In this month, revenue might dip to $1,409, occupancy could drop to 18.7%, and ADRs may adjust down to $427.
- Understanding both the seasonal averages and these monthly peaks and troughs in revenue, occupancy, and ADR is crucial for maximizing your Airbnb profit potential in Buonconvento.
Seasonal Strategies for Maximizing Profit
- Peak Season: Maximize revenue through premium pricing and potentially longer minimum stays. Ensure high availability.
- Low Season: Offer competitive pricing, special promotions (e.g., extended stay discounts), and flexible cancellation policies. Target off-season travelers like remote workers or budget-conscious guests.
- Shoulder Seasons: Implement dynamic pricing that balances peak and low rates. Target weekend travelers or specific events. Offer slightly more flexible terms than peak season.
- Regularly analyze your own performance against these Buonconvento seasonality benchmarks and adjust your pricing and availability strategy accordingly.
Best Areas for Airbnb Investment in Buonconvento (2026)
Exploring the top neighborhoods for short-term rentals in Buonconvento? This section highlights key areas, outlining why they are attractive for hosts and guests, along with notable local attractions. Consider these locations based on your target guest profile and investment strategy.
| Neighborhood / Area | Why Host Here? (Target Guests & Appeal) | Key Attractions & Landmarks |
|---|---|---|
| Centro Storico | The historic center of Buonconvento, filled with medieval architecture and charming streets. A perfect spot for travelers interested in history and culture, with easy access to local restaurants and shops. | Buonconvento Museum, Piazza della Libertà, San Lorenzo Church, City Walls, Local Enoteca |
| Val d'Orcia | A picturesque region surrounding Buonconvento, renowned for its stunning landscapes and vineyards. Ideal for nature lovers and wine enthusiasts seeking tranquility and beauty. | Pienza, Montalcino, Vignoni Terme, Cappella della Madonna di Vitaleta, Wineries in Montalcino |
| Via Francigena | A historic pilgrimage route passing through Buonconvento, attracting walkers and cyclists. Great for those looking for adventure and a connection to nature. | The Pilgrims' Trail, Local rural landscapes, Cultural heritage sites along the route, Charming small villages, Gastronomic experiences |
| Nearby Vineyards | The vicinity of Buonconvento is dotted with famous vineyards and wineries. Perfect for culinary tourism and wine tasting experiences. | Castello Banfi, Corte Pavone, Wine tours and tastings, Local olive oil producers, Scenic vineyard views |
| Outdoor Activities | Surrounding areas of Buonconvento offer opportunities for hiking, biking, and exploring nature. Attracts outdoor enthusiasts looking for active vacations. | Montagnola Senese, Biking trails, Hiking paths, Nature reserves, Picnic spots |
| Local Festivals | Buonconvento hosts various festivals throughout the year that draw visitors interested in local culture and traditions. Unique experiences for tourists. | Sagra della Bresaola, Palio di Buonconvento, Various local food festivals, Street markets, Craft fairs |
| Culinary Tours | The area is famous for its rich culinary heritage. Culinary tours offer tourists a chance to immerse themselves in local flavors and cuisine. | Cooking classes, Local markets, Farm-to-table experiences, Traditional trattorias, Food and wine pairing events |
| Art and Culture | Buonconvento and the surrounding areas are rich in art and culture, offering a window into Tuscany's artistic heritage. Great for tourists interested in the arts. | Local art galleries, Historic churches, Artisan workshops, Cultural events, Traditional crafts |
Understanding Airbnb License Requirements & STR Laws in Buonconvento (2026)
Yes, Buonconvento, Tuscany, Italy enforces high STR regulations. Obtaining a license and ensuring compliance is almost certainly required according to current 2026 STR laws. Always verify the latest short term rental regulations and Airbnb license requirements directly with local government authorities for Buonconvento to ensure full compliance before hosting.
(Source: AirROI data, 2026, based on 97% licensed listings)
Top Performing Airbnb Properties in Buonconvento (2026)
Benchmark your potential! Explore examples of top-performing Airbnb properties in Buonconventobased on Trailing Twelve Month (TTM) revenue. Analyze their characteristics, revenue, occupancy rate, and ADR to understand what drives success in this market.
Podere Maiano - Pool Villa with 9 Bdrs and Spa
Entire Place • 9 bedrooms
Villa of Montesoli
Entire Place • 9 bedrooms

Il Fienile - Pool Villa with 4 Bdrs and Sauna
Entire Place • 4 bedrooms

Beautiful tuscan country house
Entire Place • 5 bedrooms

Villa Bergamotti | Pool, Comfort and View
Entire Place • 7 bedrooms
Villa Aiale - A Restored Masterpiece in Tuscany
Entire Place • 7 bedrooms
Note: Performance varies based on location, size, amenities, seasonality, and management quality. Data reflects the past 12 months.
Top Performing Airbnb Hosts in Buonconvento (2026)
Learn from the best! This table showcases top-performing Airbnb hosts in Buonconvento based on the number of properties managed and estimated total revenue over the past year. Analyze their scale and performance metrics.
| Host Name | Properties | Grossing Revenue | Stay Reviews | Avg Rating |
|---|---|---|---|---|
| Pietro | 6 | $832,393 | 146 | 4.98/5.0 |
| Serena | 6 | $285,561 | 708 | 4.86/5.0 |
| Violante | 2 | $150,624 | 17 | 4.81/5.0 |
| Anna | 1 | $137,568 | 15 | 5.00/5.0 |
| Resté Italy S.R.L. | 1 | $128,246 | 4 | 5.00/5.0 |
| Luana | 3 | $94,682 | 97 | 4.85/5.0 |
| Lisa - Interhome | 2 | $92,058 | 9 | 4.00/5.0 |
| Elena | 1 | $75,901 | 65 | 4.92/5.0 |
| Virginia E Aurora | 2 | $56,280 | 120 | 4.87/5.0 |
| Itinere Villas | 1 | $55,200 | 2 | Not Rated |
Analyzing the strategies of top hosts, such as their property selection, pricing, and guest communication, can offer valuable lessons for optimizing your own Airbnb operations in Buonconvento.
Dive Deeper: Advanced Buonconvento STR Market Data (2026)
Ready to unlock more insights? AirROI provides access to advanced metrics and comprehensive Airbnb data for Buonconvento. Explore detailed analytics beyond this report to refine your investment strategy, optimize pricing, and maximize your vacation rental profits.
Explore Advanced MetricsBuonconvento Short-Term Rental Market Composition (2026): Property & Room Types
Room Type Distribution
Property Type Distribution
Market Composition Insights for Buonconvento
- The Buonconvento Airbnb market composition is heavily skewed towards Entire Home/Apt listings, which make up 80% of the 60 active rentals. This indicates strong guest preference for privacy and space.
- Looking at the property type distribution in Buonconvento, House properties are the most common (48.3%), reflecting the local real estate landscape.
- Houses represent a significant 48.3% portion, catering likely to families or larger groups.
- Smaller segments like others, hotel/boutique (combined 5.0%) offer potential for unique stay experiences.
Buonconvento Airbnb Room Capacity Analysis (2026): Bedroom Distribution
Distribution of Listings by Number of Bedrooms
Room Capacity Insights for Buonconvento
- The dominant room capacity in Buonconvento is 1 bedroom listings, making up 35% of the market. This suggests a strong demand for properties suitable for couples or solo travelers.
- Together, 1 bedroom and 5+ bedrooms properties represent 56.7% of the active Airbnb listings in Buonconvento, indicating a high concentration in these sizes.
- A significant 36.7% of listings offer 3+ bedrooms, catering to larger groups and families seeking more space in Buonconvento.
Buonconvento Vacation Rental Guest Capacity Trends (2026)
Distribution of Listings by Guest Capacity
Guest Capacity Insights for Buonconvento
- The most common guest capacity trend in Buonconvento vacation rentals is listings accommodating 8+ guests (31.7%). This suggests the primary traveler segment is likely larger groups.
- Properties designed for 8+ guests and 2 guests dominate the Buonconvento STR market, accounting for 51.7% of listings.
- 40.1% of properties accommodate 6+ guests, serving the market segment for larger families or group travel in Buonconvento.
- On average, properties in Buonconvento are equipped to host 4.4 guests.
Buonconvento Airbnb Booking Patterns (2026): Available vs. Booked Days
Available Days Distribution
Booked Days Distribution
Booking Pattern Insights for Buonconvento
- The most common availability pattern in Buonconvento falls within the 271-366 days range, representing 55% of listings. This suggests many properties have significant open periods on their calendars.
- Approximately 83.3% of listings show high availability (181+ days open annually), indicating potential for increased bookings or specific owner usage patterns.
- For booked days, the 31-90 days range is most frequent in Buonconvento (36.7%), reflecting common guest stay durations or potential owner blocking patterns.
- A notable 16.6% of properties secure long booking periods (181+ days booked per year), highlighting successful long-term rental strategies or significant owner usage.
Buonconvento Airbnb Minimum Stay Requirements Analysis
Distribution of Listings by Minimum Night Requirement
1 Night
9 listings
15% of total
2 Nights
9 listings
15% of total
3 Nights
2 listings
3.3% of total
4-6 Nights
6 listings
10% of total
7-29 Nights
9 listings
15% of total
30+ Nights
25 listings
41.7% of total
Key Insights
- The most prevalent minimum stay requirement in Buonconvento is 30+ Nights, adopted by 41.7% of listings. This highlights the market's preference for longer commitments.
- A significant segment (41.7%) caters to monthly stays (30+ nights) in Buonconvento, pointing to opportunities in the extended-stay market.
Recommendations
- Align with the market by considering a 30+ Nights minimum stay, as 41.7% of Buonconvento hosts use this setting.
- If feasible, allowing 1-night stays, especially midweek or during low season, could capture last-minute bookings, as only 15% currently do.
- Explore offering discounts for stays of 30+ nights to attract the 41.7% of the market seeking extended stays.
- Adjust minimum nights based on seasonality – potentially shorter during low season and longer during peak demand periods in Buonconvento.
Buonconvento Airbnb Cancellation Policy Trends Analysis (2026)
Super Strict 30 Days
2 listings
3.3% of total
Super Strict 60 Days
5 listings
8.3% of total
Flexible
19 listings
31.7% of total
Moderate
16 listings
26.7% of total
Firm
16 listings
26.7% of total
Strict
2 listings
3.3% of total
Cancellation Policy Insights for Buonconvento
- The prevailing Airbnb cancellation policy trend in Buonconvento is Flexible, used by 31.7% of listings.
- There's a relatively balanced mix between guest-friendly (58.4%) and stricter (30.0%) policies, offering choices for different guest needs.
- Strict cancellation policies are quite rare (3.3%), potentially making listings with this policy less competitive unless justified by high demand or property type.
Recommendations for Hosts
- Consider adopting a Flexible policy to align with the 31.7% market standard in Buonconvento.
- Using a Strict policy might deter some guests, as only 3.3% of listings use it. Evaluate if potential revenue protection outweighs possible lower booking rates.
- Regularly review your cancellation policy against competitors and market demand shifts in Buonconvento.
Buonconvento STR Booking Lead Time Analysis (2026)
Average Booking Lead Time by Month
Booking Lead Time Insights for Buonconvento
- The overall average booking lead time for vacation rentals in Buonconvento is 78 days.
- Guests book furthest in advance for stays during August (average 104 days), likely coinciding with peak travel demand or local events.
- The shortest booking windows occur for stays in January (average 47 days), indicating more last-minute travel plans during this time.
- Seasonally, Summer (89 days avg.) sees the longest lead times, while Winter (64 days avg.) has the shortest, reflecting typical travel planning cycles.
Recommendations for Hosts
- Use the overall average lead time (78 days) as a baseline for your pricing and availability strategy in Buonconvento.
- For August stays, consider implementing length-of-stay discounts or slightly higher rates for bookings made less than 104 days out to capitalize on advance planning.
- Target marketing efforts for the Summer season well in advance (at least 89 days) to capture early planners.
- Monitor your own booking lead times against these Buonconvento averages to identify opportunities for dynamic pricing adjustments.
Popular & Essential Airbnb Amenities in Buonconvento (2026)
Amenity Prevalence
Amenity Insights for Buonconvento
- Essential amenities in Buonconvento that guests expect include: Hair dryer. Lacking these (this) could significantly impact bookings.
- Popular amenities like Heating, TV, Refrigerator are common but not universal. Offering these can provide a competitive edge.
- Warning: Wifi is not universally provided but is considered essential globally. Ensure reliable Wifi is offered.
Recommendations for Hosts
- Ensure your listing includes all essential amenities for Buonconvento: Hair dryer.
- Prioritize adding missing essentials: Hair dryer.
- Consider adding popular differentiators like Heating or TV to increase appeal.
- Highlight unique or less common amenities you offer (e.g., hot tub, dedicated workspace, EV charger) in your listing description and photos.
- Regularly check competitor amenities in Buonconvento to stay competitive.
Buonconvento Airbnb Guest Demographics & Profile Analysis (2026)
Guest Profile Summary for Buonconvento
- The typical guest profile for Airbnb in Buonconvento consists of predominantly international visitors (91%), with top international origins including Italy, typically belonging to the Post-2000s (Gen Z/Alpha) group (50%), primarily speaking English or German.
- Domestic travelers account for 9.1% of guests.
- Key international markets include United States (26.4%) and Italy (9.1%).
- Top languages spoken are English (47.1%) followed by German (10.4%).
- A significant demographic segment is the Post-2000s (Gen Z/Alpha) group, representing 50% of guests.
Recommendations for Hosts
- Focus marketing internationally, particularly towards travelers from Italy.
- Tailor amenities and listing descriptions to appeal to the dominant Post-2000s (Gen Z/Alpha) demographic (e.g., highlight fast WiFi, smart home features, local guides).
- Highlight unique local experiences or amenities relevant to the primary guest profile.
- Consider seasonal promotions aligned with peak travel times for key origin markets.
Nearby Short-Term Rental Market Comparison
How does the Buonconvento Airbnb market stack up against its neighbors? Compare key performance metrics like average monthly revenue, ADR, and occupancy rates in surrounding areas to understand the broader regional STR landscape.
| Market | Active Properties | Monthly Revenue | Daily Rate | Avg. Occupancy |
|---|---|---|---|---|
| Tignano | 12 | $4,160 | $366.92 | 45% |
| Celleno | 13 | $4,041 | $594.80 | 28% |
| Marciano della Chiana | 17 | $3,823 | $545.25 | 35% |
| Castelfranco di Sotto | 47 | $3,777 | $377.39 | 39% |
| Collevecchio | 14 | $3,140 | $334.97 | 40% |
| Radda in Chianti | 94 | $3,098 | $361.57 | 39% |
| Palombara Sabina | 15 | $2,914 | $309.11 | 38% |
| Impruneta | 146 | $2,887 | $297.45 | 40% |
| Lastra a Signa | 96 | $2,760 | $311.91 | 43% |
| Florence | 10,496 | $2,755 | $225.30 | 49% |