Comano Airbnb Market Analysis 2026: Short Term Rental Data & Vacation Rental Statistics in Tuscany, Italy
Is Airbnb profitable in Comano in 2026? Explore comprehensive Airbnb analytics for Comano, Tuscany, Italy to uncover income potential. This 2026 STR market report for Comano, based on AirROI data from February 2025 to January 2026, reveals key trends in the niche market of 23 active listings.
Whether you're considering an Airbnb investment in Comano, optimizing your existing vacation rental, or exploring rental arbitrage opportunities, understanding the Comano Airbnb data is crucial. Navigating the high regulation landscape is key to maximizing your short term rental income potential. Let's dive into the specifics.
Key Comano Airbnb Performance Metrics Overview
Monthly Airbnb Revenue Variations & Income Potential in Comano (2026)
Understanding the monthly revenue variations for Airbnb listings in Comano is key to maximizing your short term rental income potential. Seasonality significantly impacts earnings. Our analysis, based on data from the past 12 months, shows that the peak revenue month for STRs in Comano is typically July, while April often presents the lowest earnings, highlighting opportunities for strategic pricing adjustments during shoulder and low seasons. Explore the typical Airbnb income in Comano across different performance tiers:
- Best-in-class properties (Top 10%) achieve $3,508+ monthly, often utilizing dynamic pricing and superior guest experiences.
- Strong performing properties (Top 25%) earn $2,341 or more, indicating effective management and desirable locations/amenities.
- Typical properties (Median) generate around $1,341 per month, representing the average market performance.
- Entry-level properties (Bottom 25%) see earnings around $800, often with potential for optimization.
Average Monthly Airbnb Earnings Trend in Comano
Comano Airbnb Occupancy Rate Trends (2026)
Maximize your bookings by understanding the Comano STR occupancy trends. Seasonal demand shifts significantly influence how often properties are booked. Typically, Julysees the highest demand (peak season occupancy), while February experiences the lowest (low season). Effective strategies, like adjusting minimum stays or offering promotions, can boost occupancy during slower periods. Here's how different property tiers perform in Comano:
- Best-in-class properties (Top 10%) achieve 73%+ occupancy, indicating high desirability and potentially optimized availability.
- Strong performing properties (Top 25%) maintain 55% or higher occupancy, suggesting good market fit and guest satisfaction.
- Typical properties (Median) have an occupancy rate around 32%.
- Entry-level properties (Bottom 25%) average 22% occupancy, potentially facing higher vacancy.
Average Monthly Occupancy Rate Trend in Comano
Average Daily Rate (ADR) Airbnb Trends in Comano (2026)
Effective short term rental pricing strategy in Comano involves understanding monthly ADR fluctuations. The Average Daily Rate (ADR) for Airbnb in Comano typically peaks in December and dips lowest during April. Leveraging Airbnb dynamic pricing tools or strategies based on this seasonality can significantly boost revenue. Here's a look at the typical nightly rates achieved:
- Best-in-class properties (Top 10%) command rates of $393+ per night, often due to premium features or locations.
- Strong performing properties (Top 25%) achieve nightly rates of $236 or more.
- Typical properties (Median) charge around $150 per night.
- Entry-level properties (Bottom 25%) earn around $108 per night.
Average Daily Rate (ADR) Trend by Month in Comano
Get Live Comano Market Intelligence 👇

Explore Real-time Analytics
Airbnb Seasonality Analysis & Trends in Comano (2026)
Peak Season (July, August, September)
- Revenue averages $3,264 per month
- Occupancy rates average 54.9%
- Daily rates average $196
Shoulder Season
- Revenue averages $1,566 per month
- Occupancy maintains around 39.9%
- Daily rates hold near $199
Low Season (February, April, December)
- Revenue drops to average $743 per month
- Occupancy decreases to average 26.3%
- Daily rates adjust to average $194
Seasonality Insights for Comano
- The Airbnb seasonality in Comano shows highly seasonal trends requiring careful strategy. While the sections above show seasonal averages, it's also insightful to look at the extremes:
- During the high season, the absolute peak month showcases Comano's highest earning potential, with monthly revenues capable of climbing to $3,979, occupancy reaching a high of 67.9%, and ADRs peaking at $214.
- Conversely, the slowest single month of the year, typically falling within the low season, marks the market's lowest point. In this month, revenue might dip to $726, occupancy could drop to 18.8%, and ADRs may adjust down to $182.
- Understanding both the seasonal averages and these monthly peaks and troughs in revenue, occupancy, and ADR is crucial for maximizing your Airbnb profit potential in Comano.
Seasonal Strategies for Maximizing Profit
- Peak Season: Maximize revenue through premium pricing and potentially longer minimum stays. Ensure high availability.
- Low Season: Offer competitive pricing, special promotions (e.g., extended stay discounts), and flexible cancellation policies. Target off-season travelers like remote workers or budget-conscious guests.
- Shoulder Seasons: Implement dynamic pricing that balances peak and low rates. Target weekend travelers or specific events. Offer slightly more flexible terms than peak season.
- Regularly analyze your own performance against these Comano seasonality benchmarks and adjust your pricing and availability strategy accordingly.
Best Areas for Airbnb Investment in Comano (2026)
Exploring the top neighborhoods for short-term rentals in Comano? This section highlights key areas, outlining why they are attractive for hosts and guests, along with notable local attractions. Consider these locations based on your target guest profile and investment strategy.
| Neighborhood / Area | Why Host Here? (Target Guests & Appeal) | Key Attractions & Landmarks |
|---|---|---|
| Comano Terme | Known for its relaxing thermal spas and wellness centers, Comano Terme attracts visitors seeking health treatments and tranquility in a picturesque setting. | Comano Terme Spa, Parco Termale Giardino Botanico, Castello di Stenico, Ponte di San Lorenzo, Chiesa di San Giovanni Battista |
| Molveno | A beautiful alpine village on the shores of Lake Molveno, perfect for nature lovers and outdoor enthusiasts. Great for summer hiking and winter skiing. | Lake Molveno, Brenta Dolomites, Molveno's beach, Paganella Ski Area, Hiking trails |
| Riva del Garda | A popular destination on the northern shore of Lake Garda. Offers stunning scenery, water sports, and a vibrant historical center. | Rocca di Riva, Lake Garda, Piazza 3 Novembre, Torre Apponale, Museum Alto Garda |
| Dro | A charming town known for its rock climbing spots and cultural heritage. Attractive for sports enthusiasts and those seeking authenticity. | Climbing routes in the Sarca Valley, Castello di Dro, Chiesa di San Bartolomeo, Grotte di Castello di Drena, Dro Historic Center |
| Tione di Trento | Situated in the Giudicarie Valley, Tione is a base for exploring the Brenta Dolomites and is popular with outdoor adventurers. | Val Giudicarie, Tione's historical sites, Hiking trails, Local cuisine, Markets |
| Folgaria | A mountain resort known for skiing and hiking, Folgaria is a great winter and summer destination, appealing to families and sports lovers. | Folgaria Ski Area, Hiking paths, Golf Club Folgaria, Lake Lavarone, Folgaria historical center |
| Laghi di Avio | Known for its stunning lakes and wellness offerings, Avio is becoming increasingly popular among tourists looking for relaxation amid nature. | Lago di Cei, Lago di Lavarone, Lakes and trails, Nature parks, Local farms |
| Tenno | Famous for its picturesque Lake Tenno, this area is perfect for those seeking outdoor activities, photography, and cultural immersion. | Lake Tenno, Canale di Tenno, Castello di Tenno, Historic village, Nature trails |
Understanding Airbnb License Requirements & STR Laws in Comano (2026)
Yes, Comano, Tuscany, Italy enforces high STR regulations. Obtaining a license and ensuring compliance is almost certainly required according to current 2026 STR laws. Always verify the latest short term rental regulations and Airbnb license requirements directly with local government authorities for Comano to ensure full compliance before hosting.
(Source: AirROI data, 2026, based on 87% licensed listings)
Top Performing Airbnb Properties in Comano (2026)
Benchmark your potential! Explore examples of top-performing Airbnb properties in Comanobased on Trailing Twelve Month (TTM) revenue. Analyze their characteristics, revenue, occupancy rate, and ADR to understand what drives success in this market.

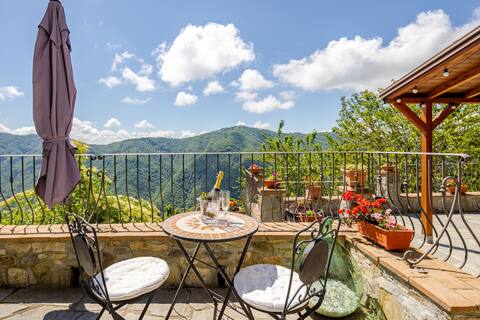
Greta's Mill, Landhaus am Fluss
Entire Place • 3 bedrooms

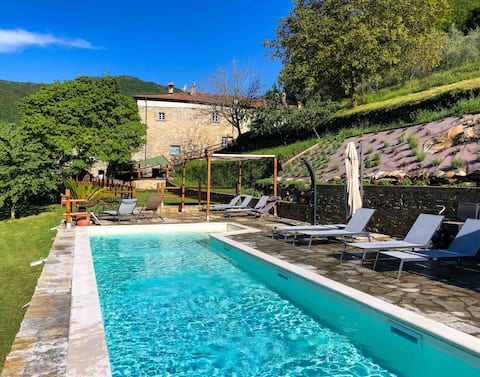
Tuscan Villa with large Private Pool and Garden
Entire Place • 4 bedrooms
The Barn
Entire Place • 1 bedroom
Cosy apartment in Tuscany Lunigiana & 5Terre
Entire Place • 1 bedroom
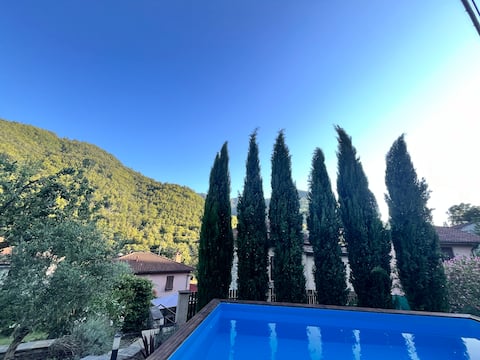
Fabulous family home with private Swimming Pool
Entire Place • 4 bedrooms

Apartament in Tuscany "Il fienile"
Entire Place • 2 bedrooms
Note: Performance varies based on location, size, amenities, seasonality, and management quality. Data reflects the past 12 months.
Top Performing Airbnb Hosts in Comano (2026)
Learn from the best! This table showcases top-performing Airbnb hosts in Comano based on the number of properties managed and estimated total revenue over the past year. Analyze their scale and performance metrics.
| Host Name | Properties | Grossing Revenue | Stay Reviews | Avg Rating |
|---|---|---|---|---|
| Agriturismo Casa Turchetti | 6 | $69,253 | 437 | 4.79/5.0 |
| Katja | 1 | $40,875 | 20 | 4.95/5.0 |
| Giulia | 1 | $26,737 | 99 | 4.87/5.0 |
| Craig | 1 | $23,962 | 60 | 5.00/5.0 |
| Isabella | 1 | $19,934 | 47 | 4.81/5.0 |
| Novasol | 2 | $16,993 | 16 | 4.67/5.0 |
| David | 1 | $16,696 | 39 | 4.87/5.0 |
| Giulia | 1 | $15,718 | 10 | 4.90/5.0 |
| Alice E Valeria | 1 | $11,402 | 25 | 4.84/5.0 |
| Agriturismo I Chiosi | 2 | $11,058 | 9 | 5.00/5.0 |
Analyzing the strategies of top hosts, such as their property selection, pricing, and guest communication, can offer valuable lessons for optimizing your own Airbnb operations in Comano.
Dive Deeper: Advanced Comano STR Market Data (2026)
Ready to unlock more insights? AirROI provides access to advanced metrics and comprehensive Airbnb data for Comano. Explore detailed analytics beyond this report to refine your investment strategy, optimize pricing, and maximize your vacation rental profits.
Explore Advanced MetricsComano Short-Term Rental Market Composition (2026): Property & Room Types
Room Type Distribution
Property Type Distribution
Market Composition Insights for Comano
- The Comano Airbnb market composition is heavily skewed towards Entire Home/Apt listings, which make up 87% of the 23 active rentals. This indicates strong guest preference for privacy and space.
- Looking at the property type distribution in Comano, Apartment/Condo properties are the most common (34.8%), reflecting the local real estate landscape.
- Houses represent a significant 34.8% portion, catering likely to families or larger groups.
- The presence of 13% Hotel/Boutique listings indicates integration with traditional hospitality.
Comano Airbnb Room Capacity Analysis (2026): Bedroom Distribution
Distribution of Listings by Number of Bedrooms
Room Capacity Insights for Comano
- The dominant room capacity in Comano is 1 bedroom listings, making up 47.8% of the market. This suggests a strong demand for properties suitable for couples or solo travelers.
- Together, 1 bedroom and 4 bedrooms properties represent 60.8% of the active Airbnb listings in Comano, indicating a high concentration in these sizes.
- A significant 34.7% of listings offer 3+ bedrooms, catering to larger groups and families seeking more space in Comano.
Comano Vacation Rental Guest Capacity Trends (2026)
Distribution of Listings by Guest Capacity
Guest Capacity Insights for Comano
- The most common guest capacity trend in Comano vacation rentals is listings accommodating 2 guests (26.1%). This suggests the primary traveler segment is likely couples or solo travelers.
- Properties designed for 2 guests and 8+ guests dominate the Comano STR market, accounting for 43.5% of listings.
- 34.7% of properties accommodate 6+ guests, serving the market segment for larger families or group travel in Comano.
- On average, properties in Comano are equipped to host 4.4 guests.
Comano Airbnb Booking Patterns (2026): Available vs. Booked Days
Available Days Distribution
Booked Days Distribution
Booking Pattern Insights for Comano
- The most common availability pattern in Comano falls within the 271-366 days range, representing 82.6% of listings. This suggests many properties have significant open periods on their calendars.
- Approximately 95.6% of listings show high availability (181+ days open annually), indicating potential for increased bookings or specific owner usage patterns.
- For booked days, the 31-90 days range is most frequent in Comano (47.8%), reflecting common guest stay durations or potential owner blocking patterns.
- A notable 4.3% of properties secure long booking periods (181+ days booked per year), highlighting successful long-term rental strategies or significant owner usage.
Comano Airbnb Minimum Stay Requirements Analysis
Distribution of Listings by Minimum Night Requirement
2 Nights
3 listings
13% of total
3 Nights
2 listings
8.7% of total
4-6 Nights
5 listings
21.7% of total
7-29 Nights
3 listings
13% of total
30+ Nights
10 listings
43.5% of total
Key Insights
- The most prevalent minimum stay requirement in Comano is 30+ Nights, adopted by 43.5% of listings. This highlights the market's preference for longer commitments.
- Very short stays (1-2 nights) are less common (13.0%), suggesting hosts prefer slightly longer bookings to optimize turnover.
- A significant segment (43.5%) caters to monthly stays (30+ nights) in Comano, pointing to opportunities in the extended-stay market.
Recommendations
- Align with the market by considering a 30+ Nights minimum stay, as 43.5% of Comano hosts use this setting.
- Explore offering discounts for stays of 30+ nights to attract the 43.5% of the market seeking extended stays.
- Adjust minimum nights based on seasonality – potentially shorter during low season and longer during peak demand periods in Comano.
Comano Airbnb Cancellation Policy Trends Analysis (2026)
Super Strict 60 Days
3 listings
13% of total
Flexible
7 listings
30.4% of total
Moderate
3 listings
13% of total
Firm
4 listings
17.4% of total
Strict
6 listings
26.1% of total
Cancellation Policy Insights for Comano
- The prevailing Airbnb cancellation policy trend in Comano is Flexible, used by 30.4% of listings.
- There's a relatively balanced mix between guest-friendly (43.4%) and stricter (43.5%) policies, offering choices for different guest needs.
Recommendations for Hosts
- Consider adopting a Flexible policy to align with the 30.4% market standard in Comano.
- Regularly review your cancellation policy against competitors and market demand shifts in Comano.
Comano STR Booking Lead Time Analysis (2026)
Average Booking Lead Time by Month
Booking Lead Time Insights for Comano
- The overall average booking lead time for vacation rentals in Comano is 77 days.
- Guests book furthest in advance for stays during July (average 100 days), likely coinciding with peak travel demand or local events.
- The shortest booking windows occur for stays in January (average 0 days), indicating more last-minute travel plans during this time.
- Seasonally, Summer (82 days avg.) sees the longest lead times, while Spring (29 days avg.) has the shortest, reflecting typical travel planning cycles.
Recommendations for Hosts
- Use the overall average lead time (77 days) as a baseline for your pricing and availability strategy in Comano.
- For July stays, consider implementing length-of-stay discounts or slightly higher rates for bookings made less than 100 days out to capitalize on advance planning.
- During January, focus on last-minute booking availability and promotions, as guests book with very short notice (0 days avg.).
- Target marketing efforts for the Summer season well in advance (at least 82 days) to capture early planners.
- Monitor your own booking lead times against these Comano averages to identify opportunities for dynamic pricing adjustments.
Popular & Essential Airbnb Amenities in Comano (2026)
Amenity Prevalence
Amenity Insights for Comano
- Essential amenities in Comano that guests expect include: Wifi. Lacking these (this) could significantly impact bookings.
- Popular amenities like Heating, Refrigerator, Pets allowed are common but not universal. Offering these can provide a competitive edge.
Recommendations for Hosts
- Ensure your listing includes all essential amenities for Comano: Wifi.
- Consider adding popular differentiators like Heating or Refrigerator to increase appeal.
- Highlight unique or less common amenities you offer (e.g., hot tub, dedicated workspace, EV charger) in your listing description and photos.
- Regularly check competitor amenities in Comano to stay competitive.
Comano Airbnb Guest Demographics & Profile Analysis (2026)
Guest Profile Summary for Comano
- The typical guest profile for Airbnb in Comano consists of predominantly international visitors (97%), with top international origins including United Kingdom, typically belonging to the Post-2000s (Gen Z/Alpha) group (50%), primarily speaking English or German.
- Domestic travelers account for 3.3% of guests.
- Key international markets include Germany (20%) and United Kingdom (18.3%).
- Top languages spoken are English (40.7%) followed by German (18.6%).
- A significant demographic segment is the Post-2000s (Gen Z/Alpha) group, representing 50% of guests.
Recommendations for Hosts
- Focus marketing internationally, particularly towards travelers from United Kingdom.
- Tailor amenities and listing descriptions to appeal to the dominant Post-2000s (Gen Z/Alpha) demographic (e.g., highlight fast WiFi, smart home features, local guides).
- Highlight unique local experiences or amenities relevant to the primary guest profile.
- Consider seasonal promotions aligned with peak travel times for key origin markets.
Nearby Short-Term Rental Market Comparison
How does the Comano Airbnb market stack up against its neighbors? Compare key performance metrics like average monthly revenue, ADR, and occupancy rates in surrounding areas to understand the broader regional STR landscape.
| Market | Active Properties | Monthly Revenue | Daily Rate | Avg. Occupancy |
|---|---|---|---|---|
| Laglio | 64 | $4,334 | $518.58 | 43% |
| Tignano | 12 | $4,160 | $366.92 | 45% |
| Marciano della Chiana | 17 | $3,823 | $545.25 | 35% |
| Castelfranco di Sotto | 47 | $3,777 | $377.39 | 39% |
| Portofino | 77 | $3,585 | $509.42 | 38% |
| Bellagio | 461 | $3,466 | $325.87 | 49% |
| Sala Comacina | 73 | $3,332 | $451.20 | 46% |
| Carate Urio | 76 | $3,200 | $362.97 | 41% |
| Oliveto Lario | 105 | $3,198 | $389.82 | 48% |
| Buonconvento | 60 | $3,186 | $440.58 | 43% |