Cutigliano Airbnb Market Analysis 2025: Short Term Rental Data & Vacation Rental Statistics in Tuscany, Italy
Is Airbnb profitable in Cutigliano in 2025? Explore comprehensive Airbnb analytics for Cutigliano, Tuscany, Italy to uncover income potential. This 2025 STR market report for Cutigliano, based on AirROI data from July 2024 to June 2025, reveals key trends in the niche market of 19 active listings.
Whether you're considering an Airbnb investment in Cutigliano, optimizing your existing vacation rental, or exploring rental arbitrage opportunities, understanding the Cutigliano Airbnb data is crucial. Leveraging the low regulation environment is key to maximizing your short term rental income potential. Let's dive into the specifics.
Key Cutigliano Airbnb Performance Metrics Overview
Monthly Airbnb Revenue Variations & Income Potential in Cutigliano (2025)
Understanding the monthly revenue variations for Airbnb listings in Cutigliano is key to maximizing your short term rental income potential. Seasonality significantly impacts earnings. Our analysis, based on data from the past 12 months, shows that the peak revenue month for STRs in Cutigliano is typically August, while March often presents the lowest earnings, highlighting opportunities for strategic pricing adjustments during shoulder and low seasons. Explore the typical Airbnb income in Cutigliano across different performance tiers:
- Best-in-class properties (Top 10%) achieve $3,031+ monthly, often utilizing dynamic pricing and superior guest experiences.
- Strong performing properties (Top 25%) earn $2,079 or more, indicating effective management and desirable locations/amenities.
- Typical properties (Median) generate around $1,168 per month, representing the average market performance.
- Entry-level properties (Bottom 25%) see earnings around $651, often with potential for optimization.
Average Monthly Airbnb Earnings Trend in Cutigliano
Cutigliano Airbnb Occupancy Rate Trends (2025)
Maximize your bookings by understanding the Cutigliano STR occupancy trends. Seasonal demand shifts significantly influence how often properties are booked. Typically, Augustsees the highest demand (peak season occupancy), while March experiences the lowest (low season). Effective strategies, like adjusting minimum stays or offering promotions, can boost occupancy during slower periods. Here's how different property tiers perform in Cutigliano:
- Best-in-class properties (Top 10%) achieve 60%+ occupancy, indicating high desirability and potentially optimized availability.
- Strong performing properties (Top 25%) maintain 49% or higher occupancy, suggesting good market fit and guest satisfaction.
- Typical properties (Median) have an occupancy rate around 28%.
- Entry-level properties (Bottom 25%) average 11% occupancy, potentially facing higher vacancy.
Average Monthly Occupancy Rate Trend in Cutigliano
Average Daily Rate (ADR) Airbnb Trends in Cutigliano (2025)
Effective short term rental pricing strategy in Cutigliano involves understanding monthly ADR fluctuations. The Average Daily Rate (ADR) for Airbnb in Cutigliano typically peaks in January and dips lowest during April. Leveraging Airbnb dynamic pricing tools or strategies based on this seasonality can significantly boost revenue. Here's a look at the typical nightly rates achieved:
- Best-in-class properties (Top 10%) command rates of $225+ per night, often due to premium features or locations.
- Strong performing properties (Top 25%) achieve nightly rates of $166 or more.
- Typical properties (Median) charge around $118 per night.
- Entry-level properties (Bottom 25%) earn around $91 per night.
Average Daily Rate (ADR) Trend by Month in Cutigliano
Get Live Cutigliano Market Intelligence 👇
Explore Real-time Analytics
Airbnb Seasonality Analysis & Trends in Cutigliano (2025)
Peak Season (August, February, July)
- Revenue averages $2,589 per month
- Occupancy rates average 58.4%
- Daily rates average $163
Shoulder Season
- Revenue averages $1,395 per month
- Occupancy maintains around 30.6%
- Daily rates hold near $157
Low Season (January, March, December)
- Revenue drops to average $678 per month
- Occupancy decreases to average 12.6%
- Daily rates adjust to average $162
Seasonality Insights for Cutigliano
- The Airbnb seasonality in Cutigliano shows highly seasonal trends requiring careful strategy. While the sections above show seasonal averages, it's also insightful to look at the extremes:
- During the high season, the absolute peak month showcases Cutigliano's highest earning potential, with monthly revenues capable of climbing to $3,229, occupancy reaching a high of 66.8%, and ADRs peaking at $177.
- Conversely, the slowest single month of the year, typically falling within the low season, marks the market's lowest point. In this month, revenue might dip to $468, occupancy could drop to 9.7%, and ADRs may adjust down to $139.
- Understanding both the seasonal averages and these monthly peaks and troughs in revenue, occupancy, and ADR is crucial for maximizing your Airbnb profit potential in Cutigliano.
Seasonal Strategies for Maximizing Profit
- Peak Season: Maximize revenue through premium pricing and potentially longer minimum stays. Ensure high availability.
- Low Season: Offer competitive pricing, special promotions (e.g., extended stay discounts), and flexible cancellation policies. Target off-season travelers like remote workers or budget-conscious guests.
- Shoulder Seasons: Implement dynamic pricing that balances peak and low rates. Target weekend travelers or specific events. Offer slightly more flexible terms than peak season.
- Regularly analyze your own performance against these Cutigliano seasonality benchmarks and adjust your pricing and availability strategy accordingly.
Best Areas for Airbnb Investment in Cutigliano (2025)
Exploring the top neighborhoods for short-term rentals in Cutigliano? This section highlights key areas, outlining why they are attractive for hosts and guests, along with notable local attractions. Consider these locations based on your target guest profile and investment strategy.
| Neighborhood / Area | Why Host Here? (Target Guests & Appeal) | Key Attractions & Landmarks |
|---|---|---|
| Cutigliano Center | The heart of Cutigliano, featuring quaint streets, local shops, and a unique charm. It attracts tourists who wish to immerse themselves in the local culture and enjoy convenient access to various amenities. | Cutigliano Town Hall, Local artisan shops, Restaurants with traditional Tuscan cuisine, Nearby hiking trails, Cutigliano's annual events |
| Abetone | A popular skiing destination near Cutigliano. Ideal for winter sports enthusiasts and families looking for winter holiday rentals with access to skiing and snowboarding. | Abetone ski resort, Ski lifts and slopes, Lodging for snow sports, Scenic mountain views, Winter hiking paths |
| Montalbano | A scenic area known for its beautiful landscapes and proximity to vineyards. Attracts wine lovers and nature enthusiasts who are looking for a peaceful retreat. | Vineyards and wine tasting tours, Hiking in the hills, Scenic vistas, Local farms, Cheese and olive oil tasting |
| Pistoia Mountains | This area offers stunning mountain scenery and outdoor activities such as hiking and mountain biking, attracting nature lovers and adventure seekers. | Hiking trails, Mountain biking routes, Picnic areas, Flora and fauna observations, Stunning panoramic views |
| Casenove | A charming village close to Cutigliano, perfect for tourists looking for a tranquil stay while remaining close to attractions and nature. | Historic village center, Views of surrounding landscapes, Access to local walking paths, Small cafes and eateries, Community events |
| San Marcello Pistoiese | Nearby historical town with rich cultural heritage and proximity to natural wonders. Offers a blend of history, art, and outdoor activities. | Church of San Marcello, Local museums, Hiking and exploration opportunities, Traditional festivals, Local artisanal markets |
| Vellano | Known for its historical architecture and beautiful hillside views, attractive to visitors looking for a unique and authentic Tuscan experience. | Ancient stone houses, Local art galleries, Hiking trails, Access to nature, Community festivities |
| Piteglio | A small picturesque town offering a more tranquil setting and rich history, perfect for those looking to explore less touristy spots in Tuscany. | Historic castle, Natural parks, Local cuisine experiences, Walking paths through nature, Cultural heritage sites |
Understanding Airbnb License Requirements & STR Laws in Cutigliano (2025)
While Cutigliano, Tuscany, Italy currently shows low STR regulations, specific Airbnb license requirements might still exist or change. Always verify the latest short term rental regulations and Airbnb license requirements directly with local government authorities for Cutigliano to ensure full compliance before hosting.
(Source: AirROI data, 2025, finding no licensed listings among those analyzed)
Top Performing Airbnb Properties in Cutigliano (2025)
Benchmark your potential! Explore examples of top-performing Airbnb properties in Cutiglianobased on Trailing Twelve Month (TTM) revenue. Analyze their characteristics, revenue, occupancy rate, and ADR to understand what drives success in this market.
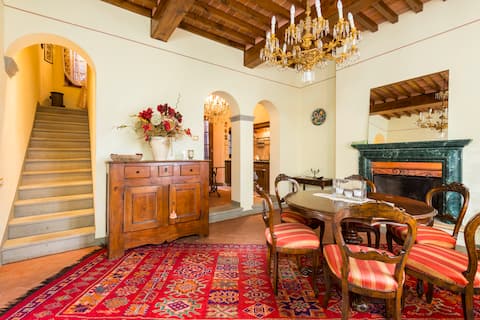
Your home in the mountains. Tuscany
Entire Place • 2 bedrooms
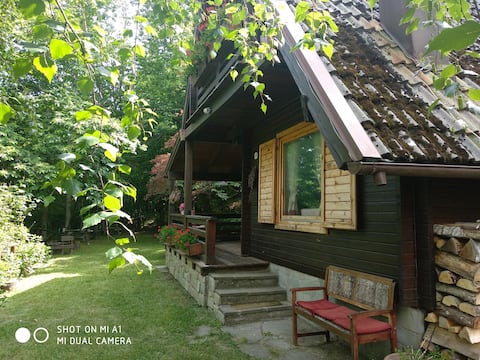
the Casina di Fata Mirtilla
Entire Place • 3 bedrooms
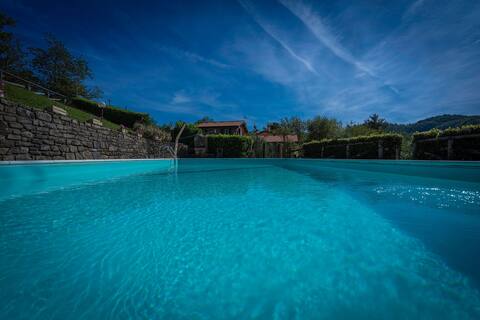
Old furnace – agriturismo plate, with poo
Entire Place • 7 bedrooms
The old furnace the flat plate - Abetone
Entire Place • 2 bedrooms

The old furnace the flat plate - Abetone
Entire Place • 2 bedrooms
OLYMPIA
Entire Place • 3 bedrooms
Note: Performance varies based on location, size, amenities, seasonality, and management quality. Data reflects the past 12 months.
Top Performing Airbnb Hosts in Cutigliano (2025)
Learn from the best! This table showcases top-performing Airbnb hosts in Cutigliano based on the number of properties managed and estimated total revenue over the past year. Analyze their scale and performance metrics.
| Host Name | Properties | Grossing Revenue | Stay Reviews | Avg Rating |
|---|---|---|---|---|
| Samantha Geco Vacation Rentals | 4 | $51,382 | 8 | 4.00/5.0 |
| Solange | 1 | $30,853 | 30 | 5.00/5.0 |
| Silvia | 2 | $25,877 | 40 | 4.84/5.0 |
| Francesco | 2 | $18,060 | 22 | 4.71/5.0 |
| Eugenio | 2 | $4,682 | 50 | 4.79/5.0 |
| Marilena | 3 | $2,956 | 5 | Not Rated |
| Niccolò | 1 | $2,766 | 2 | Not Rated |
| Roberto | 1 | $1,153 | 4 | 4.50/5.0 |
| Sandra | 1 | $947 | 4 | 4.50/5.0 |
| Isola | 1 | $634 | 3 | 4.67/5.0 |
Analyzing the strategies of top hosts, such as their property selection, pricing, and guest communication, can offer valuable lessons for optimizing your own Airbnb operations in Cutigliano.
Dive Deeper: Advanced Cutigliano STR Market Data (2025)
Ready to unlock more insights? AirROI provides access to advanced metrics and comprehensive Airbnb data for Cutigliano. Explore detailed analytics beyond this report to refine your investment strategy, optimize pricing, and maximize your vacation rental profits.
Explore Advanced MetricsCutigliano Short-Term Rental Market Composition (2025): Property & Room Types
Room Type Distribution
Property Type Distribution
Market Composition Insights for Cutigliano
- The Cutigliano Airbnb market composition is heavily skewed towards Entire Home/Apt listings, which make up 100% of the 19 active rentals. This indicates strong guest preference for privacy and space.
- Looking at the property type distribution in Cutigliano, Apartment/Condo properties are the most common (52.6%), reflecting the local real estate landscape.
- Houses represent a significant 31.6% portion, catering likely to families or larger groups.
Cutigliano Airbnb Room Capacity Analysis (2025): Bedroom Distribution
Distribution of Listings by Number of Bedrooms
Room Capacity Insights for Cutigliano
- The dominant room capacity in Cutigliano is 2 bedrooms listings, making up 47.4% of the market. This suggests a strong demand for properties suitable for couples or solo travelers.
- Together, 2 bedrooms and 3 bedrooms properties represent 73.7% of the active Airbnb listings in Cutigliano, indicating a high concentration in these sizes.
- A significant 36.9% of listings offer 3+ bedrooms, catering to larger groups and families seeking more space in Cutigliano.
Cutigliano Vacation Rental Guest Capacity Trends (2025)
Distribution of Listings by Guest Capacity
Guest Capacity Insights for Cutigliano
- The most common guest capacity trend in Cutigliano vacation rentals is listings accommodating 4 guests (31.6%). This suggests the primary traveler segment is likely small families or groups.
- Properties designed for 4 guests and 6 guests dominate the Cutigliano STR market, accounting for 52.7% of listings.
- 58.0% of properties accommodate 6+ guests, serving the market segment for larger families or group travel in Cutigliano.
- On average, properties in Cutigliano are equipped to host 5.8 guests.
Cutigliano Airbnb Booking Patterns (2025): Available vs. Booked Days
Available Days Distribution
Booked Days Distribution
Booking Pattern Insights for Cutigliano
- The most common availability pattern in Cutigliano falls within the 271-366 days range, representing 78.9% of listings. This suggests many properties have significant open periods on their calendars.
- Approximately 94.7% of listings show high availability (181+ days open annually), indicating potential for increased bookings or specific owner usage patterns.
- For booked days, the 1-30 days range is most frequent in Cutigliano (57.9%), reflecting common guest stay durations or potential owner blocking patterns.
- A notable 5.3% of properties secure long booking periods (181+ days booked per year), highlighting successful long-term rental strategies or significant owner usage.
Cutigliano Airbnb Minimum Stay Requirements Analysis
Distribution of Listings by Minimum Night Requirement
2 Nights
5 listings
31.3% of total
3 Nights
3 listings
18.8% of total
4-6 Nights
3 listings
18.8% of total
7-29 Nights
1 listings
6.3% of total
30+ Nights
4 listings
25% of total
Key Insights
- The most prevalent minimum stay requirement in Cutigliano is 2 Nights, adopted by 31.3% of listings. This highlights the market's preference for shorter, flexible bookings.
- A significant segment (25%) caters to monthly stays (30+ nights) in Cutigliano, pointing to opportunities in the extended-stay market.
Recommendations
- Align with the market by considering a 2 Nights minimum stay, as 31.3% of Cutigliano hosts use this setting.
- A 2-night minimum appears standard (31.3%). Consider this for weekends or peak periods.
- Explore offering discounts for stays of 30+ nights to attract the 25% of the market seeking extended stays.
- Adjust minimum nights based on seasonality – potentially shorter during low season and longer during peak demand periods in Cutigliano.
Cutigliano Airbnb Cancellation Policy Trends Analysis (2025)
Super Strict 30 Days
4 listings
21.1% of total
Flexible
3 listings
15.8% of total
Moderate
6 listings
31.6% of total
Strict
6 listings
31.6% of total
Cancellation Policy Insights for Cutigliano
- The prevailing Airbnb cancellation policy trend in Cutigliano is Moderate, used by 31.6% of listings.
- There's a relatively balanced mix between guest-friendly (47.4%) and stricter (31.6%) policies, offering choices for different guest needs.
Recommendations for Hosts
- Consider adopting a Moderate policy to align with the 31.6% market standard in Cutigliano.
- With 31.6% using Strict terms, this is a viable option in Cutigliano, particularly for high-value properties or during peak demand periods.
- Regularly review your cancellation policy against competitors and market demand shifts in Cutigliano.
Cutigliano STR Booking Lead Time Analysis (2025)
Average Booking Lead Time by Month
Booking Lead Time Insights for Cutigliano
- The overall average booking lead time for vacation rentals in Cutigliano is 33 days.
- Guests book furthest in advance for stays during August (average 96 days), likely coinciding with peak travel demand or local events.
- The shortest booking windows occur for stays in March (average 1 days), indicating more last-minute travel plans during this time.
- Seasonally, Summer (75 days avg.) sees the longest lead times, while Spring (16 days avg.) has the shortest, reflecting typical travel planning cycles.
Recommendations for Hosts
- Use the overall average lead time (33 days) as a baseline for your pricing and availability strategy in Cutigliano.
- For August stays, consider implementing length-of-stay discounts or slightly higher rates for bookings made less than 96 days out to capitalize on advance planning.
- During March, focus on last-minute booking availability and promotions, as guests book with very short notice (1 days avg.).
- Target marketing efforts for the Summer season well in advance (at least 75 days) to capture early planners.
- Monitor your own booking lead times against these Cutigliano averages to identify opportunities for dynamic pricing adjustments.
Popular & Essential Airbnb Amenities in Cutigliano (2025)
Amenity data is currently unavailable for Cutigliano.
Cutigliano Airbnb Guest Demographics & Profile Analysis (2025)
Guest Profile Summary for Cutigliano
- The typical guest profile for Airbnb in Cutigliano consists of a mix of domestic (37%) and international guests, with top international origins including Germany, typically belonging to the Post-2000s (Gen Z/Alpha) group (50%), primarily speaking English or German.
- Domestic travelers account for 36.8% of guests.
- Key international markets include Italy (36.8%) and Germany (15.8%).
- Top languages spoken are English (43.5%) followed by German (21.7%).
- A significant demographic segment is the Post-2000s (Gen Z/Alpha) group, representing 50% of guests.
Recommendations for Hosts
- Focus marketing internationally, particularly towards travelers from Germany.
- Tailor amenities and listing descriptions to appeal to the dominant Post-2000s (Gen Z/Alpha) demographic (e.g., highlight fast WiFi, smart home features, local guides).
- Highlight unique local experiences or amenities relevant to the primary guest profile.
- Consider seasonal promotions aligned with peak travel times for key origin markets.
Nearby Short-Term Rental Market Comparison
How does the Cutigliano Airbnb market stack up against its neighbors? Compare key performance metrics like average monthly revenue, ADR, and occupancy rates in surrounding areas to understand the broader regional STR landscape.
| Market | Active Properties | Monthly Revenue | Daily Rate | Avg. Occupancy |
|---|---|---|---|---|
| Laglio | 63 | $4,391 | $512.43 | 43% |
| Sala Comacina | 68 | $4,345 | $441.29 | 47% |
| Brenzone sul Garda | 21 | $3,503 | $324.86 | 44% |
| Oliveto Lario | 101 | $3,462 | $382.16 | 51% |
| Marciano della Chiana | 17 | $3,452 | $494.16 | 35% |
| Portofino | 72 | $3,442 | $493.88 | 40% |
| Carate Urio | 71 | $3,440 | $346.63 | 44% |
| Bellagio | 426 | $3,205 | $307.83 | 49% |
| Castelfranco di Sotto | 52 | $3,041 | $317.47 | 37% |
| Monterosso al Mare | 355 | $2,871 | $252.85 | 54% |