Forte dei Marmi Airbnb Market Analysis 2026: Short Term Rental Data & Vacation Rental Statistics in Tuscany, Italy
Is Airbnb profitable in Forte dei Marmi in 2026? Explore comprehensive Airbnb analytics for Forte dei Marmi, Tuscany, Italy to uncover income potential. This 2026 STR market report for Forte dei Marmi, based on AirROI data from February 2025 to January 2026, reveals key trends in the niche market of 187 active listings.
Whether you're considering an Airbnb investment in Forte dei Marmi, optimizing your existing vacation rental, or exploring rental arbitrage opportunities, understanding the Forte dei Marmi Airbnb data is crucial. Navigating the high regulation landscape is key to maximizing your short term rental income potential. Let's dive into the specifics.
Key Forte dei Marmi Airbnb Performance Metrics Overview
Monthly Airbnb Revenue Variations & Income Potential in Forte dei Marmi (2026)
Understanding the monthly revenue variations for Airbnb listings in Forte dei Marmi is key to maximizing your short term rental income potential. Seasonality significantly impacts earnings. Our analysis, based on data from the past 12 months, shows that the peak revenue month for STRs in Forte dei Marmi is typically July, while February often presents the lowest earnings, highlighting opportunities for strategic pricing adjustments during shoulder and low seasons. Explore the typical Airbnb income in Forte dei Marmi across different performance tiers:
- Best-in-class properties (Top 10%) achieve $7,917+ monthly, often utilizing dynamic pricing and superior guest experiences.
- Strong performing properties (Top 25%) earn $4,839 or more, indicating effective management and desirable locations/amenities.
- Typical properties (Median) generate around $2,583 per month, representing the average market performance.
- Entry-level properties (Bottom 25%) see earnings around $1,331, often with potential for optimization.
Average Monthly Airbnb Earnings Trend in Forte dei Marmi
Forte dei Marmi Airbnb Occupancy Rate Trends (2026)
Maximize your bookings by understanding the Forte dei Marmi STR occupancy trends. Seasonal demand shifts significantly influence how often properties are booked. Typically, Julysees the highest demand (peak season occupancy), while January experiences the lowest (low season). Effective strategies, like adjusting minimum stays or offering promotions, can boost occupancy during slower periods. Here's how different property tiers perform in Forte dei Marmi:
- Best-in-class properties (Top 10%) achieve 61%+ occupancy, indicating high desirability and potentially optimized availability.
- Strong performing properties (Top 25%) maintain 42% or higher occupancy, suggesting good market fit and guest satisfaction.
- Typical properties (Median) have an occupancy rate around 24%.
- Entry-level properties (Bottom 25%) average 12% occupancy, potentially facing higher vacancy.
Average Monthly Occupancy Rate Trend in Forte dei Marmi
Average Daily Rate (ADR) Airbnb Trends in Forte dei Marmi (2026)
Effective short term rental pricing strategy in Forte dei Marmi involves understanding monthly ADR fluctuations. The Average Daily Rate (ADR) for Airbnb in Forte dei Marmi typically peaks in July and dips lowest during November. Leveraging Airbnb dynamic pricing tools or strategies based on this seasonality can significantly boost revenue. Here's a look at the typical nightly rates achieved:
- Best-in-class properties (Top 10%) command rates of $1,004+ per night, often due to premium features or locations.
- Strong performing properties (Top 25%) achieve nightly rates of $598 or more.
- Typical properties (Median) charge around $342 per night.
- Entry-level properties (Bottom 25%) earn around $210 per night.
Average Daily Rate (ADR) Trend by Month in Forte dei Marmi
Get Live Forte dei Marmi Market Intelligence 👇

Explore Real-time Analytics
Airbnb Seasonality Analysis & Trends in Forte dei Marmi (2026)
Peak Season (July, August, June)
- Revenue averages $8,805 per month
- Occupancy rates average 47.3%
- Daily rates average $555
Shoulder Season
- Revenue averages $2,558 per month
- Occupancy maintains around 26.4%
- Daily rates hold near $498
Low Season (January, February, November)
- Revenue drops to average $1,130 per month
- Occupancy decreases to average 17.2%
- Daily rates adjust to average $491
Seasonality Insights for Forte dei Marmi
- The Airbnb seasonality in Forte dei Marmi shows highly seasonal trends requiring careful strategy. While the sections above show seasonal averages, it's also insightful to look at the extremes:
- During the high season, the absolute peak month showcases Forte dei Marmi's highest earning potential, with monthly revenues capable of climbing to $11,144, occupancy reaching a high of 57.6%, and ADRs peaking at $567.
- Conversely, the slowest single month of the year, typically falling within the low season, marks the market's lowest point. In this month, revenue might dip to $1,060, occupancy could drop to 14.4%, and ADRs may adjust down to $481.
- Understanding both the seasonal averages and these monthly peaks and troughs in revenue, occupancy, and ADR is crucial for maximizing your Airbnb profit potential in Forte dei Marmi.
Seasonal Strategies for Maximizing Profit
- Peak Season: Maximize revenue through premium pricing and potentially longer minimum stays. Ensure high availability.
- Low Season: Offer competitive pricing, special promotions (e.g., extended stay discounts), and flexible cancellation policies. Target off-season travelers like remote workers or budget-conscious guests.
- Shoulder Seasons: Implement dynamic pricing that balances peak and low rates. Target weekend travelers or specific events. Offer slightly more flexible terms than peak season.
- Regularly analyze your own performance against these Forte dei Marmi seasonality benchmarks and adjust your pricing and availability strategy accordingly.
Best Areas for Airbnb Investment in Forte dei Marmi (2026)
Exploring the top neighborhoods for short-term rentals in Forte dei Marmi? This section highlights key areas, outlining why they are attractive for hosts and guests, along with notable local attractions. Consider these locations based on your target guest profile and investment strategy.
| Neighborhood / Area | Why Host Here? (Target Guests & Appeal) | Key Attractions & Landmarks |
|---|---|---|
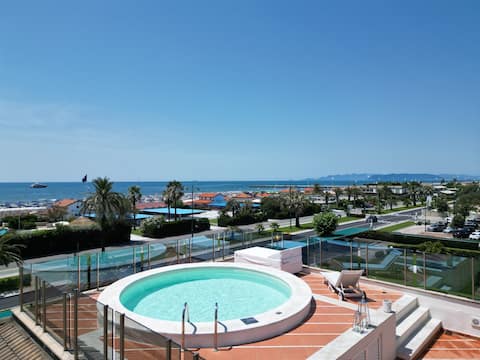
| Forte dei Marmi Beachfront | The main attraction of Forte dei Marmi, known for its luxurious villas and proximity to the sandy beaches. Ideal for tourists looking for seaside relaxation and upscale amenities. | Forte dei Marmi Beach, Beach Clubs, Mediterranean Restaurants, Shopping Boutiques, Parks |
| Historic Center | The charming historical center filled with local shops, cafes, and cultural sites. A great place for visitors who want to experience local life and history. | Fortino di Forte dei Marmi, Piazza Garibaldi, Church of San Francesco, Local Art Galleries |
| Versilia | Known for its beautiful coastline and vibrant nightlife, this area attracts a younger crowd looking for beach parties and entertainment, perfect for vacationers seeking lively experiences. | Versilia Beach, Clubs and Bars, Water Sports Activities, Pine Forests |
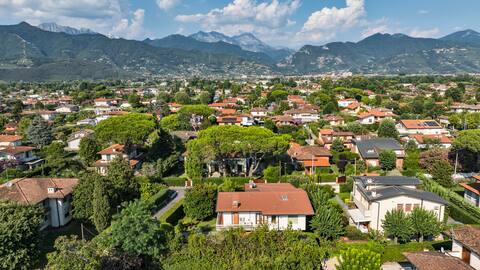
| Pietrasanta | This nearby town is famous for its art scene, attracting those interested in culture and galleries. It offers a more authentic Tuscan experience. | Museo dei Bozzetti, Piazza del Duomo, Art Galleries, Quarry Tours |
| Marina di Pietrasanta | Coupled with stunning beaches and family-friendly amenities, this area draws families and casual beachgoers. It's perfect for those wanting a relaxing getaway. | Marina Beach, Boardwalk, Water Parks, Cafés |
| Montignoso | A quieter area just a short drive from Forte dei Marmi, known for its scenic views and historical sites. Appeals to those looking for a peaceful retreat away from the crowds. | Castle of Montignoso, Local Vineyards, Nature Trails |
| Lido di Camaiore | Another lovely coastal town nearby, known for long beaches and vibrant promenades. Attracts tourists who enjoy beach activities and family-friendly environments. | Lido Beach, Promenade Shopping, Parks, Beach Sports |
| Viareggio | Well-known for its carnival celebrations and beautiful architecture. A good choice for those interested in cultural events and seaside leisure. | Viareggio Carnival, La Passeggiata, Beaches, Historic Villas |
Understanding Airbnb License Requirements & STR Laws in Forte dei Marmi (2026)
Yes, Forte dei Marmi, Tuscany, Italy enforces high STR regulations. Obtaining a license and ensuring compliance is almost certainly required according to current 2026 STR laws. Always verify the latest short term rental regulations and Airbnb license requirements directly with local government authorities for Forte dei Marmi to ensure full compliance before hosting.
(Source: AirROI data, 2026, based on 88% licensed listings)
Top Performing Airbnb Properties in Forte dei Marmi (2026)
Benchmark your potential! Explore examples of top-performing Airbnb properties in Forte dei Marmibased on Trailing Twelve Month (TTM) revenue. Analyze their characteristics, revenue, occupancy rate, and ADR to understand what drives success in this market.
![[Luxury Villa]5BDR+Hydrmasage+Cinema room+Gym+Pool](https://a0.muscache.com/im/pictures/airflow/Hosting-1204462043851621345/original/4b01e618-e4e2-422b-93a9-693268b66709.jpg?im_w=480&im_format=avif)
[Luxury Villa]5BDR+Hydrmasage+Cinema room+Gym+Pool
Entire Place • 5 bedrooms
Luxury Sea view flat with swimming pool
Entire Place • 4 bedrooms
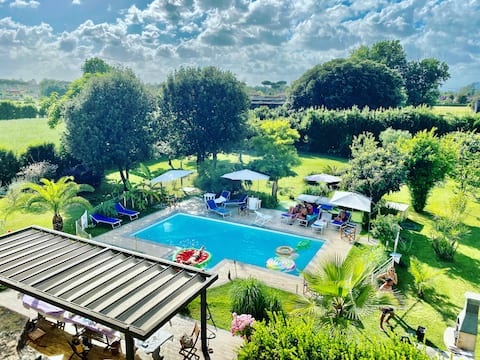
Huge Pool and Garden at Brand New Villa Oasis !
Entire Place • 9 bedrooms
Quiet Villa, exclusive Garden in Forte dei Marmi
Entire Place • 4 bedrooms
![[Central Villa] 3 bedrooms + free private parking](https://a0.muscache.com/im/pictures/hosting/Hosting-1214596681156238277/original/0095b942-709a-4a5f-8625-54434adc7706.jpeg?im_w=480&im_format=avif)
[Central Villa] 3 bedrooms + free private parking
Entire Place • 3 bedrooms
![[Dream Villa] 6BDR+Cinema room+Hydrmasage+Gym+Pool](https://a0.muscache.com/im/pictures/airflow/Hosting-1370220986193963877/original/b931e888-0fcc-4b2f-a489-256cdd943135.jpg?im_w=480&im_format=avif)
[Dream Villa] 6BDR+Cinema room+Hydrmasage+Gym+Pool
Entire Place �• 6 bedrooms
Note: Performance varies based on location, size, amenities, seasonality, and management quality. Data reflects the past 12 months.
Top Performing Airbnb Hosts in Forte dei Marmi (2026)
Learn from the best! This table showcases top-performing Airbnb hosts in Forte dei Marmi based on the number of properties managed and estimated total revenue over the past year. Analyze their scale and performance metrics.
| Host Name | Properties | Grossing Revenue | Stay Reviews | Avg Rating |
|---|---|---|---|---|
| Simone | 4 | $359,437 | 47 | 4.92/5.0 |
| Golden Luxe | 4 | $296,312 | 26 | 4.71/5.0 |
| 55042 Srls | 11 | $278,216 | 207 | 4.82/5.0 |
| Magda | 7 | $211,486 | 54 | 5.00/5.0 |
| Alessandra - Interhome | 15 | $204,387 | 72 | 4.38/5.0 |
| Iacopo | 7 | $201,456 | 66 | 4.68/5.0 |
| Dario | 2 | $161,635 | 39 | 4.76/5.0 |
| Paola Marialuisa Elena | 4 | $152,483 | 101 | 4.87/5.0 |
| Massimo | 1 | $140,260 | 23 | 4.91/5.0 |
| Fabio | 5 | $139,654 | 30 | 4.65/5.0 |
Analyzing the strategies of top hosts, such as their property selection, pricing, and guest communication, can offer valuable lessons for optimizing your own Airbnb operations in Forte dei Marmi.
Dive Deeper: Advanced Forte dei Marmi STR Market Data (2026)
Ready to unlock more insights? AirROI provides access to advanced metrics and comprehensive Airbnb data for Forte dei Marmi. Explore detailed analytics beyond this report to refine your investment strategy, optimize pricing, and maximize your vacation rental profits.
Explore Advanced MetricsForte dei Marmi Short-Term Rental Market Composition (2026): Property & Room Types
Room Type Distribution
Property Type Distribution
Market Composition Insights for Forte dei Marmi
- The Forte dei Marmi Airbnb market composition is heavily skewed towards Entire Home/Apt listings, which make up 97.3% of the 187 active rentals. This indicates strong guest preference for privacy and space.
- Looking at the property type distribution in Forte dei Marmi, House properties are the most common (63.6%), reflecting the local real estate landscape.
- Houses represent a significant 63.6% portion, catering likely to families or larger groups.
- Smaller segments like hotel/boutique (combined 0.5%) offer potential for unique stay experiences.
Forte dei Marmi Airbnb Room Capacity Analysis (2026): Bedroom Distribution
Distribution of Listings by Number of Bedrooms
Room Capacity Insights for Forte dei Marmi
- The dominant room capacity in Forte dei Marmi is 2 bedrooms listings, making up 28.9% of the market. This suggests a strong demand for properties suitable for couples or solo travelers.
- Together, 2 bedrooms and 3 bedrooms properties represent 54.6% of the active Airbnb listings in Forte dei Marmi, indicating a high concentration in these sizes.
- A significant 52.4% of listings offer 3+ bedrooms, catering to larger groups and families seeking more space in Forte dei Marmi.
Forte dei Marmi Vacation Rental Guest Capacity Trends (2026)
Distribution of Listings by Guest Capacity
Guest Capacity Insights for Forte dei Marmi
- The most common guest capacity trend in Forte dei Marmi vacation rentals is listings accommodating 8+ guests (23.5%). This suggests the primary traveler segment is likely larger groups.
- Properties designed for 8+ guests and 4 guests dominate the Forte dei Marmi STR market, accounting for 46.5% of listings.
- 52.4% of properties accommodate 6+ guests, serving the market segment for larger families or group travel in Forte dei Marmi.
- On average, properties in Forte dei Marmi are equipped to host 5.5 guests.
Forte dei Marmi Airbnb Booking Patterns (2026): Available vs. Booked Days
Available Days Distribution
Booked Days Distribution
Booking Pattern Insights for Forte dei Marmi
- The most common availability pattern in Forte dei Marmi falls within the 271-366 days range, representing 79.7% of listings. This suggests many properties have significant open periods on their calendars.
- Approximately 97.9% of listings show high availability (181+ days open annually), indicating potential for increased bookings or specific owner usage patterns.
- For booked days, the 31-90 days range is most frequent in Forte dei Marmi (42.8%), reflecting common guest stay durations or potential owner blocking patterns.
- A notable 2.1% of properties secure long booking periods (181+ days booked per year), highlighting successful long-term rental strategies or significant owner usage.
Forte dei Marmi Airbnb Minimum Stay Requirements Analysis
Distribution of Listings by Minimum Night Requirement
1 Night
11 listings
5.9% of total
2 Nights
12 listings
6.4% of total
3 Nights
11 listings
5.9% of total
4-6 Nights
20 listings
10.7% of total
7-29 Nights
39 listings
20.9% of total
30+ Nights
94 listings
50.3% of total
Key Insights
- The most prevalent minimum stay requirement in Forte dei Marmi is 30+ Nights, adopted by 50.3% of listings. This highlights the market's preference for longer commitments.
- Very short stays (1-2 nights) are less common (12.3%), suggesting hosts prefer slightly longer bookings to optimize turnover.
- A significant segment (50.3%) caters to monthly stays (30+ nights) in Forte dei Marmi, pointing to opportunities in the extended-stay market.
Recommendations
- Align with the market by considering a 30+ Nights minimum stay, as 50.3% of Forte dei Marmi hosts use this setting.
- If feasible, allowing 1-night stays, especially midweek or during low season, could capture last-minute bookings, as only 5.9% currently do.
- Explore offering discounts for stays of 30+ nights to attract the 50.3% of the market seeking extended stays.
- Adjust minimum nights based on seasonality – potentially shorter during low season and longer during peak demand periods in Forte dei Marmi.
Forte dei Marmi Airbnb Cancellation Policy Trends Analysis (2026)
Limited
3 listings
1.6% of total
Super Strict 30 Days
11 listings
5.9% of total
Super Strict 60 Days
13 listings
7% of total
Flexible
16 listings
8.6% of total
Moderate
36 listings
19.4% of total
Firm
79 listings
42.5% of total
Strict
28 listings
15.1% of total
Cancellation Policy Insights for Forte dei Marmi
- The prevailing Airbnb cancellation policy trend in Forte dei Marmi is Firm, used by 42.5% of listings.
- A majority (57.6%) of hosts in Forte dei Marmi utilize Firm or Strict policies, indicating a market where hosts prioritize booking security.
Recommendations for Hosts
- Consider adopting a Firm policy to align with the 42.5% market standard in Forte dei Marmi.
- Regularly review your cancellation policy against competitors and market demand shifts in Forte dei Marmi.
Forte dei Marmi STR Booking Lead Time Analysis (2026)
Average Booking Lead Time by Month
Booking Lead Time Insights for Forte dei Marmi
- The overall average booking lead time for vacation rentals in Forte dei Marmi is 48 days.
- Guests book furthest in advance for stays during July (average 83 days), likely coinciding with peak travel demand or local events.
- The shortest booking windows occur for stays in January (average 10 days), indicating more last-minute travel plans during this time.
- Seasonally, Summer (68 days avg.) sees the longest lead times, while Winter (19 days avg.) has the shortest, reflecting typical travel planning cycles.
Recommendations for Hosts
- Use the overall average lead time (48 days) as a baseline for your pricing and availability strategy in Forte dei Marmi.
- For July stays, consider implementing length-of-stay discounts or slightly higher rates for bookings made less than 83 days out to capitalize on advance planning.
- During January, focus on last-minute booking availability and promotions, as guests book with very short notice (10 days avg.).
- Target marketing efforts for the Summer season well in advance (at least 68 days) to capture early planners.
- Monitor your own booking lead times against these Forte dei Marmi averages to identify opportunities for dynamic pricing adjustments.
Popular & Essential Airbnb Amenities in Forte dei Marmi (2026)
Amenity Prevalence
Amenity Insights for Forte dei Marmi
- Essential amenities in Forte dei Marmi that guests expect include: TV. Lacking these (this) could significantly impact bookings.
- Popular amenities like Kitchen, Washer, Wifi are common but not universal. Offering these can provide a competitive edge.
- Warning: Wifi is not universally provided but is considered essential globally. Ensure reliable Wifi is offered.
Recommendations for Hosts
- Ensure your listing includes all essential amenities for Forte dei Marmi: TV.
- Prioritize adding missing essentials: TV.
- Consider adding popular differentiators like Kitchen or Washer to increase appeal.
- Highlight unique or less common amenities you offer (e.g., hot tub, dedicated workspace, EV charger) in your listing description and photos.
- Regularly check competitor amenities in Forte dei Marmi to stay competitive.
Forte dei Marmi Airbnb Guest Demographics & Profile Analysis (2026)
Guest Profile Summary for Forte dei Marmi
- The typical guest profile for Airbnb in Forte dei Marmi consists of a mix of domestic (43%) and international guests, with top international origins including United States, typically belonging to the Post-2000s (Gen Z/Alpha) group (50%), primarily speaking English or Italian.
- Domestic travelers account for 42.9% of guests.
- Key international markets include Italy (42.9%) and United States (19.1%).
- Top languages spoken are English (37.4%) followed by Italian (22.9%).
- A significant demographic segment is the Post-2000s (Gen Z/Alpha) group, representing 50% of guests.
Recommendations for Hosts
- Balance marketing efforts between domestic and international channels based on the guest mix.
- Tailor amenities and listing descriptions to appeal to the dominant Post-2000s (Gen Z/Alpha) demographic (e.g., highlight fast WiFi, smart home features, local guides).
- Highlight unique local experiences or amenities relevant to the primary guest profile.
- Consider seasonal promotions aligned with peak travel times for key origin markets.
Nearby Short-Term Rental Market Comparison
How does the Forte dei Marmi Airbnb market stack up against its neighbors? Compare key performance metrics like average monthly revenue, ADR, and occupancy rates in surrounding areas to understand the broader regional STR landscape.
| Market | Active Properties | Monthly Revenue | Daily Rate | Avg. Occupancy |
|---|---|---|---|---|
| Tignano | 12 | $4,160 | $366.92 | 45% |
| Marciano della Chiana | 17 | $3,823 | $545.25 | 35% |
| Castelfranco di Sotto | 47 | $3,777 | $377.39 | 39% |
| Portofino | 77 | $3,585 | $509.42 | 38% |
| Buonconvento | 60 | $3,186 | $440.58 | 43% |
| Radda in Chianti | 94 | $3,098 | $361.57 | 39% |
| Monterosso al Mare | 370 | $2,991 | $264.15 | 52% |
| Impruneta | 146 | $2,887 | $297.45 | 40% |
| Lastra a Signa | 96 | $2,760 | $311.91 | 43% |
| Florence | 10,496 | $2,755 | $225.30 | 49% |