Radda in Chianti Airbnb Market Analysis 2026: Short Term Rental Data & Vacation Rental Statistics in Tuscany, Italy
Is Airbnb profitable in Radda in Chianti in 2026? Explore comprehensive Airbnb analytics for Radda in Chianti, Tuscany, Italy to uncover income potential. This 2026 STR market report for Radda in Chianti, based on AirROI data from February 2025 to January 2026, reveals key trends in the niche market of 94 active listings.
Whether you're considering an Airbnb investment in Radda in Chianti, optimizing your existing vacation rental, or exploring rental arbitrage opportunities, understanding the Radda in Chianti Airbnb data is crucial. Navigating the high regulation landscape is key to maximizing your short term rental income potential. Let's dive into the specifics.
Key Radda in Chianti Airbnb Performance Metrics Overview
Monthly Airbnb Revenue Variations & Income Potential in Radda in Chianti (2026)
Understanding the monthly revenue variations for Airbnb listings in Radda in Chianti is key to maximizing your short term rental income potential. Seasonality significantly impacts earnings. Our analysis, based on data from the past 12 months, shows that the peak revenue month for STRs in Radda in Chianti is typically August, while January often presents the lowest earnings, highlighting opportunities for strategic pricing adjustments during shoulder and low seasons. Explore the typical Airbnb income in Radda in Chianti across different performance tiers:
- Best-in-class properties (Top 10%) achieve $11,101+ monthly, often utilizing dynamic pricing and superior guest experiences.
- Strong performing properties (Top 25%) earn $5,899 or more, indicating effective management and desirable locations/amenities.
- Typical properties (Median) generate around $2,486 per month, representing the average market performance.
- Entry-level properties (Bottom 25%) see earnings around $996, often with potential for optimization.
Average Monthly Airbnb Earnings Trend in Radda in Chianti
Radda in Chianti Airbnb Occupancy Rate Trends (2026)
Maximize your bookings by understanding the Radda in Chianti STR occupancy trends. Seasonal demand shifts significantly influence how often properties are booked. Typically, Augustsees the highest demand (peak season occupancy), while January experiences the lowest (low season). Effective strategies, like adjusting minimum stays or offering promotions, can boost occupancy during slower periods. Here's how different property tiers perform in Radda in Chianti:
- Best-in-class properties (Top 10%) achieve 78%+ occupancy, indicating high desirability and potentially optimized availability.
- Strong performing properties (Top 25%) maintain 56% or higher occupancy, suggesting good market fit and guest satisfaction.
- Typical properties (Median) have an occupancy rate around 34%.
- Entry-level properties (Bottom 25%) average 16% occupancy, potentially facing higher vacancy.
Average Monthly Occupancy Rate Trend in Radda in Chianti
Average Daily Rate (ADR) Airbnb Trends in Radda in Chianti (2026)
Effective short term rental pricing strategy in Radda in Chianti involves understanding monthly ADR fluctuations. The Average Daily Rate (ADR) for Airbnb in Radda in Chianti typically peaks in September and dips lowest during March. Leveraging Airbnb dynamic pricing tools or strategies based on this seasonality can significantly boost revenue. Here's a look at the typical nightly rates achieved:
- Best-in-class properties (Top 10%) command rates of $755+ per night, often due to premium features or locations.
- Strong performing properties (Top 25%) achieve nightly rates of $418 or more.
- Typical properties (Median) charge around $206 per night.
- Entry-level properties (Bottom 25%) earn around $138 per night.
Average Daily Rate (ADR) Trend by Month in Radda in Chianti
Get Live Radda in Chianti Market Intelligence 👇

Explore Real-time Analytics
Airbnb Seasonality Analysis & Trends in Radda in Chianti (2026)
Peak Season (August, July, June)
- Revenue averages $7,293 per month
- Occupancy rates average 47.8%
- Daily rates average $358
Shoulder Season
- Revenue averages $4,497 per month
- Occupancy maintains around 38.5%
- Daily rates hold near $343
Low Season (January, February, March)
- Revenue drops to average $2,309 per month
- Occupancy decreases to average 27.8%
- Daily rates adjust to average $323
Seasonality Insights for Radda in Chianti
- The Airbnb seasonality in Radda in Chianti shows highly seasonal trends requiring careful strategy. While the sections above show seasonal averages, it's also insightful to look at the extremes:
- During the high season, the absolute peak month showcases Radda in Chianti's highest earning potential, with monthly revenues capable of climbing to $7,769, occupancy reaching a high of 53.4%, and ADRs peaking at $390.
- Conversely, the slowest single month of the year, typically falling within the low season, marks the market's lowest point. In this month, revenue might dip to $1,367, occupancy could drop to 13.8%, and ADRs may adjust down to $314.
- Understanding both the seasonal averages and these monthly peaks and troughs in revenue, occupancy, and ADR is crucial for maximizing your Airbnb profit potential in Radda in Chianti.
Seasonal Strategies for Maximizing Profit
- Peak Season: Maximize revenue through premium pricing and potentially longer minimum stays. Ensure high availability.
- Low Season: Offer competitive pricing, special promotions (e.g., extended stay discounts), and flexible cancellation policies. Target off-season travelers like remote workers or budget-conscious guests.
- Shoulder Seasons: Implement dynamic pricing that balances peak and low rates. Target weekend travelers or specific events. Offer slightly more flexible terms than peak season.
- Regularly analyze your own performance against these Radda in Chianti seasonality benchmarks and adjust your pricing and availability strategy accordingly.
Best Areas for Airbnb Investment in Radda in Chianti (2026)
Exploring the top neighborhoods for short-term rentals in Radda in Chianti? This section highlights key areas, outlining why they are attractive for hosts and guests, along with notable local attractions. Consider these locations based on your target guest profile and investment strategy.
| Neighborhood / Area | Why Host Here? (Target Guests & Appeal) | Key Attractions & Landmarks |
|---|---|---|
| Radda in Chianti Historic Center | Charming medieval village with stunning views and historic architecture. Ideal for tourists looking for an authentic Tuscan experience, with easy access to wine tours and cultural attractions. | Castello di Radda, Piazza Ferrucci, San Niccolò Church, Local Wine Shops, Chianti Classico Wine Trail |
| Greve in Chianti | A major town in the Chianti wine region, famous for its wine production and lively market square. Perfect for guests who wish to explore the surrounding vineyards and picturesque countryside. | Piazza Matteotti, Wine Museum, Castello di Verrazzano, Local Vineyards, Chianti Wine Tasting Events |
| Castellina in Chianti | Known for its beautiful landscapes and wine estates, Castellina is a popular spot for tourists and wine enthusiasts who want to experience the best of Chianti's offerings. | Castellina Fortress, Local Wineries, Chianti Scenic Views, Historic Churches, Vignamaggio |
| Panzano in Chianti | A quaint village renowned for its high-quality wines and rustic charm. It attracts visitors seeking to enjoy a peaceful retreat with culinary delights and outdoor activities. | Panzano Vineyards, Dario Cecchini's Steakhouse, Pienza, Hiking Trails, Local Olive Oil Producers |
| Volpaia | A picturesque village perched on a hilltop, famous for its well-preserved medieval structures and stunning views. Popular among those looking for tranquility and natural beauty. | Volpaia Castle, Wine Tasting Experiences, Panoramic Walking Trails, Historical Architecture, Scenic Vineyards |
| San Donato in Poggio | A charming medieval town with a historic atmosphere and direct access to vineyards, it offers a serene getaway for those wishing to enjoy the tranquility of the Tuscan countryside. | San Donato Church, Medieval Architecture, Local Market, Wine Tours, Natural Parks |
| Badia a Passignano | Known for its stunning abbey and beautiful landscapes, this area is perfect for guests interested in culture and the arts alongside wine tasting and dining options. | Abbey of Passignano, Artistic Vineyards, Trattorias, Natural Reserves, Biking Trails |
| Barberino Val d'Elsa | A quaint village that is often overlooked but full of charm and local culture, making it a unique option for guests seeking authenticity and tranquility away from the crowds. | Historic Town Center, Local Artisans, Vineyards, Scenic Views, Culinary Experiences |
Understanding Airbnb License Requirements & STR Laws in Radda in Chianti (2026)
Yes, Radda in Chianti, Tuscany, Italy enforces high STR regulations. Obtaining a license and ensuring compliance is almost certainly required according to current 2026 STR laws. Always verify the latest short term rental regulations and Airbnb license requirements directly with local government authorities for Radda in Chianti to ensure full compliance before hosting.
(Source: AirROI data, 2026, based on 94% licensed listings)
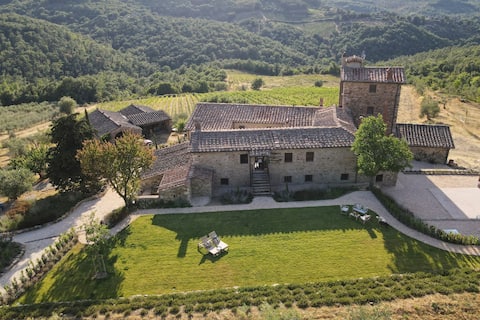
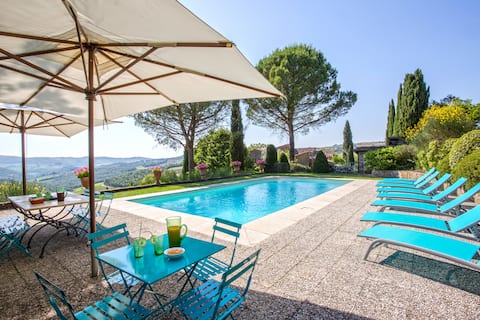
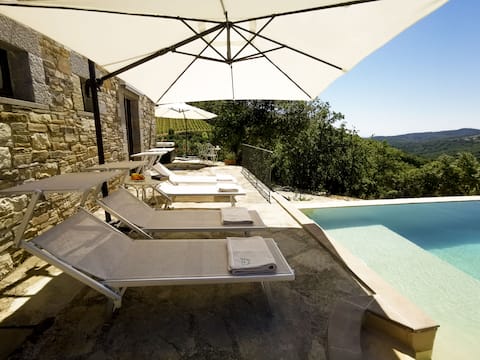
Top Performing Airbnb Properties in Radda in Chianti (2026)
Benchmark your potential! Explore examples of top-performing Airbnb properties in Radda in Chiantibased on Trailing Twelve Month (TTM) revenue. Analyze their characteristics, revenue, occupancy rate, and ADR to understand what drives success in this market.
Tuscan character, contemporary style and comfort
Entire Place • 5 bedrooms
Cosoli
Entire Place • 5 bedrooms

Tenuta Lo Spugno
Entire Place • 4 bedrooms

Cresta del Chianti
Entire Place • 1 bedroom
Villa with pool in Chianti - Castellare Petroso
Entire Place • 4 bedrooms

Villa Montemaggio
Entire Place • 3 bedrooms
Note: Performance varies based on location, size, amenities, seasonality, and management quality. Data reflects the past 12 months.
Top Performing Airbnb Hosts in Radda in Chianti (2026)
Learn from the best! This table showcases top-performing Airbnb hosts in Radda in Chianti based on the number of properties managed and estimated total revenue over the past year. Analyze their scale and performance metrics.
| Host Name | Properties | Grossing Revenue | Stay Reviews | Avg Rating |
|---|---|---|---|---|
| To Tuscany | 19 | $996,612 | 113 | 4.83/5.0 |
| Samanta | 1 | $418,620 | 57 | 4.98/5.0 |
| Valeria | 2 | $205,813 | 50 | 4.93/5.0 |
| Raffaele Augusto | 1 | $128,961 | 33 | 5.00/5.0 |
| Castellare Petroso | 1 | $116,797 | 29 | 5.00/5.0 |
| Sebastien | 1 | $109,056 | 65 | 4.82/5.0 |
| Alessandro | 3 | $101,347 | 143 | 4.89/5.0 |
| Emma | 2 | $94,325 | 8 | 4.50/5.0 |
| Peggy | 1 | $90,020 | 40 | 4.98/5.0 |
| Susi | 2 | $89,107 | 25 | 4.87/5.0 |
Analyzing the strategies of top hosts, such as their property selection, pricing, and guest communication, can offer valuable lessons for optimizing your own Airbnb operations in Radda in Chianti.
Dive Deeper: Advanced Radda in Chianti STR Market Data (2026)
Ready to unlock more insights? AirROI provides access to advanced metrics and comprehensive Airbnb data for Radda in Chianti. Explore detailed analytics beyond this report to refine your investment strategy, optimize pricing, and maximize your vacation rental profits.
Explore Advanced MetricsRadda in Chianti Short-Term Rental Market Composition (2026): Property & Room Types
Room Type Distribution
Property Type Distribution
Market Composition Insights for Radda in Chianti
- The Radda in Chianti Airbnb market composition is heavily skewed towards Entire Home/Apt listings, which make up 95.7% of the 94 active rentals. This indicates strong guest preference for privacy and space.
- Looking at the property type distribution in Radda in Chianti, House properties are the most common (62.8%), reflecting the local real estate landscape.
- Houses represent a significant 62.8% portion, catering likely to families or larger groups.
- Smaller segments like hotel/boutique (combined 2.1%) offer potential for unique stay experiences.
Radda in Chianti Airbnb Room Capacity Analysis (2026): Bedroom Distribution
Distribution of Listings by Number of Bedrooms
Room Capacity Insights for Radda in Chianti
- The dominant room capacity in Radda in Chianti is 2 bedrooms listings, making up 29.8% of the market. This suggests a strong demand for properties suitable for couples or solo travelers.
- Together, 2 bedrooms and 3 bedrooms properties represent 55.3% of the active Airbnb listings in Radda in Chianti, indicating a high concentration in these sizes.
- A significant 46.8% of listings offer 3+ bedrooms, catering to larger groups and families seeking more space in Radda in Chianti.
Radda in Chianti Vacation Rental Guest Capacity Trends (2026)
Distribution of Listings by Guest Capacity
Guest Capacity Insights for Radda in Chianti
- The most common guest capacity trend in Radda in Chianti vacation rentals is listings accommodating 8+ guests (25.5%). This suggests the primary traveler segment is likely larger groups.
- Properties designed for 8+ guests and 4 guests dominate the Radda in Chianti STR market, accounting for 51.0% of listings.
- 46.8% of properties accommodate 6+ guests, serving the market segment for larger families or group travel in Radda in Chianti.
- On average, properties in Radda in Chianti are equipped to host 5.1 guests.
Radda in Chianti Airbnb Booking Patterns (2026): Available vs. Booked Days
Available Days Distribution
Booked Days Distribution
Booking Pattern Insights for Radda in Chianti
- The most common availability pattern in Radda in Chianti falls within the 271-366 days range, representing 54.3% of listings. This suggests many properties have significant open periods on their calendars.
- Approximately 86.2% of listings show high availability (181+ days open annually), indicating potential for increased bookings or specific owner usage patterns.
- For booked days, the 91-180 days range is most frequent in Radda in Chianti (34%), reflecting common guest stay durations or potential owner blocking patterns.
- A notable 13.9% of properties secure long booking periods (181+ days booked per year), highlighting successful long-term rental strategies or significant owner usage.
Radda in Chianti Airbnb Minimum Stay Requirements Analysis
Distribution of Listings by Minimum Night Requirement
1 Night
2 listings
2.1% of total
2 Nights
7 listings
7.4% of total
3 Nights
9 listings
9.6% of total
4-6 Nights
29 listings
30.9% of total
7-29 Nights
10 listings
10.6% of total
30+ Nights
37 listings
39.4% of total
Key Insights
- The most prevalent minimum stay requirement in Radda in Chianti is 30+ Nights, adopted by 39.4% of listings. This highlights the market's preference for longer commitments.
- Very short stays (1-2 nights) are less common (9.5%), suggesting hosts prefer slightly longer bookings to optimize turnover.
- A significant segment (39.4%) caters to monthly stays (30+ nights) in Radda in Chianti, pointing to opportunities in the extended-stay market.
Recommendations
- Align with the market by considering a 30+ Nights minimum stay, as 39.4% of Radda in Chianti hosts use this setting.
- If feasible, allowing 1-night stays, especially midweek or during low season, could capture last-minute bookings, as only 2.1% currently do.
- Explore offering discounts for stays of 30+ nights to attract the 39.4% of the market seeking extended stays.
- Adjust minimum nights based on seasonality – potentially shorter during low season and longer during peak demand periods in Radda in Chianti.
Radda in Chianti Airbnb Cancellation Policy Trends Analysis (2026)
Super Strict 60 Days
19 listings
20.2% of total
Super Strict 30 Days
8 listings
8.5% of total
Flexible
13 listings
13.8% of total
Moderate
17 listings
18.1% of total
Firm
33 listings
35.1% of total
Strict
4 listings
4.3% of total
Cancellation Policy Insights for Radda in Chianti
- The prevailing Airbnb cancellation policy trend in Radda in Chianti is Firm, used by 35.1% of listings.
- There's a relatively balanced mix between guest-friendly (31.9%) and stricter (39.4%) policies, offering choices for different guest needs.
- Strict cancellation policies are quite rare (4.3%), potentially making listings with this policy less competitive unless justified by high demand or property type.
Recommendations for Hosts
- Consider adopting a Firm policy to align with the 35.1% market standard in Radda in Chianti.
- Using a Strict policy might deter some guests, as only 4.3% of listings use it. Evaluate if potential revenue protection outweighs possible lower booking rates.
- Regularly review your cancellation policy against competitors and market demand shifts in Radda in Chianti.
Radda in Chianti STR Booking Lead Time Analysis (2026)
Average Booking Lead Time by Month
Booking Lead Time Insights for Radda in Chianti
- The overall average booking lead time for vacation rentals in Radda in Chianti is 108 days.
- Guests book furthest in advance for stays during March (average 165 days), likely coinciding with peak travel demand or local events.
- The shortest booking windows occur for stays in January (average 36 days), indicating more last-minute travel plans during this time.
- Seasonally, Spring (122 days avg.) sees the longest lead times, while Winter (53 days avg.) has the shortest, reflecting typical travel planning cycles.
Recommendations for Hosts
- Use the overall average lead time (108 days) as a baseline for your pricing and availability strategy in Radda in Chianti.
- For March stays, consider implementing length-of-stay discounts or slightly higher rates for bookings made less than 165 days out to capitalize on advance planning.
- Target marketing efforts for the Spring season well in advance (at least 122 days) to capture early planners.
- Monitor your own booking lead times against these Radda in Chianti averages to identify opportunities for dynamic pricing adjustments.
Popular & Essential Airbnb Amenities in Radda in Chianti (2026)
Amenity Prevalence
Amenity Insights for Radda in Chianti
- Essential amenities in Radda in Chianti that guests expect include: Wifi. Lacking these (this) could significantly impact bookings.
- Popular amenities like Kitchen, Refrigerator, Bed linens are common but not universal. Offering these can provide a competitive edge.
Recommendations for Hosts
- Ensure your listing includes all essential amenities for Radda in Chianti: Wifi.
- Prioritize adding missing essentials: Wifi.
- Consider adding popular differentiators like Kitchen or Refrigerator to increase appeal.
- Highlight unique or less common amenities you offer (e.g., hot tub, dedicated workspace, EV charger) in your listing description and photos.
- Regularly check competitor amenities in Radda in Chianti to stay competitive.
Radda in Chianti Airbnb Guest Demographics & Profile Analysis (2026)
Guest Profile Summary for Radda in Chianti
- The typical guest profile for Airbnb in Radda in Chianti consists of predominantly international visitors (93%), with top international origins including United Kingdom, typically belonging to the Post-2000s (Gen Z/Alpha) group (50%), primarily speaking English or French.
- Domestic travelers account for 6.6% of guests.
- Key international markets include United States (30.1%) and United Kingdom (8.4%).
- Top languages spoken are English (45.9%) followed by French (13.4%).
- A significant demographic segment is the Post-2000s (Gen Z/Alpha) group, representing 50% of guests.
Recommendations for Hosts
- Focus marketing internationally, particularly towards travelers from United Kingdom.
- Tailor amenities and listing descriptions to appeal to the dominant Post-2000s (Gen Z/Alpha) demographic (e.g., highlight fast WiFi, smart home features, local guides).
- Highlight unique local experiences or amenities relevant to the primary guest profile.
- Consider seasonal promotions aligned with peak travel times for key origin markets.
Nearby Short-Term Rental Market Comparison
How does the Radda in Chianti Airbnb market stack up against its neighbors? Compare key performance metrics like average monthly revenue, ADR, and occupancy rates in surrounding areas to understand the broader regional STR landscape.
| Market | Active Properties | Monthly Revenue | Daily Rate | Avg. Occupancy |
|---|---|---|---|---|
| Tignano | 12 | $4,160 | $366.92 | 45% |
| Celleno | 13 | $4,041 | $594.80 | 28% |
| Marciano della Chiana | 17 | $3,823 | $545.25 | 35% |
| Castelfranco di Sotto | 47 | $3,777 | $377.39 | 39% |
| Buonconvento | 60 | $3,186 | $440.58 | 43% |
| Collevecchio | 14 | $3,140 | $334.97 | 40% |
| Palombara Sabina | 15 | $2,914 | $309.11 | 38% |
| Impruneta | 146 | $2,887 | $297.45 | 40% |
| Lastra a Signa | 96 | $2,760 | $311.91 | 43% |
| Florence | 10,496 | $2,755 | $225.30 | 49% |