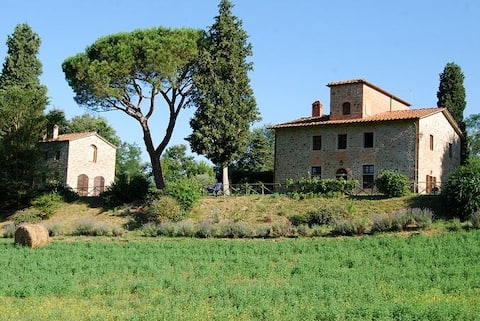
Terranuova Bracciolini Airbnb Market Analysis 2026: Short Term Rental Data & Vacation Rental Statistics in Tuscany, Italy
Is Airbnb profitable in Terranuova Bracciolini in 2026? Explore comprehensive Airbnb analytics for Terranuova Bracciolini, Tuscany, Italy to uncover income potential. This 2026 STR market report for Terranuova Bracciolini, based on AirROI data from February 2025 to January 2026, reveals key trends in the niche market of 87 active listings.
Whether you're considering an Airbnb investment in Terranuova Bracciolini, optimizing your existing vacation rental, or exploring rental arbitrage opportunities, understanding the Terranuova Bracciolini Airbnb data is crucial. Navigating the high regulation landscape is key to maximizing your short term rental income potential. Let's dive into the specifics.
Key Terranuova Bracciolini Airbnb Performance Metrics Overview
Monthly Airbnb Revenue Variations & Income Potential in Terranuova Bracciolini (2026)
Understanding the monthly revenue variations for Airbnb listings in Terranuova Bracciolini is key to maximizing your short term rental income potential. Seasonality significantly impacts earnings. Our analysis, based on data from the past 12 months, shows that the peak revenue month for STRs in Terranuova Bracciolini is typically August, while February often presents the lowest earnings, highlighting opportunities for strategic pricing adjustments during shoulder and low seasons. Explore the typical Airbnb income in Terranuova Bracciolini across different performance tiers:
- Best-in-class properties (Top 10%) achieve $6,555+ monthly, often utilizing dynamic pricing and superior guest experiences.
- Strong performing properties (Top 25%) earn $3,263 or more, indicating effective management and desirable locations/amenities.
- Typical properties (Median) generate around $1,419 per month, representing the average market performance.
- Entry-level properties (Bottom 25%) see earnings around $628, often with potential for optimization.
Average Monthly Airbnb Earnings Trend in Terranuova Bracciolini
Terranuova Bracciolini Airbnb Occupancy Rate Trends (2026)
Maximize your bookings by understanding the Terranuova Bracciolini STR occupancy trends. Seasonal demand shifts significantly influence how often properties are booked. Typically, Augustsees the highest demand (peak season occupancy), while January experiences the lowest (low season). Effective strategies, like adjusting minimum stays or offering promotions, can boost occupancy during slower periods. Here's how different property tiers perform in Terranuova Bracciolini:
- Best-in-class properties (Top 10%) achieve 70%+ occupancy, indicating high desirability and potentially optimized availability.
- Strong performing properties (Top 25%) maintain 44% or higher occupancy, suggesting good market fit and guest satisfaction.
- Typical properties (Median) have an occupancy rate around 26%.
- Entry-level properties (Bottom 25%) average 13% occupancy, potentially facing higher vacancy.
Average Monthly Occupancy Rate Trend in Terranuova Bracciolini
Average Daily Rate (ADR) Airbnb Trends in Terranuova Bracciolini (2026)
Effective short term rental pricing strategy in Terranuova Bracciolini involves understanding monthly ADR fluctuations. The Average Daily Rate (ADR) for Airbnb in Terranuova Bracciolini typically peaks in August and dips lowest during March. Leveraging Airbnb dynamic pricing tools or strategies based on this seasonality can significantly boost revenue. Here's a look at the typical nightly rates achieved:
- Best-in-class properties (Top 10%) command rates of $562+ per night, often due to premium features or locations.
- Strong performing properties (Top 25%) achieve nightly rates of $345 or more.
- Typical properties (Median) charge around $179 per night.
- Entry-level properties (Bottom 25%) earn around $114 per night.
Average Daily Rate (ADR) Trend by Month in Terranuova Bracciolini
Get Live Terranuova Bracciolini Market Intelligence 👇

Explore Real-time Analytics
Airbnb Seasonality Analysis & Trends in Terranuova Bracciolini (2026)
Peak Season (August, July, September)
- Revenue averages $5,136 per month
- Occupancy rates average 50.8%
- Daily rates average $285
Shoulder Season
- Revenue averages $2,345 per month
- Occupancy maintains around 28.7%
- Daily rates hold near $255
Low Season (January, February, March)
- Revenue drops to average $1,147 per month
- Occupancy decreases to average 21.2%
- Daily rates adjust to average $244
Seasonality Insights for Terranuova Bracciolini
- The Airbnb seasonality in Terranuova Bracciolini shows highly seasonal trends requiring careful strategy. While the sections above show seasonal averages, it's also insightful to look at the extremes:
- During the high season, the absolute peak month showcases Terranuova Bracciolini's highest earning potential, with monthly revenues capable of climbing to $6,075, occupancy reaching a high of 58.1%, and ADRs peaking at $291.
- Conversely, the slowest single month of the year, typically falling within the low season, marks the market's lowest point. In this month, revenue might dip to $761, occupancy could drop to 16.6%, and ADRs may adjust down to $232.
- Understanding both the seasonal averages and these monthly peaks and troughs in revenue, occupancy, and ADR is crucial for maximizing your Airbnb profit potential in Terranuova Bracciolini.
Seasonal Strategies for Maximizing Profit
- Peak Season: Maximize revenue through premium pricing and potentially longer minimum stays. Ensure high availability.
- Low Season: Offer competitive pricing, special promotions (e.g., extended stay discounts), and flexible cancellation policies. Target off-season travelers like remote workers or budget-conscious guests.
- Shoulder Seasons: Implement dynamic pricing that balances peak and low rates. Target weekend travelers or specific events. Offer slightly more flexible terms than peak season.
- Regularly analyze your own performance against these Terranuova Bracciolini seasonality benchmarks and adjust your pricing and availability strategy accordingly.
Best Areas for Airbnb Investment in Terranuova Bracciolini (2026)
Exploring the top neighborhoods for short-term rentals in Terranuova Bracciolini? This section highlights key areas, outlining why they are attractive for hosts and guests, along with notable local attractions. Consider these locations based on your target guest profile and investment strategy.
| Neighborhood / Area | Why Host Here? (Target Guests & Appeal) | Key Attractions & Landmarks |
|---|---|---|
| Centro Storico | The historic center of Terranuova Bracciolini is charming and full of character, appealing to visitors interested in history and culture. Its medieval architecture and quaint streets attract tourists year-round. | Piazza della Repubblica, Palazzo della Bastia, Chiesa di San Francesco, Museo della Memoria, Via Roma |
| Parco delle Foreste Casentinesi | A beautiful natural area that offers outdoor activities such as hiking and biking. Its scenic beauty draws nature lovers and those looking for a peaceful retreat. | Foreste Casentinesi, Hiking trails, Wildlife watching, Picnic areas, Natural springs |
| Villa Pandolfini | Known for its stunning architecture and beautiful gardens, this villa attracts those interested in art and history. It’s a picturesque location suitable for events and gatherings. | Villa Pandolfini tours, Gardens, Cultural events, Photography spots, Art exhibitions |
| Local wineries in Chianti | The Chianti region is renowned for its wine production and beautiful landscapes. This area attracts wine enthusiasts and those looking for immersive cultural experiences. | Wine tastings, Vineyard tours, Scenic drives, Traditional Tuscan cuisine, Annual wine festivals |
| Trade fairs in Arezzo | Close proximity to Arezzo makes this area attractive for business travelers attending trade fairs and conventions. The urban environment offers modern amenities and services. | Fiera Antiquaria di Arezzo, Arezzo trade shows, Shopping districts, Restaurants, Cultural events |
| Castello di Montozzi | This castle is a historical site that offers a glimpse into the medieval past. It attracts tourists interested in history, architecture, and beautiful panoramic views. | Castle tours, Historical exhibitions, Panoramic views, Guided tours, Photography opportunities |
| San Giovanni Valdarno | A nearby town that provides additional attractions and amenities, appealing to visitors who wish to explore beyond Terranuova Bracciolini. It has good transport links and restaurants. | Piazza Masaccio, Museo della Basilica di Santa Maria delle Grazie, Shopping areas, Cafés, Restaurants |
| Tramonti di Toscana | This area offers breathtaking views of the Tuscan countryside, with charming properties that attract those looking for a quiet getaway surrounded by nature and beauty. | Scenic views, Hiking and biking paths, Local artisan shops, Organic farmer's markets, Cultural festivals |
Understanding Airbnb License Requirements & STR Laws in Terranuova Bracciolini (2026)
Yes, Terranuova Bracciolini, Tuscany, Italy enforces high STR regulations. Obtaining a license and ensuring compliance is almost certainly required according to current 2026 STR laws. Always verify the latest short term rental regulations and Airbnb license requirements directly with local government authorities for Terranuova Bracciolini to ensure full compliance before hosting.
(Source: AirROI data, 2026, based on 77% licensed listings)
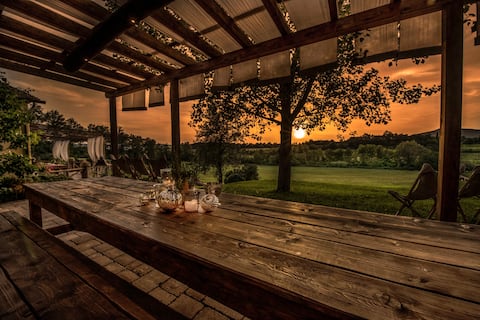
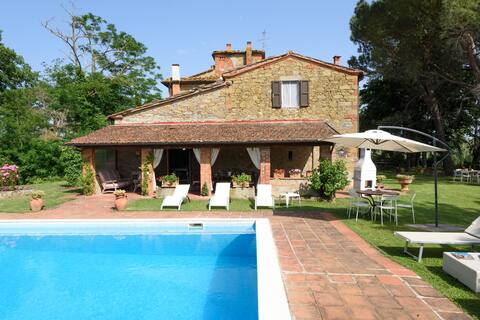
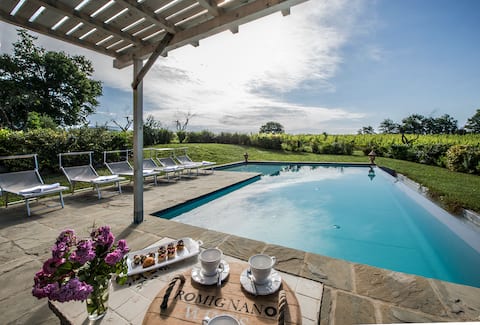
Top Performing Airbnb Properties in Terranuova Bracciolini (2026)
Benchmark your potential! Explore examples of top-performing Airbnb properties in Terranuova Bracciolinibased on Trailing Twelve Month (TTM) revenue. Analyze their characteristics, revenue, occupancy rate, and ADR to understand what drives success in this market.
romignano wine farm
Entire Place • 9 bedrooms

Villa Lolù with private heated swimming-pool
Entire Place • 4 bedrooms
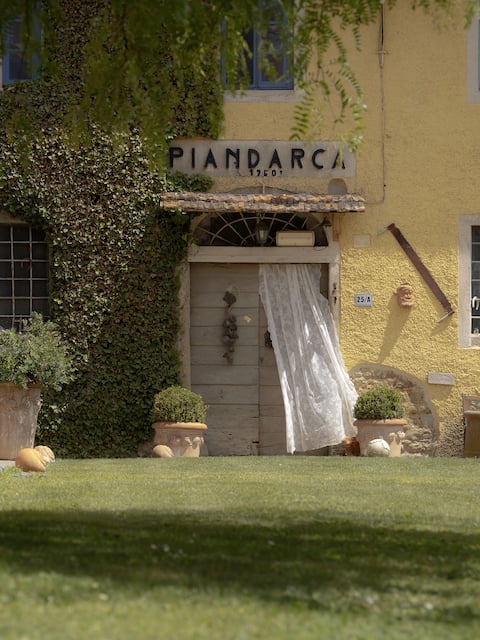
Villa Piandarca - Tuscany - WIFI - private pool
Entire Place • 3 bedrooms
Stone farmhouse 16th century with private pool
Entire Place • 6 bedrooms
CHARMING VILLA IN CHIANTI
Entire Place • 6 bedrooms
Salceta a Tuscany Country House Private Pool & BBQ
Entire Place • 6 bedrooms
Note: Performance varies based on location, size, amenities, seasonality, and management quality. Data reflects the past 12 months.
Top Performing Airbnb Hosts in Terranuova Bracciolini (2026)
Learn from the best! This table showcases top-performing Airbnb hosts in Terranuova Bracciolini based on the number of properties managed and estimated total revenue over the past year. Analyze their scale and performance metrics.
| Host Name | Properties | Grossing Revenue | Stay Reviews | Avg Rating |
|---|---|---|---|---|
| Riccardo | 2 | $269,019 | 76 | 4.75/5.0 |
| Serena | 2 | $167,302 | 217 | 4.96/5.0 |
| Anna | 3 | $149,357 | 71 | 4.99/5.0 |
| Giovanni | 6 | $91,481 | 41 | 4.85/5.0 |
| Silvia | 2 | $89,260 | 257 | 4.80/5.0 |
| Simona | 4 | $79,366 | 50 | 4.99/5.0 |
| Judith - Interhome | 2 | $75,396 | 30 | 4.93/5.0 |
| Marina | 1 | $65,258 | 31 | 4.97/5.0 |
| Irene | 9 | $63,855 | 148 | 4.82/5.0 |
| Maria Grazia | 1 | $60,283 | 23 | 4.65/5.0 |
Analyzing the strategies of top hosts, such as their property selection, pricing, and guest communication, can offer valuable lessons for optimizing your own Airbnb operations in Terranuova Bracciolini.
Dive Deeper: Advanced Terranuova Bracciolini STR Market Data (2026)
Ready to unlock more insights? AirROI provides access to advanced metrics and comprehensive Airbnb data for Terranuova Bracciolini. Explore detailed analytics beyond this report to refine your investment strategy, optimize pricing, and maximize your vacation rental profits.
Explore Advanced MetricsTerranuova Bracciolini Short-Term Rental Market Composition (2026): Property & Room Types
Room Type Distribution
Property Type Distribution
Market Composition Insights for Terranuova Bracciolini
- The Terranuova Bracciolini Airbnb market composition is heavily skewed towards Entire Home/Apt listings, which make up 95.4% of the 87 active rentals. This indicates strong guest preference for privacy and space.
- Looking at the property type distribution in Terranuova Bracciolini, House properties are the most common (46%), reflecting the local real estate landscape.
- Houses represent a significant 46% portion, catering likely to families or larger groups.
- Smaller segments like hotel/boutique (combined 3.4%) offer potential for unique stay experiences.
Terranuova Bracciolini Airbnb Room Capacity Analysis (2026): Bedroom Distribution
Distribution of Listings by Number of Bedrooms
Room Capacity Insights for Terranuova Bracciolini
- The dominant room capacity in Terranuova Bracciolini is 2 bedrooms listings, making up 29.9% of the market. This suggests a strong demand for properties suitable for couples or solo travelers.
- Together, 2 bedrooms and 1 bedroom properties represent 54.0% of the active Airbnb listings in Terranuova Bracciolini, indicating a high concentration in these sizes.
- A significant 40.2% of listings offer 3+ bedrooms, catering to larger groups and families seeking more space in Terranuova Bracciolini.
Terranuova Bracciolini Vacation Rental Guest Capacity Trends (2026)
Distribution of Listings by Guest Capacity
Guest Capacity Insights for Terranuova Bracciolini
- The most common guest capacity trend in Terranuova Bracciolini vacation rentals is listings accommodating 4 guests (29.9%). This suggests the primary traveler segment is likely small families or groups.
- Properties designed for 4 guests and 8+ guests dominate the Terranuova Bracciolini STR market, accounting for 55.2% of listings.
- 43.6% of properties accommodate 6+ guests, serving the market segment for larger families or group travel in Terranuova Bracciolini.
- On average, properties in Terranuova Bracciolini are equipped to host 5.1 guests.
Terranuova Bracciolini Airbnb Booking Patterns (2026): Available vs. Booked Days
Available Days Distribution
Booked Days Distribution
Booking Pattern Insights for Terranuova Bracciolini
- The most common availability pattern in Terranuova Bracciolini falls within the 271-366 days range, representing 67.8% of listings. This suggests many properties have significant open periods on their calendars.
- Approximately 93.1% of listings show high availability (181+ days open annually), indicating potential for increased bookings or specific owner usage patterns.
- For booked days, the 1-30 days range is most frequent in Terranuova Bracciolini (33.3%), reflecting common guest stay durations or potential owner blocking patterns.
- A notable 6.8% of properties secure long booking periods (181+ days booked per year), highlighting successful long-term rental strategies or significant owner usage.
Terranuova Bracciolini Airbnb Minimum Stay Requirements Analysis
Distribution of Listings by Minimum Night Requirement
1 Night
6 listings
6.9% of total
2 Nights
14 listings
16.1% of total
3 Nights
9 listings
10.3% of total
4-6 Nights
15 listings
17.2% of total
7-29 Nights
3 listings
3.4% of total
30+ Nights
40 listings
46% of total
Key Insights
- The most prevalent minimum stay requirement in Terranuova Bracciolini is 30+ Nights, adopted by 46% of listings. This highlights the market's preference for longer commitments.
- A significant segment (46%) caters to monthly stays (30+ nights) in Terranuova Bracciolini, pointing to opportunities in the extended-stay market.
Recommendations
- Align with the market by considering a 30+ Nights minimum stay, as 46% of Terranuova Bracciolini hosts use this setting.
- If feasible, allowing 1-night stays, especially midweek or during low season, could capture last-minute bookings, as only 6.9% currently do.
- Explore offering discounts for stays of 30+ nights to attract the 46% of the market seeking extended stays.
- Adjust minimum nights based on seasonality – potentially shorter during low season and longer during peak demand periods in Terranuova Bracciolini.
Terranuova Bracciolini Airbnb Cancellation Policy Trends Analysis (2026)
Limited
9 listings
10.5% of total
Super Strict 60 Days
10 listings
11.6% of total
Super Strict 30 Days
7 listings
8.1% of total
Flexible
18 listings
20.9% of total
Moderate
28 listings
32.6% of total
Firm
9 listings
10.5% of total
Strict
5 listings
5.8% of total
Cancellation Policy Insights for Terranuova Bracciolini
- The prevailing Airbnb cancellation policy trend in Terranuova Bracciolini is Moderate, used by 32.6% of listings.
- There's a relatively balanced mix between guest-friendly (53.5%) and stricter (16.3%) policies, offering choices for different guest needs.
- Strict cancellation policies are quite rare (5.8%), potentially making listings with this policy less competitive unless justified by high demand or property type.
Recommendations for Hosts
- Consider adopting a Moderate policy to align with the 32.6% market standard in Terranuova Bracciolini.
- Using a Strict policy might deter some guests, as only 5.8% of listings use it. Evaluate if potential revenue protection outweighs possible lower booking rates.
- Regularly review your cancellation policy against competitors and market demand shifts in Terranuova Bracciolini.
Terranuova Bracciolini STR Booking Lead Time Analysis (2026)
Average Booking Lead Time by Month
Booking Lead Time Insights for Terranuova Bracciolini
- The overall average booking lead time for vacation rentals in Terranuova Bracciolini is 77 days.
- Guests book furthest in advance for stays during August (average 103 days), likely coinciding with peak travel demand or local events.
- The shortest booking windows occur for stays in January (average 34 days), indicating more last-minute travel plans during this time.
- Seasonally, Summer (95 days avg.) sees the longest lead times, while Winter (40 days avg.) has the shortest, reflecting typical travel planning cycles.
Recommendations for Hosts
- Use the overall average lead time (77 days) as a baseline for your pricing and availability strategy in Terranuova Bracciolini.
- For August stays, consider implementing length-of-stay discounts or slightly higher rates for bookings made less than 103 days out to capitalize on advance planning.
- Target marketing efforts for the Summer season well in advance (at least 95 days) to capture early planners.
- Monitor your own booking lead times against these Terranuova Bracciolini averages to identify opportunities for dynamic pricing adjustments.
Popular & Essential Airbnb Amenities in Terranuova Bracciolini (2026)
Amenity Prevalence
Amenity Insights for Terranuova Bracciolini
- Essential amenities in Terranuova Bracciolini that guests expect include: Wifi, Kitchen. Lacking these (any) could significantly impact bookings.
- Popular amenities like Free parking on premises, Refrigerator, Pool are common but not universal. Offering these can provide a competitive edge.
- A pool is a highly desired but not standard amenity, making it a key feature for attracting guests seeking leisure in Terranuova Bracciolini.
Recommendations for Hosts
- Ensure your listing includes all essential amenities for Terranuova Bracciolini: Wifi, Kitchen.
- Prioritize adding missing essentials: Wifi, Kitchen.
- Consider adding popular differentiators like Free parking on premises or Refrigerator to increase appeal.
- Highlight unique or less common amenities you offer (e.g., hot tub, dedicated workspace, EV charger) in your listing description and photos.
- Regularly check competitor amenities in Terranuova Bracciolini to stay competitive.
Terranuova Bracciolini Airbnb Guest Demographics & Profile Analysis (2026)
Guest Profile Summary for Terranuova Bracciolini
- The typical guest profile for Airbnb in Terranuova Bracciolini consists of predominantly international visitors (86%), with top international origins including Italy, typically belonging to the Post-2000s (Gen Z/Alpha) group (50%), primarily speaking English or German.
- Domestic travelers account for 14.3% of guests.
- Key international markets include Germany (17.9%) and Italy (14.3%).
- Top languages spoken are English (40.4%) followed by German (16%).
- A significant demographic segment is the Post-2000s (Gen Z/Alpha) group, representing 50% of guests.
Recommendations for Hosts
- Focus marketing internationally, particularly towards travelers from Italy.
- Tailor amenities and listing descriptions to appeal to the dominant Post-2000s (Gen Z/Alpha) demographic (e.g., highlight fast WiFi, smart home features, local guides).
- Highlight unique local experiences or amenities relevant to the primary guest profile.
- Consider seasonal promotions aligned with peak travel times for key origin markets.
Nearby Short-Term Rental Market Comparison
How does the Terranuova Bracciolini Airbnb market stack up against its neighbors? Compare key performance metrics like average monthly revenue, ADR, and occupancy rates in surrounding areas to understand the broader regional STR landscape.
| Market | Active Properties | Monthly Revenue | Daily Rate | Avg. Occupancy |
|---|---|---|---|---|
| Tignano | 12 | $4,160 | $366.92 | 45% |
| Celleno | 13 | $4,041 | $594.80 | 28% |
| Marciano della Chiana | 17 | $3,823 | $545.25 | 35% |
| Castelfranco di Sotto | 47 | $3,777 | $377.39 | 39% |
| Buonconvento | 60 | $3,186 | $440.58 | 43% |
| Collevecchio | 14 | $3,140 | $334.97 | 40% |
| Radda in Chianti | 94 | $3,098 | $361.57 | 39% |
| Palombara Sabina | 15 | $2,914 | $309.11 | 38% |
| Impruneta | 146 | $2,887 | $297.45 | 40% |
| Lastra a Signa | 96 | $2,760 | $311.91 | 43% |