Vecchiano Airbnb Market Analysis 2026: Short Term Rental Data & Vacation Rental Statistics in Tuscany, Italy
Is Airbnb profitable in Vecchiano in 2026? Explore comprehensive Airbnb analytics for Vecchiano, Tuscany, Italy to uncover income potential. This 2026 STR market report for Vecchiano, based on AirROI data from February 2025 to January 2026, reveals key trends in the niche market of 35 active listings.
Whether you're considering an Airbnb investment in Vecchiano, optimizing your existing vacation rental, or exploring rental arbitrage opportunities, understanding the Vecchiano Airbnb data is crucial. Navigating the high regulation landscape is key to maximizing your short term rental income potential. Let's dive into the specifics.
Key Vecchiano Airbnb Performance Metrics Overview
Monthly Airbnb Revenue Variations & Income Potential in Vecchiano (2026)
Understanding the monthly revenue variations for Airbnb listings in Vecchiano is key to maximizing your short term rental income potential. Seasonality significantly impacts earnings. Our analysis, based on data from the past 12 months, shows that the peak revenue month for STRs in Vecchiano is typically August, while January often presents the lowest earnings, highlighting opportunities for strategic pricing adjustments during shoulder and low seasons. Explore the typical Airbnb income in Vecchiano across different performance tiers:
- Best-in-class properties (Top 10%) achieve $4,260+ monthly, often utilizing dynamic pricing and superior guest experiences.
- Strong performing properties (Top 25%) earn $2,511 or more, indicating effective management and desirable locations/amenities.
- Typical properties (Median) generate around $1,306 per month, representing the average market performance.
- Entry-level properties (Bottom 25%) see earnings around $641, often with potential for optimization.
Average Monthly Airbnb Earnings Trend in Vecchiano
Vecchiano Airbnb Occupancy Rate Trends (2026)
Maximize your bookings by understanding the Vecchiano STR occupancy trends. Seasonal demand shifts significantly influence how often properties are booked. Typically, Augustsees the highest demand (peak season occupancy), while January experiences the lowest (low season). Effective strategies, like adjusting minimum stays or offering promotions, can boost occupancy during slower periods. Here's how different property tiers perform in Vecchiano:
- Best-in-class properties (Top 10%) achieve 65%+ occupancy, indicating high desirability and potentially optimized availability.
- Strong performing properties (Top 25%) maintain 49% or higher occupancy, suggesting good market fit and guest satisfaction.
- Typical properties (Median) have an occupancy rate around 29%.
- Entry-level properties (Bottom 25%) average 14% occupancy, potentially facing higher vacancy.
Average Monthly Occupancy Rate Trend in Vecchiano
Average Daily Rate (ADR) Airbnb Trends in Vecchiano (2026)
Effective short term rental pricing strategy in Vecchiano involves understanding monthly ADR fluctuations. The Average Daily Rate (ADR) for Airbnb in Vecchiano typically peaks in August and dips lowest during November. Leveraging Airbnb dynamic pricing tools or strategies based on this seasonality can significantly boost revenue. Here's a look at the typical nightly rates achieved:
- Best-in-class properties (Top 10%) command rates of $342+ per night, often due to premium features or locations.
- Strong performing properties (Top 25%) achieve nightly rates of $230 or more.
- Typical properties (Median) charge around $146 per night.
- Entry-level properties (Bottom 25%) earn around $98 per night.
Average Daily Rate (ADR) Trend by Month in Vecchiano
Get Live Vecchiano Market Intelligence 👇

Explore Real-time Analytics
Airbnb Seasonality Analysis & Trends in Vecchiano (2026)
Peak Season (August, July, June)
- Revenue averages $3,249 per month
- Occupancy rates average 47.0%
- Daily rates average $202
Shoulder Season
- Revenue averages $1,771 per month
- Occupancy maintains around 33.0%
- Daily rates hold near $182
Low Season (January, February, November)
- Revenue drops to average $883 per month
- Occupancy decreases to average 19.4%
- Daily rates adjust to average $177
Seasonality Insights for Vecchiano
- The Airbnb seasonality in Vecchiano shows highly seasonal trends requiring careful strategy. While the sections above show seasonal averages, it's also insightful to look at the extremes:
- During the high season, the absolute peak month showcases Vecchiano's highest earning potential, with monthly revenues capable of climbing to $3,842, occupancy reaching a high of 52.7%, and ADRs peaking at $209.
- Conversely, the slowest single month of the year, typically falling within the low season, marks the market's lowest point. In this month, revenue might dip to $789, occupancy could drop to 12.0%, and ADRs may adjust down to $174.
- Understanding both the seasonal averages and these monthly peaks and troughs in revenue, occupancy, and ADR is crucial for maximizing your Airbnb profit potential in Vecchiano.
Seasonal Strategies for Maximizing Profit
- Peak Season: Maximize revenue through premium pricing and potentially longer minimum stays. Ensure high availability.
- Low Season: Offer competitive pricing, special promotions (e.g., extended stay discounts), and flexible cancellation policies. Target off-season travelers like remote workers or budget-conscious guests.
- Shoulder Seasons: Implement dynamic pricing that balances peak and low rates. Target weekend travelers or specific events. Offer slightly more flexible terms than peak season.
- Regularly analyze your own performance against these Vecchiano seasonality benchmarks and adjust your pricing and availability strategy accordingly.
Best Areas for Airbnb Investment in Vecchiano (2026)
Exploring the top neighborhoods for short-term rentals in Vecchiano? This section highlights key areas, outlining why they are attractive for hosts and guests, along with notable local attractions. Consider these locations based on your target guest profile and investment strategy.
| Neighborhood / Area | Why Host Here? (Target Guests & Appeal) | Key Attractions & Landmarks |
|---|---|---|
| Vecchiano Historical Center | Charming historic village known for its traditional Tuscan architecture and scenic landscapes. Ideal for travelers seeking an authentic Tuscan experience with close proximity to Pisa. | Church of San Giovanni Evangelista, Palazzo del Pretore, Via Vecchia, Local wineries, Scenic hiking trails |
| San Giuliano Terme | Located just a short drive from Vecchiano, it's known for its natural hot springs and beautiful parks. Attracts wellness tourists and families looking for relaxation. | Thermal baths, Nature parks, Historic villas, Local markets, Walking paths |
| Torre del Lago | Famed for its beautiful beaches along Lake Massaciuccoli and proximity to the Puccini Festival. Great for beach lovers and art enthusiasts. | Lake Massaciuccoli, Puccini Festival, San Bartolomeo Church, Local seafood restaurants, Beaches |
| Pisa | A major tourist destination known for the Leaning Tower and vibrant university culture. Offers a mix of historical sightseeing and lively student life. | Leaning Tower of Pisa, Piazza dei Miracoli, Pisa Cathedral, Botanical Garden, Museo dell'Opera del Duomo |
| Lucca | A picturesque walled city known for its medieval architecture and relaxed atmosphere. Attracts tourists seeking culture and history. | Lucca's walls, Piazza dell'Anfiteatro, Lucca Cathedral, Bicycle paths, Historic towers |
| Viareggio | Famous for its stunning beaches and vibrant carnival celebrations. Great for those looking for a seaside vacation experience. | Viareggio Beach, Carnival of Viareggio, Promenade, Marina, Local seafood cuisine |
| Collodi | Home to the Pinocchio Park and a charming atmosphere, this small village is perfect for families and those interested in Italian literature. | Pinocchio Park, Villa Garzoni, Botanical Garden, Historic village center, Local artisan shops |
| Castelnuovo di Garfagnana | Nestled in the Garfagnana valley, this area offers breathtaking landscapes and opportunities for outdoor activities like hiking and climbing. | The Apuan Alps, Historic castles, Local food festivals, Hiking trails, Traditional Fairs |
Understanding Airbnb License Requirements & STR Laws in Vecchiano (2026)
Yes, Vecchiano, Tuscany, Italy enforces high STR regulations. Obtaining a license and ensuring compliance is almost certainly required according to current 2026 STR laws. Always verify the latest short term rental regulations and Airbnb license requirements directly with local government authorities for Vecchiano to ensure full compliance before hosting.
(Source: AirROI data, 2026, based on 83% licensed listings)
Top Performing Airbnb Properties in Vecchiano (2026)
Benchmark your potential! Explore examples of top-performing Airbnb properties in Vecchianobased on Trailing Twelve Month (TTM) revenue. Analyze their characteristics, revenue, occupancy rate, and ADR to understand what drives success in this market.
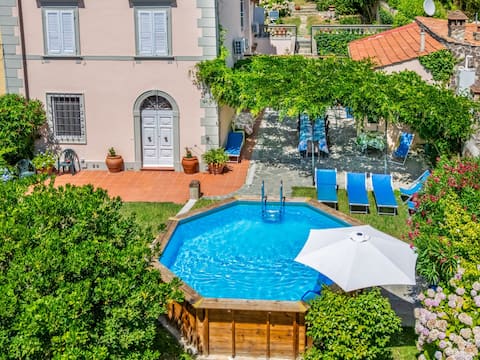
Holidays in Tuscany Pisa/Lucca air.comd.e pool
Entire Place • 6 bedrooms
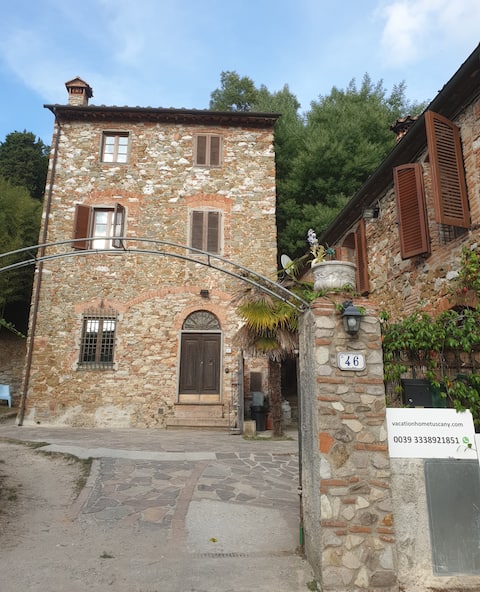
Historical House in Tuscany's heart, Pisa-Lucca 1
Entire Place • 5 bedrooms
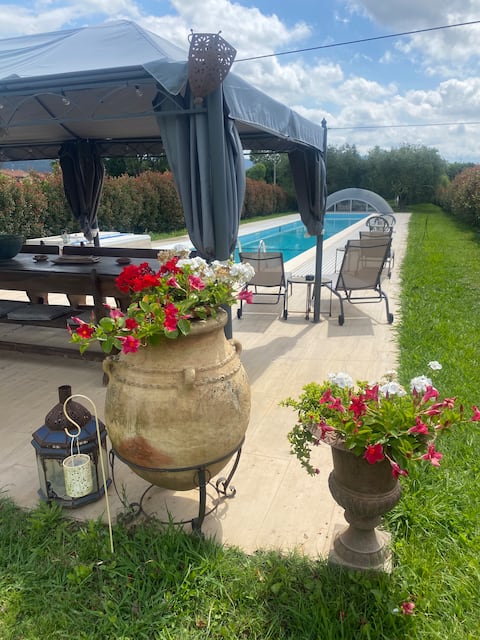
Sya Villa with private pool
Entire Place • 2 bedrooms

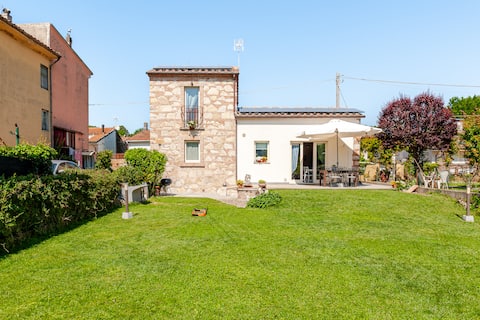
Historic house in the heart of Tuscany, Pisa-Lucca 2
Entire Place • 5 bedrooms
The Blacksmith's Shop
Entire Place • 2 bedrooms
Casale Pino in the Park, sea and city of art
Entire Place • 2 bedrooms
Note: Performance varies based on location, size, amenities, seasonality, and management quality. Data reflects the past 12 months.
Top Performing Airbnb Hosts in Vecchiano (2026)
Learn from the best! This table showcases top-performing Airbnb hosts in Vecchiano based on the number of properties managed and estimated total revenue over the past year. Analyze their scale and performance metrics.
| Host Name | Properties | Grossing Revenue | Stay Reviews | Avg Rating |
|---|---|---|---|---|
| Federigo | 4 | $127,009 | 768 | 4.63/5.0 |
| Maria Grazia | 2 | $61,750 | 143 | 4.89/5.0 |
| Mariarosa | 1 | $59,951 | 215 | 4.91/5.0 |
| Patrisia | 1 | $44,256 | 9 | 5.00/5.0 |
| Luca | 1 | $35,433 | 68 | 4.97/5.0 |
| Jasmine | 2 | $27,901 | 43 | 4.72/5.0 |
| Enrico | 1 | $19,605 | 31 | 4.71/5.0 |
| Luciana | 1 | $16,548 | 15 | 4.33/5.0 |
| Catia | 1 | $15,659 | 39 | 4.87/5.0 |
| Francesca | 1 | $15,617 | 207 | 4.69/5.0 |
Analyzing the strategies of top hosts, such as their property selection, pricing, and guest communication, can offer valuable lessons for optimizing your own Airbnb operations in Vecchiano.
Dive Deeper: Advanced Vecchiano STR Market Data (2026)
Ready to unlock more insights? AirROI provides access to advanced metrics and comprehensive Airbnb data for Vecchiano. Explore detailed analytics beyond this report to refine your investment strategy, optimize pricing, and maximize your vacation rental profits.
Explore Advanced MetricsVecchiano Short-Term Rental Market Composition (2026): Property & Room Types
Room Type Distribution
Property Type Distribution
Market Composition Insights for Vecchiano
- The Vecchiano Airbnb market composition is heavily skewed towards Entire Home/Apt listings, which make up 85.7% of the 35 active rentals. This indicates strong guest preference for privacy and space.
- Looking at the property type distribution in Vecchiano, House properties are the most common (48.6%), reflecting the local real estate landscape.
- Houses represent a significant 48.6% portion, catering likely to families or larger groups.
- The presence of 8.6% Hotel/Boutique listings indicates integration with traditional hospitality.
- Smaller segments like others, outdoor/unique (combined 5.8%) offer potential for unique stay experiences.
Vecchiano Airbnb Room Capacity Analysis (2026): Bedroom Distribution
Distribution of Listings by Number of Bedrooms
Room Capacity Insights for Vecchiano
- The dominant room capacity in Vecchiano is 2 bedrooms listings, making up 42.9% of the market. This suggests a strong demand for properties suitable for couples or solo travelers.
- Together, 2 bedrooms and 1 bedroom properties represent 62.9% of the active Airbnb listings in Vecchiano, indicating a high concentration in these sizes.
- A significant 20.1% of listings offer 3+ bedrooms, catering to larger groups and families seeking more space in Vecchiano.
Vecchiano Vacation Rental Guest Capacity Trends (2026)
Distribution of Listings by Guest Capacity
Guest Capacity Insights for Vecchiano
- The most common guest capacity trend in Vecchiano vacation rentals is listings accommodating 4 guests (20%). This suggests the primary traveler segment is likely small families or groups.
- Properties designed for 4 guests and 8+ guests dominate the Vecchiano STR market, accounting for 40.0% of listings.
- 37.2% of properties accommodate 6+ guests, serving the market segment for larger families or group travel in Vecchiano.
- On average, properties in Vecchiano are equipped to host 4.6 guests.
Vecchiano Airbnb Booking Patterns (2026): Available vs. Booked Days
Available Days Distribution
Booked Days Distribution
Booking Pattern Insights for Vecchiano
- The most common availability pattern in Vecchiano falls within the 271-366 days range, representing 62.9% of listings. This suggests many properties have significant open periods on their calendars.
- Approximately 85.8% of listings show high availability (181+ days open annually), indicating potential for increased bookings or specific owner usage patterns.
- For booked days, the 31-90 days range is most frequent in Vecchiano (34.3%), reflecting common guest stay durations or potential owner blocking patterns.
- A notable 14.3% of properties secure long booking periods (181+ days booked per year), highlighting successful long-term rental strategies or significant owner usage.
Vecchiano Airbnb Minimum Stay Requirements Analysis
Distribution of Listings by Minimum Night Requirement
1 Night
14 listings
40% of total
2 Nights
4 listings
11.4% of total
3 Nights
4 listings
11.4% of total
4-6 Nights
3 listings
8.6% of total
7-29 Nights
1 listings
2.9% of total
30+ Nights
9 listings
25.7% of total
Key Insights
- The most prevalent minimum stay requirement in Vecchiano is 1 Night, adopted by 40% of listings. This highlights the market's preference for shorter, flexible bookings.
- A significant segment (25.7%) caters to monthly stays (30+ nights) in Vecchiano, pointing to opportunities in the extended-stay market.
Recommendations
- Align with the market by considering a 1 Night minimum stay, as 40% of Vecchiano hosts use this setting.
- Explore offering discounts for stays of 30+ nights to attract the 25.7% of the market seeking extended stays.
- Adjust minimum nights based on seasonality – potentially shorter during low season and longer during peak demand periods in Vecchiano.
Vecchiano Airbnb Cancellation Policy Trends Analysis (2026)
Flexible
8 listings
22.9% of total
Moderate
15 listings
42.9% of total
Firm
10 listings
28.6% of total
Strict
2 listings
5.7% of total
Cancellation Policy Insights for Vecchiano
- The prevailing Airbnb cancellation policy trend in Vecchiano is Moderate, used by 42.9% of listings.
- There's a relatively balanced mix between guest-friendly (65.8%) and stricter (34.3%) policies, offering choices for different guest needs.
- Strict cancellation policies are quite rare (5.7%), potentially making listings with this policy less competitive unless justified by high demand or property type.
Recommendations for Hosts
- Consider adopting a Moderate policy to align with the 42.9% market standard in Vecchiano.
- Using a Strict policy might deter some guests, as only 5.7% of listings use it. Evaluate if potential revenue protection outweighs possible lower booking rates.
- Regularly review your cancellation policy against competitors and market demand shifts in Vecchiano.
Vecchiano STR Booking Lead Time Analysis (2026)
Average Booking Lead Time by Month
Booking Lead Time Insights for Vecchiano
- The overall average booking lead time for vacation rentals in Vecchiano is 65 days.
- Guests book furthest in advance for stays during August (average 102 days), likely coinciding with peak travel demand or local events.
- The shortest booking windows occur for stays in February (average 42 days), indicating more last-minute travel plans during this time.
- Seasonally, Fall (87 days avg.) sees the longest lead times, while Spring (56 days avg.) has the shortest, reflecting typical travel planning cycles.
Recommendations for Hosts
- Use the overall average lead time (65 days) as a baseline for your pricing and availability strategy in Vecchiano.
- For August stays, consider implementing length-of-stay discounts or slightly higher rates for bookings made less than 102 days out to capitalize on advance planning.
- Target marketing efforts for the Fall season well in advance (at least 87 days) to capture early planners.
- Monitor your own booking lead times against these Vecchiano averages to identify opportunities for dynamic pricing adjustments.
Popular & Essential Airbnb Amenities in Vecchiano (2026)
Amenity Prevalence
Amenity Insights for Vecchiano
- Essential amenities in Vecchiano that guests expect include: Wifi, Heating. Lacking these (any) could significantly impact bookings.
- Popular amenities like Free parking on premises, Hair dryer, Hangers are common but not universal. Offering these can provide a competitive edge.
Recommendations for Hosts
- Ensure your listing includes all essential amenities for Vecchiano: Wifi, Heating.
- Consider adding popular differentiators like Free parking on premises or Hair dryer to increase appeal.
- Highlight unique or less common amenities you offer (e.g., hot tub, dedicated workspace, EV charger) in your listing description and photos.
- Regularly check competitor amenities in Vecchiano to stay competitive.
Vecchiano Airbnb Guest Demographics & Profile Analysis (2026)
Guest Profile Summary for Vecchiano
- The typical guest profile for Airbnb in Vecchiano consists of predominantly international visitors (75%), with top international origins including France, typically belonging to the Post-2000s (Gen Z/Alpha) group (50%), primarily speaking English or Italian.
- Domestic travelers account for 25.2% of guests.
- Key international markets include Italy (25.2%) and France (18%).
- Top languages spoken are English (38%) followed by Italian (18.6%).
- A significant demographic segment is the Post-2000s (Gen Z/Alpha) group, representing 50% of guests.
Recommendations for Hosts
- Focus marketing internationally, particularly towards travelers from France.
- Tailor amenities and listing descriptions to appeal to the dominant Post-2000s (Gen Z/Alpha) demographic (e.g., highlight fast WiFi, smart home features, local guides).
- Highlight unique local experiences or amenities relevant to the primary guest profile.
- Consider seasonal promotions aligned with peak travel times for key origin markets.
Nearby Short-Term Rental Market Comparison
How does the Vecchiano Airbnb market stack up against its neighbors? Compare key performance metrics like average monthly revenue, ADR, and occupancy rates in surrounding areas to understand the broader regional STR landscape.
| Market | Active Properties | Monthly Revenue | Daily Rate | Avg. Occupancy |
|---|---|---|---|---|
| Tignano | 12 | $4,160 | $366.92 | 45% |
| Marciano della Chiana | 17 | $3,823 | $545.25 | 35% |
| Castelfranco di Sotto | 47 | $3,777 | $377.39 | 39% |
| Portofino | 77 | $3,585 | $509.42 | 38% |
| Buonconvento | 60 | $3,186 | $440.58 | 43% |
| Radda in Chianti | 94 | $3,098 | $361.57 | 39% |
| Monterosso al Mare | 370 | $2,991 | $264.15 | 52% |
| Impruneta | 146 | $2,887 | $297.45 | 40% |
| Lastra a Signa | 96 | $2,760 | $311.91 | 43% |
| Florence | 10,496 | $2,755 | $225.30 | 49% |