Ichikawa Airbnb Market Analysis 2026: Short Term Rental Data & Vacation Rental Statistics in Chiba Prefecture, Japan
Is Airbnb profitable in Ichikawa in 2026? Explore comprehensive Airbnb analytics for Ichikawa, Chiba Prefecture, Japan to uncover income potential. This 2026 STR market report for Ichikawa, based on AirROI data from February 2025 to January 2026, reveals key trends in the niche market of 57 active listings.
Whether you're considering an Airbnb investment in Ichikawa, optimizing your existing vacation rental, or exploring rental arbitrage opportunities, understanding the Ichikawa Airbnb data is crucial. Navigating the high regulation landscape is key to maximizing your short term rental income potential. Let's dive into the specifics.
Key Ichikawa Airbnb Performance Metrics Overview
Monthly Airbnb Revenue Variations & Income Potential in Ichikawa (2026)
Understanding the monthly revenue variations for Airbnb listings in Ichikawa is key to maximizing your short term rental income potential. Seasonality significantly impacts earnings. Our analysis, based on data from the past 12 months, shows that the peak revenue month for STRs in Ichikawa is typically April, while January often presents the lowest earnings, highlighting opportunities for strategic pricing adjustments during shoulder and low seasons. Explore the typical Airbnb income in Ichikawa across different performance tiers:
- Best-in-class properties (Top 10%) achieve $3,790+ monthly, often utilizing dynamic pricing and superior guest experiences.
- Strong performing properties (Top 25%) earn $2,877 or more, indicating effective management and desirable locations/amenities.
- Typical properties (Median) generate around $1,751 per month, representing the average market performance.
- Entry-level properties (Bottom 25%) see earnings around $1,008, often with potential for optimization.
Average Monthly Airbnb Earnings Trend in Ichikawa
Ichikawa Airbnb Occupancy Rate Trends (2026)
Maximize your bookings by understanding the Ichikawa STR occupancy trends. Seasonal demand shifts significantly influence how often properties are booked. Typically, Aprilsees the highest demand (peak season occupancy), while January experiences the lowest (low season). Effective strategies, like adjusting minimum stays or offering promotions, can boost occupancy during slower periods. Here's how different property tiers perform in Ichikawa:
- Best-in-class properties (Top 10%) achieve 91%+ occupancy, indicating high desirability and potentially optimized availability.
- Strong performing properties (Top 25%) maintain 80% or higher occupancy, suggesting good market fit and guest satisfaction.
- Typical properties (Median) have an occupancy rate around 59%.
- Entry-level properties (Bottom 25%) average 38% occupancy, potentially facing higher vacancy.
Average Monthly Occupancy Rate Trend in Ichikawa
Average Daily Rate (ADR) Airbnb Trends in Ichikawa (2026)
Effective short term rental pricing strategy in Ichikawa involves understanding monthly ADR fluctuations. The Average Daily Rate (ADR) for Airbnb in Ichikawa typically peaks in May and dips lowest during January. Leveraging Airbnb dynamic pricing tools or strategies based on this seasonality can significantly boost revenue. Here's a look at the typical nightly rates achieved:
- Best-in-class properties (Top 10%) command rates of $189+ per night, often due to premium features or locations.
- Strong performing properties (Top 25%) achieve nightly rates of $147 or more.
- Typical properties (Median) charge around $101 per night.
- Entry-level properties (Bottom 25%) earn around $71 per night.
Average Daily Rate (ADR) Trend by Month in Ichikawa
Get Live Ichikawa Market Intelligence 👇

Explore Real-time Analytics
Airbnb Seasonality Analysis & Trends in Ichikawa (2026)
Peak Season (April, October, November)
- Revenue averages $2,500 per month
- Occupancy rates average 70.0%
- Daily rates average $110
Shoulder Season
- Revenue averages $1,973 per month
- Occupancy maintains around 57.5%
- Daily rates hold near $114
Low Season (January, July, September)
- Revenue drops to average $1,659 per month
- Occupancy decreases to average 48.2%
- Daily rates adjust to average $112
Seasonality Insights for Ichikawa
- The Airbnb seasonality in Ichikawa shows moderate seasonality with distinct peak and low periods. While the sections above show seasonal averages, it's also insightful to look at the extremes:
- During the high season, the absolute peak month showcases Ichikawa's highest earning potential, with monthly revenues capable of climbing to $2,575, occupancy reaching a high of 75.6%, and ADRs peaking at $118.
- Conversely, the slowest single month of the year, typically falling within the low season, marks the market's lowest point. In this month, revenue might dip to $1,457, occupancy could drop to 43.7%, and ADRs may adjust down to $107.
- Understanding both the seasonal averages and these monthly peaks and troughs in revenue, occupancy, and ADR is crucial for maximizing your Airbnb profit potential in Ichikawa.
Seasonal Strategies for Maximizing Profit
- Peak Season: Maximize revenue through premium pricing and potentially longer minimum stays. Ensure high availability.
- Low Season: Offer competitive pricing, special promotions (e.g., extended stay discounts), and flexible cancellation policies. Target off-season travelers like remote workers or budget-conscious guests.
- Shoulder Seasons: Implement dynamic pricing that balances peak and low rates. Target weekend travelers or specific events. Offer slightly more flexible terms than peak season.
- Regularly analyze your own performance against these Ichikawa seasonality benchmarks and adjust your pricing and availability strategy accordingly.
Best Areas for Airbnb Investment in Ichikawa (2026)
Exploring the top neighborhoods for short-term rentals in Ichikawa? This section highlights key areas, outlining why they are attractive for hosts and guests, along with notable local attractions. Consider these locations based on your target guest profile and investment strategy.
| Neighborhood / Area | Why Host Here? (Target Guests & Appeal) | Key Attractions & Landmarks |
|---|---|---|
| Chiba City | Chiba City's proximity to Tokyo makes it a convenient location for visitors looking for affordability and accessibility. It offers a mix of urban attractions and cultural experiences. | Chiba Castle, Chiba Port Tower, Inage Seaside Park, Makuhari Messe, Chiba Park |
| Urayasu | Known for its proximity to Tokyo Disneyland, Urayasu is a favorite among families and theme park enthusiasts. The location offers a variety of entertainment options and dining. | Tokyo Disneyland, Tokyo DisneySea, Urayausumi Shrine, Urayasu Fish Market, Kasai Rinkai Park |
| Funabashi | Funabashi provides a blend of suburban living and urban convenience. With shopping complexes and recreational areas, it appeals to both families and business travelers. | Funabashi Andersen Park, Lalaport Funabashi, Funabashi City Library, Mizumoto Park, Funabashi City Memorial Museum |
| Kisarazu | Kisarazu is attractive for its waterfront areas and natural beauty. It offers leisure activities and is well connected to the Tokyo area. | Kisarazu Quay, Kisarazu Coast, Umihotaru Parking Area, Kisarazu City Museum, Nihonbashi Garden |
| Narita | Home to Narita International Airport, this area attracts travelers looking for convenience and offers a glimpse of traditional Japanese culture. | Naritasan Shinshoji Temple, Narita Market, Narita Yume Farm, Sakura no Yama Park, Narita Airport Museum |
| Ichikawa | Ichikawa is a peaceful suburb with easy access to Tokyo. It's known for its parks and local shopping streets, making it great for a quiet stay. | Ichikawa City Museum of Literature, Shimmei Shrine, Gyotoku Bird Sanctuary, Mikazukigaoka Park, Ichikawa Kasai Rinkai Park |
| Shinjuku | A bustling urban center known for its skyscrapers and nightlife. Ideal for travelers seeking a vibrant city experience with lots of entertainment options. | Tokyo Metropolitan Government Building, Shinjuku Gyoen National Garden, Omoide Yokocho, Golden Gai, Robot Restaurant |
| Katsushika | This area features a mix of traditional and modern experiences, offering visitors a taste of local life while being close to major attractions. | Shibamata Taishakuten Temple, Shibamata Park, Katsushika Symphony Hills, Kameari Park, Yagiri no Watashi |
Understanding Airbnb License Requirements & STR Laws in Ichikawa (2026)
Yes, Ichikawa, Chiba Prefecture, Japan enforces high STR regulations. Obtaining a license and ensuring compliance is almost certainly required according to current 2026 STR laws. Always verify the latest short term rental regulations and Airbnb license requirements directly with local government authorities for Ichikawa to ensure full compliance before hosting.
(Source: AirROI data, 2026, based on 98% licensed listings)
Top Performing Airbnb Properties in Ichikawa (2026)
Benchmark your potential! Explore examples of top-performing Airbnb properties in Ichikawabased on Trailing Twelve Month (TTM) revenue. Analyze their characteristics, revenue, occupancy rate, and ADR to understand what drives success in this market.
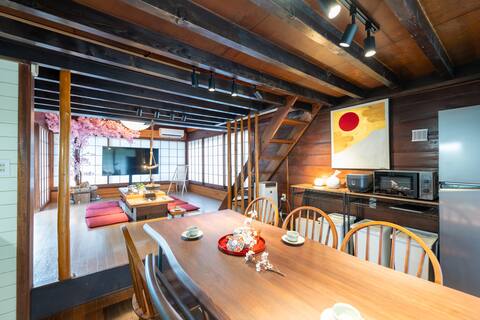
30 minutes to Tokyo Station/Japanese Irori-style Accommodation/Entire Building/16 people/130 ㎡/2 Bat
Entire Place • 4 bedrooms
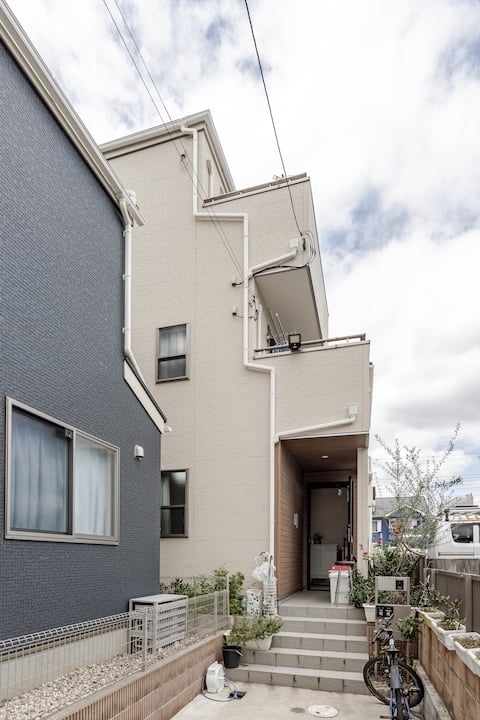
Built in 2021, a whole Japanese-style villa that can accommodate 8 people, free parking, 15 minutes
Private Room • 4 bedrooms
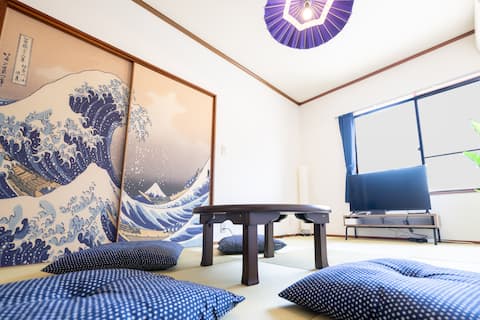
2 min from station, family-friendly stay.
Entire Place • 2 bedrooms

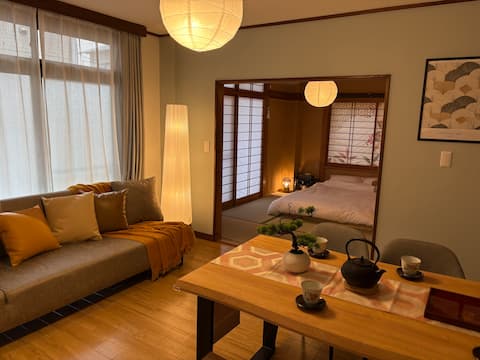
102 Hotel Space! Great access to Disney Resort, Tokyo sightseeing, and Makuhari!
Entire Place • 1 bedroom
3LDK| 6min from Station|10 min to Disney by car
Entire Place • 4 bedrooms
Entire house for rent in Ichikawa, Chiba Prefecture
Entire Place • 3 bedrooms
Note: Performance varies based on location, size, amenities, seasonality, and management quality. Data reflects the past 12 months.
Top Performing Airbnb Hosts in Ichikawa (2026)
Learn from the best! This table showcases top-performing Airbnb hosts in Ichikawa based on the number of properties managed and estimated total revenue over the past year. Analyze their scale and performance metrics.
| Host Name | Properties | Grossing Revenue | Stay Reviews | Avg Rating |
|---|---|---|---|---|
| Yoshiko | 2 | $85,921 | 59 | 4.89/5.0 |
| Yoshi | 3 | $69,992 | 366 | 4.92/5.0 |
| Tomio | 2 | $68,961 | 59 | 4.98/5.0 |
| Nishigori | 3 | $66,033 | 52 | 4.98/5.0 |
| 永信 | 3 | $62,987 | 170 | 4.62/5.0 |
| Masafumi | 3 | $59,874 | 150 | 4.83/5.0 |
| 雪娇 | 2 | $56,767 | 89 | 4.85/5.0 |
| Shuhei | 3 | $53,804 | 318 | 4.82/5.0 |
| Takahiro | 1 | $50,427 | 26 | 4.92/5.0 |
| Anna | 2 | $48,451 | 35 | 5.00/5.0 |
Analyzing the strategies of top hosts, such as their property selection, pricing, and guest communication, can offer valuable lessons for optimizing your own Airbnb operations in Ichikawa.
Dive Deeper: Advanced Ichikawa STR Market Data (2026)
Ready to unlock more insights? AirROI provides access to advanced metrics and comprehensive Airbnb data for Ichikawa. Explore detailed analytics beyond this report to refine your investment strategy, optimize pricing, and maximize your vacation rental profits.
Explore Advanced MetricsIchikawa Short-Term Rental Market Composition (2026): Property & Room Types
Room Type Distribution
Property Type Distribution
Market Composition Insights for Ichikawa
- The Ichikawa Airbnb market composition is heavily skewed towards Entire Home/Apt listings, which make up 75.4% of the 57 active rentals. This indicates strong guest preference for privacy and space.
- Looking at the property type distribution in Ichikawa, Apartment/Condo properties are the most common (52.6%), reflecting the local real estate landscape.
- Houses represent a significant 40.4% portion, catering likely to families or larger groups.
- The presence of 5.3% Hotel/Boutique listings indicates integration with traditional hospitality.
- Smaller segments like outdoor/unique (combined 1.8%) offer potential for unique stay experiences.
Ichikawa Airbnb Room Capacity Analysis (2026): Bedroom Distribution
Distribution of Listings by Number of Bedrooms
Room Capacity Insights for Ichikawa
- The dominant room capacity in Ichikawa is 1 bedroom listings, making up 42.1% of the market. This suggests a strong demand for properties suitable for couples or solo travelers.
- Together, 1 bedroom and 2 bedrooms properties represent 63.2% of the active Airbnb listings in Ichikawa, indicating a high concentration in these sizes.
- A significant 26.3% of listings offer 3+ bedrooms, catering to larger groups and families seeking more space in Ichikawa.
Ichikawa Vacation Rental Guest Capacity Trends (2026)
Distribution of Listings by Guest Capacity
Guest Capacity Insights for Ichikawa
- The most common guest capacity trend in Ichikawa vacation rentals is listings accommodating 8+ guests (31.6%). This suggests the primary traveler segment is likely larger groups.
- Properties designed for 8+ guests and 3 guests dominate the Ichikawa STR market, accounting for 47.4% of listings.
- 45.7% of properties accommodate 6+ guests, serving the market segment for larger families or group travel in Ichikawa.
- On average, properties in Ichikawa are equipped to host 4.9 guests.
Ichikawa Airbnb Booking Patterns (2026): Available vs. Booked Days
Available Days Distribution
Booked Days Distribution
Booking Pattern Insights for Ichikawa
- The most common availability pattern in Ichikawa falls within the 91-180 days range, representing 43.9% of listings. This suggests many properties have significant open periods on their calendars.
- Approximately 45.6% of listings show high availability (181+ days open annually), indicating potential for increased bookings or specific owner usage patterns.
- For booked days, the 181-270 days range is most frequent in Ichikawa (42.1%), reflecting common guest stay durations or potential owner blocking patterns.
- A notable 54.4% of properties secure long booking periods (181+ days booked per year), highlighting successful long-term rental strategies or significant owner usage.
Ichikawa Airbnb Minimum Stay Requirements Analysis
Distribution of Listings by Minimum Night Requirement
1 Night
27 listings
47.4% of total
2 Nights
10 listings
17.5% of total
3 Nights
1 listings
1.8% of total
4-6 Nights
2 listings
3.5% of total
7-29 Nights
3 listings
5.3% of total
30+ Nights
14 listings
24.6% of total
Key Insights
- The most prevalent minimum stay requirement in Ichikawa is 1 Night, adopted by 47.4% of listings. This highlights the market's preference for shorter, flexible bookings.
- A strong majority (64.9%) of the Ichikawa Airbnb data shows acceptance of very short stays (1-2 nights), indicating a dynamic, high-turnover market.
- A significant segment (24.6%) caters to monthly stays (30+ nights) in Ichikawa, pointing to opportunities in the extended-stay market.
Recommendations
- Align with the market by considering a 1 Night minimum stay, as 47.4% of Ichikawa hosts use this setting.
- Explore offering discounts for stays of 30+ nights to attract the 24.6% of the market seeking extended stays.
- Adjust minimum nights based on seasonality – potentially shorter during low season and longer during peak demand periods in Ichikawa.
Ichikawa Airbnb Cancellation Policy Trends Analysis (2026)
Flexible
4 listings
7% of total
Moderate
29 listings
50.9% of total
Firm
18 listings
31.6% of total
Strict
6 listings
10.5% of total
Cancellation Policy Insights for Ichikawa
- The prevailing Airbnb cancellation policy trend in Ichikawa is Moderate, used by 50.9% of listings.
- There's a relatively balanced mix between guest-friendly (57.9%) and stricter (42.1%) policies, offering choices for different guest needs.
Recommendations for Hosts
- Consider adopting a Moderate policy to align with the 50.9% market standard in Ichikawa.
- Using a Strict policy might deter some guests, as only 10.5% of listings use it. Evaluate if potential revenue protection outweighs possible lower booking rates.
- Regularly review your cancellation policy against competitors and market demand shifts in Ichikawa.
Ichikawa STR Booking Lead Time Analysis (2026)
Average Booking Lead Time by Month
Booking Lead Time Insights for Ichikawa
- The overall average booking lead time for vacation rentals in Ichikawa is 52 days.
- Guests book furthest in advance for stays during April (average 72 days), likely coinciding with peak travel demand or local events.
- The shortest booking windows occur for stays in February (average 35 days), indicating more last-minute travel plans during this time.
- Seasonally, Spring (56 days avg.) sees the longest lead times, while Winter (45 days avg.) has the shortest, reflecting typical travel planning cycles.
Recommendations for Hosts
- Use the overall average lead time (52 days) as a baseline for your pricing and availability strategy in Ichikawa.
- For April stays, consider implementing length-of-stay discounts or slightly higher rates for bookings made less than 72 days out to capitalize on advance planning.
- Target marketing efforts for the Spring season well in advance (at least 56 days) to capture early planners.
- Monitor your own booking lead times against these Ichikawa averages to identify opportunities for dynamic pricing adjustments.
Popular & Essential Airbnb Amenities in Ichikawa (2026)
Amenity Prevalence
Amenity Insights for Ichikawa
- Essential amenities in Ichikawa that guests expect include: Air conditioning, Smoke alarm, Wifi, Hair dryer, Shampoo. Lacking these (any) could significantly impact bookings.
- Popular amenities like Hot water, Heating, Refrigerator are common but not universal. Offering these can provide a competitive edge.
Recommendations for Hosts
- Ensure your listing includes all essential amenities for Ichikawa: Air conditioning, Smoke alarm, Wifi, Hair dryer, Shampoo.
- Prioritize adding missing essentials: Hair dryer, Shampoo.
- Consider adding popular differentiators like Hot water or Heating to increase appeal.
- Highlight unique or less common amenities you offer (e.g., hot tub, dedicated workspace, EV charger) in your listing description and photos.
- Regularly check competitor amenities in Ichikawa to stay competitive.
Ichikawa Airbnb Guest Demographics & Profile Analysis (2026)
Guest Profile Summary for Ichikawa
- The typical guest profile for Airbnb in Ichikawa consists of predominantly international visitors (88%), with top international origins including Japan, typically belonging to the Post-2000s (Gen Z/Alpha) group (50%), primarily speaking English or Japanese.
- Domestic travelers account for 12.3% of guests.
- Key international markets include United States (26.8%) and Japan (12.3%).
- Top languages spoken are English (48.7%) followed by Japanese (12.8%).
- A significant demographic segment is the Post-2000s (Gen Z/Alpha) group, representing 50% of guests.
Recommendations for Hosts
- Focus marketing internationally, particularly towards travelers from Japan.
- Tailor amenities and listing descriptions to appeal to the dominant Post-2000s (Gen Z/Alpha) demographic (e.g., highlight fast WiFi, smart home features, local guides).
- Highlight unique local experiences or amenities relevant to the primary guest profile.
- Consider seasonal promotions aligned with peak travel times for key origin markets.
Nearby Short-Term Rental Market Comparison
How does the Ichikawa Airbnb market stack up against its neighbors? Compare key performance metrics like average monthly revenue, ADR, and occupancy rates in surrounding areas to understand the broader regional STR landscape.
| Market | Active Properties | Monthly Revenue | Daily Rate | Avg. Occupancy |
|---|---|---|---|---|
| Shinagawa City | 50 | $7,769 | $428.93 | 62% |
| Futtsu | 31 | $5,187 | $369.80 | 44% |
| Kyonan | 15 | $5,099 | $419.89 | 42% |
| Adachi City | 47 | $4,752 | $301.69 | 50% |
| Kita | 15 | $4,563 | $305.24 | 57% |
| Shirako | 22 | $4,439 | $359.94 | 34% |
| Nagatoro | 10 | $4,035 | $249.70 | 52% |
| Kamogawa | 36 | $4,007 | $296.27 | 37% |
| Hakone | 335 | $3,905 | $289.84 | 48% |
| Karuizawa | 121 | $3,852 | $396.31 | 39% |