Sagamihara Airbnb Market Analysis 2026: Short Term Rental Data & Vacation Rental Statistics in Kanagawa Prefecture, Japan
Is Airbnb profitable in Sagamihara in 2026? Explore comprehensive Airbnb analytics for Sagamihara, Kanagawa Prefecture, Japan to uncover income potential. This 2026 STR market report for Sagamihara, based on AirROI data from February 2025 to January 2026, reveals key trends in the niche market of 31 active listings.
Whether you're considering an Airbnb investment in Sagamihara, optimizing your existing vacation rental, or exploring rental arbitrage opportunities, understanding the Sagamihara Airbnb data is crucial. Navigating the high regulation landscape is key to maximizing your short term rental income potential. Let's dive into the specifics.
Key Sagamihara Airbnb Performance Metrics Overview
Monthly Airbnb Revenue Variations & Income Potential in Sagamihara (2026)
Understanding the monthly revenue variations for Airbnb listings in Sagamihara is key to maximizing your short term rental income potential. Seasonality significantly impacts earnings. Our analysis, based on data from the past 12 months, shows that the peak revenue month for STRs in Sagamihara is typically August, while April often presents the lowest earnings, highlighting opportunities for strategic pricing adjustments during shoulder and low seasons. Explore the typical Airbnb income in Sagamihara across different performance tiers:
- Best-in-class properties (Top 10%) achieve $5,122+ monthly, often utilizing dynamic pricing and superior guest experiences.
- Strong performing properties (Top 25%) earn $2,873 or more, indicating effective management and desirable locations/amenities.
- Typical properties (Median) generate around $1,491 per month, representing the average market performance.
- Entry-level properties (Bottom 25%) see earnings around $517, often with potential for optimization.
Average Monthly Airbnb Earnings Trend in Sagamihara
Sagamihara Airbnb Occupancy Rate Trends (2026)
Maximize your bookings by understanding the Sagamihara STR occupancy trends. Seasonal demand shifts significantly influence how often properties are booked. Typically, Septembersees the highest demand (peak season occupancy), while June experiences the lowest (low season). Effective strategies, like adjusting minimum stays or offering promotions, can boost occupancy during slower periods. Here's how different property tiers perform in Sagamihara:
- Best-in-class properties (Top 10%) achieve 75%+ occupancy, indicating high desirability and potentially optimized availability.
- Strong performing properties (Top 25%) maintain 58% or higher occupancy, suggesting good market fit and guest satisfaction.
- Typical properties (Median) have an occupancy rate around 36%.
- Entry-level properties (Bottom 25%) average 21% occupancy, potentially facing higher vacancy.
Average Monthly Occupancy Rate Trend in Sagamihara
Average Daily Rate (ADR) Airbnb Trends in Sagamihara (2026)
Effective short term rental pricing strategy in Sagamihara involves understanding monthly ADR fluctuations. The Average Daily Rate (ADR) for Airbnb in Sagamihara typically peaks in August and dips lowest during April. Leveraging Airbnb dynamic pricing tools or strategies based on this seasonality can significantly boost revenue. Here's a look at the typical nightly rates achieved:
- Best-in-class properties (Top 10%) command rates of $344+ per night, often due to premium features or locations.
- Strong performing properties (Top 25%) achieve nightly rates of $186 or more.
- Typical properties (Median) charge around $101 per night.
- Entry-level properties (Bottom 25%) earn around $62 per night.
Average Daily Rate (ADR) Trend by Month in Sagamihara
Get Live Sagamihara Market Intelligence 👇

Explore Real-time Analytics
Airbnb Seasonality Analysis & Trends in Sagamihara (2026)
Peak Season (August, November, September)
- Revenue averages $2,625 per month
- Occupancy rates average 45.3%
- Daily rates average $147
Shoulder Season
- Revenue averages $2,071 per month
- Occupancy maintains around 39.0%
- Daily rates hold near $143
Low Season (February, April, June)
- Revenue drops to average $1,697 per month
- Occupancy decreases to average 38.8%
- Daily rates adjust to average $140
Seasonality Insights for Sagamihara
- The Airbnb seasonality in Sagamihara shows highly seasonal trends requiring careful strategy. While the sections above show seasonal averages, it's also insightful to look at the extremes:
- During the high season, the absolute peak month showcases Sagamihara's highest earning potential, with monthly revenues capable of climbing to $3,128, occupancy reaching a high of 45.9%, and ADRs peaking at $155.
- Conversely, the slowest single month of the year, typically falling within the low season, marks the market's lowest point. In this month, revenue might dip to $1,585, occupancy could drop to 34.2%, and ADRs may adjust down to $136.
- Understanding both the seasonal averages and these monthly peaks and troughs in revenue, occupancy, and ADR is crucial for maximizing your Airbnb profit potential in Sagamihara.
Seasonal Strategies for Maximizing Profit
- Peak Season: Maximize revenue through premium pricing and potentially longer minimum stays. Ensure high availability.
- Low Season: Offer competitive pricing, special promotions (e.g., extended stay discounts), and flexible cancellation policies. Target off-season travelers like remote workers or budget-conscious guests.
- Shoulder Seasons: Implement dynamic pricing that balances peak and low rates. Target weekend travelers or specific events. Offer slightly more flexible terms than peak season.
- Regularly analyze your own performance against these Sagamihara seasonality benchmarks and adjust your pricing and availability strategy accordingly.
Best Areas for Airbnb Investment in Sagamihara (2026)
Exploring the top neighborhoods for short-term rentals in Sagamihara? This section highlights key areas, outlining why they are attractive for hosts and guests, along with notable local attractions. Consider these locations based on your target guest profile and investment strategy.
| Neighborhood / Area | Why Host Here? (Target Guests & Appeal) | Key Attractions & Landmarks |
|---|---|---|
| Sagamihara City Center | The bustling heart of Sagamihara, offering convenience with shops, restaurants, and easy transport links. Ideal for both tourists and business travelers looking for accessible accommodations. | Sagamihara Central Park, Sagamihara Museum of History and Folklore, Sagamihara Ai-Park, Matsumoto Kiyoshi Store, Kabukichō Shopping Street |
| Soka Park Area | A serene area perfect for nature lovers and families, near beautiful parks and recreational spaces. Great for visitors seeking a more laid-back experience away from urban hustle. | Soka Park, Tama River, Miyamaedaira Park, Hiking trails, Picnic areas |
| Asamizo Park | Located in a scenic area with great views, this park attracts outdoor enthusiasts and those looking for a peaceful retreat. A unique offering in the Airbnb market for local experiences. | Asamizo Park, Outdoor sports facilities, Nature walks, Family-friendly play areas, Event spaces |
| Kanagawa Prefectural Museum of Modern Art | An art-focused area that attracts culture seekers interested in visiting museums and galleries. Ideal for travelers focused on arts and culture in their journey. | Kanagawa Prefectural Museum of Modern Art, Various art installations and exhibitions, Cafés and artisan shops nearby, Cultural events |
| Tama Plaza District | A thriving shopping area with plenty of dining and entertainment options. Very appealing to tourists looking for a complete urban experience with local flavor. | Tama Plaza Terrace, Restaurants and cafés, Local markets, Cinemas, Shopping centers |
| Hashimoto Station Area | A major transportation hub that connects to Tokyo and other key areas, perfect for visitors looking to explore beyond Sagamihara while having comfortable accommodation. | Hashimoto Station, Local shops and dining options, Convenient access to trains and buses, Shopping】, Cultural experiences |
| Sagamihara's Historical District | This area is rich in history and culture, attracting visitors interested in learning about Japan's past. Great for those who appreciate traditional experiences. | Historical sites, Traditional Japanese architecture, Cultural festivals, Local food stalls, Heritage sites |
| Business District near Sagamihara Station | Ideal for business travelers seeking accommodation close to major offices and business facilities. Offers easy access to transport and local amenities. | Sagamihara Station, Business centers, Cafés, Restaurants suited for working professionals, Convenient transport links |
Understanding Airbnb License Requirements & STR Laws in Sagamihara (2026)
Yes, Sagamihara, Kanagawa Prefecture, Japan enforces high STR regulations. Obtaining a license and ensuring compliance is almost certainly required according to current 2026 STR laws. Always verify the latest short term rental regulations and Airbnb license requirements directly with local government authorities for Sagamihara to ensure full compliance before hosting.
(Source: AirROI data, 2026, based on 97% licensed listings)
Top Performing Airbnb Properties in Sagamihara (2026)
Benchmark your potential! Explore examples of top-performing Airbnb properties in Sagamiharabased on Trailing Twelve Month (TTM) revenue. Analyze their characteristics, revenue, occupancy rate, and ADR to understand what drives success in this market.
An hour and a half from the city center. Yuzu no Ie is an old house with a superb view of the Tanzaw
Private Room • 1 bedroom
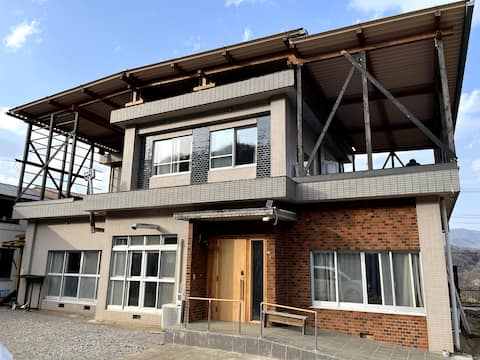
New house with no name: Quiet location next to a field. There is also a wood stove.
Entire Place • 5 bedrooms

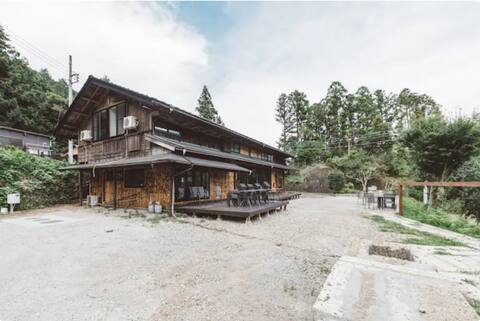
Music training camps available! Up to 30 people. An old house with a gassho-zukuri architectural sty
Entire Place • 5 bedrooms

Sagamiko basshouse
Entire Place • 3 bedrooms

BEGOPEN-HOUSE | 5-minute walk from Fukanobana Station! Spacious 60 ㎡ studio
Entire Place • 1 bedroom
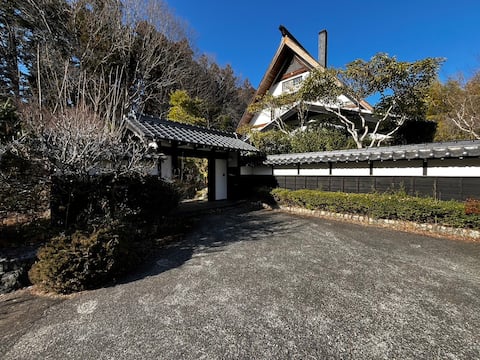
Music practice camps available! A large gassho-style villa. There is a pool table and a shogi table.
Entire Place • 5 bedrooms
Note: Performance varies based on location, size, amenities, seasonality, and management quality. Data reflects the past 12 months.
Top Performing Airbnb Hosts in Sagamihara (2026)
Learn from the best! This table showcases top-performing Airbnb hosts in Sagamihara based on the number of properties managed and estimated total revenue over the past year. Analyze their scale and performance metrics.
| Host Name | Properties | Grossing Revenue | Stay Reviews | Avg Rating |
|---|---|---|---|---|
| 藤野倶楽部 | 9 | $313,837 | 912 | 4.74/5.0 |
| Haruka | 1 | $67,066 | 10 | 4.50/5.0 |
| Kensuke Asari | 1 | $54,186 | 247 | 4.87/5.0 |
| Rei | 1 | $48,453 | 79 | 4.85/5.0 |
| Miduki | 1 | $45,702 | 3 | 5.00/5.0 |
| 司郎 | 4 | $42,846 | 99 | 4.92/5.0 |
| Soichiro | 1 | $30,149 | 79 | 4.78/5.0 |
| 峰麓舎 | 1 | $23,977 | 38 | 4.79/5.0 |
| Masahiro | 1 | $17,127 | 33 | 4.88/5.0 |
| Kyoko | 1 | $15,204 | 123 | 4.89/5.0 |
Analyzing the strategies of top hosts, such as their property selection, pricing, and guest communication, can offer valuable lessons for optimizing your own Airbnb operations in Sagamihara.
Dive Deeper: Advanced Sagamihara STR Market Data (2026)
Ready to unlock more insights? AirROI provides access to advanced metrics and comprehensive Airbnb data for Sagamihara. Explore detailed analytics beyond this report to refine your investment strategy, optimize pricing, and maximize your vacation rental profits.
Explore Advanced MetricsSagamihara Short-Term Rental Market Composition (2026): Property & Room Types
Room Type Distribution
Property Type Distribution
Market Composition Insights for Sagamihara
- The Sagamihara Airbnb market composition is heavily skewed towards Entire Home/Apt listings, which make up 54.8% of the 31 active rentals. This indicates strong guest preference for privacy and space.
- However, a notable 41.9% share for Private Rooms suggests opportunities for budget-conscious travelers or hosts renting out spare rooms.
- Looking at the property type distribution in Sagamihara, House properties are the most common (61.3%), reflecting the local real estate landscape.
- Houses represent a significant 61.3% portion, catering likely to families or larger groups.
- The presence of 6.5% Hotel/Boutique listings indicates integration with traditional hospitality.
Sagamihara Airbnb Room Capacity Analysis (2026): Bedroom Distribution
Distribution of Listings by Number of Bedrooms
Room Capacity Insights for Sagamihara
- The dominant room capacity in Sagamihara is 1 bedroom listings, making up 38.7% of the market. This suggests a strong demand for properties suitable for couples or solo travelers.
- Together, 1 bedroom and 3 bedrooms properties represent 58.1% of the active Airbnb listings in Sagamihara, indicating a high concentration in these sizes.
- A significant 29.1% of listings offer 3+ bedrooms, catering to larger groups and families seeking more space in Sagamihara.
Sagamihara Vacation Rental Guest Capacity Trends (2026)
Distribution of Listings by Guest Capacity
Guest Capacity Insights for Sagamihara
- The most common guest capacity trend in Sagamihara vacation rentals is listings accommodating 8+ guests (29%). This suggests the primary traveler segment is likely larger groups.
- Properties designed for 8+ guests and 4 guests dominate the Sagamihara STR market, accounting for 48.4% of listings.
- 38.7% of properties accommodate 6+ guests, serving the market segment for larger families or group travel in Sagamihara.
- On average, properties in Sagamihara are equipped to host 4.2 guests.
Sagamihara Airbnb Booking Patterns (2026): Available vs. Booked Days
Available Days Distribution
Booked Days Distribution
Booking Pattern Insights for Sagamihara
- The most common availability pattern in Sagamihara falls within the 181-270 days range, representing 48.4% of listings. This suggests many properties have significant open periods on their calendars.
- Approximately 77.4% of listings show high availability (181+ days open annually), indicating potential for increased bookings or specific owner usage patterns.
- For booked days, the 91-180 days range is most frequent in Sagamihara (51.6%), reflecting common guest stay durations or potential owner blocking patterns.
- A notable 22.6% of properties secure long booking periods (181+ days booked per year), highlighting successful long-term rental strategies or significant owner usage.
Sagamihara Airbnb Minimum Stay Requirements Analysis
Distribution of Listings by Minimum Night Requirement
1 Night
29 listings
93.5% of total
2 Nights
1 listings
3.2% of total
4-6 Nights
1 listings
3.2% of total
Key Insights
- The most prevalent minimum stay requirement in Sagamihara is 1 Night, adopted by 93.5% of listings. This highlights the market's preference for shorter, flexible bookings.
- A strong majority (96.7%) of the Sagamihara Airbnb data shows acceptance of very short stays (1-2 nights), indicating a dynamic, high-turnover market.
Recommendations
- Align with the market by considering a 1 Night minimum stay, as 93.5% of Sagamihara hosts use this setting.
- Adjust minimum nights based on seasonality – potentially shorter during low season and longer during peak demand periods in Sagamihara.
Sagamihara Airbnb Cancellation Policy Trends Analysis (2026)
Flexible
12 listings
38.7% of total
Moderate
13 listings
41.9% of total
Firm
6 listings
19.4% of total
Cancellation Policy Insights for Sagamihara
- The prevailing Airbnb cancellation policy trend in Sagamihara is Moderate, used by 41.9% of listings.
- The market strongly favors guest-friendly terms, with 80.6% of listings offering Flexible or Moderate policies. This suggests guests in Sagamihara may expect booking flexibility.
Recommendations for Hosts
- Consider adopting a Moderate policy to align with the 41.9% market standard in Sagamihara.
- Regularly review your cancellation policy against competitors and market demand shifts in Sagamihara.
Sagamihara STR Booking Lead Time Analysis (2026)
Average Booking Lead Time by Month
Booking Lead Time Insights for Sagamihara
- The overall average booking lead time for vacation rentals in Sagamihara is 41 days.
- Guests book furthest in advance for stays during January (average 59 days), likely coinciding with peak travel demand or local events.
- The shortest booking windows occur for stays in May (average 32 days), indicating more last-minute travel plans during this time.
- Seasonally, Winter (52 days avg.) sees the longest lead times, while Spring (35 days avg.) has the shortest, reflecting typical travel planning cycles.
Recommendations for Hosts
- Use the overall average lead time (41 days) as a baseline for your pricing and availability strategy in Sagamihara.
- For January stays, consider implementing length-of-stay discounts or slightly higher rates for bookings made less than 59 days out to capitalize on advance planning.
- Target marketing efforts for the Winter season well in advance (at least 52 days) to capture early planners.
- Monitor your own booking lead times against these Sagamihara averages to identify opportunities for dynamic pricing adjustments.
Popular & Essential Airbnb Amenities in Sagamihara (2026)
Amenity Prevalence
Amenity Insights for Sagamihara
- Essential amenities in Sagamihara that guests expect include: Wifi, Heating, Hair dryer. Lacking these (any) could significantly impact bookings.
- Popular amenities like Shampoo, Air conditioning, Refrigerator are common but not universal. Offering these can provide a competitive edge.
Recommendations for Hosts
- Ensure your listing includes all essential amenities for Sagamihara: Wifi, Heating, Hair dryer.
- Prioritize adding missing essentials: Heating, Hair dryer.
- Consider adding popular differentiators like Shampoo or Air conditioning to increase appeal.
- Highlight unique or less common amenities you offer (e.g., hot tub, dedicated workspace, EV charger) in your listing description and photos.
- Regularly check competitor amenities in Sagamihara to stay competitive.
Sagamihara Airbnb Guest Demographics & Profile Analysis (2026)
Guest Profile Summary for Sagamihara
- The typical guest profile for Airbnb in Sagamihara consists of primarily domestic travelers (68%), often arriving from nearby Tokyo, typically belonging to the Post-2000s (Gen Z/Alpha) group (50%), primarily speaking English or Japanese.
- Domestic travelers account for 67.5% of guests.
- Key international markets include Japan (67.5%) and United States (7%).
- Top languages spoken are English (35.6%) followed by Japanese (32.7%).
- A significant demographic segment is the Post-2000s (Gen Z/Alpha) group, representing 50% of guests.
Recommendations for Hosts
- Target domestic marketing efforts towards travelers from Tokyo and Yokohama.
- Tailor amenities and listing descriptions to appeal to the dominant Post-2000s (Gen Z/Alpha) demographic (e.g., highlight fast WiFi, smart home features, local guides).
- Highlight unique local experiences or amenities relevant to the primary guest profile.
- Consider seasonal promotions aligned with peak travel times for key origin markets.
Nearby Short-Term Rental Market Comparison
How does the Sagamihara Airbnb market stack up against its neighbors? Compare key performance metrics like average monthly revenue, ADR, and occupancy rates in surrounding areas to understand the broader regional STR landscape.
| Market | Active Properties | Monthly Revenue | Daily Rate | Avg. Occupancy |
|---|---|---|---|---|
| Shinagawa City | 50 | $7,769 | $428.93 | 62% |
| Futtsu | 31 | $5,187 | $369.80 | 44% |
| Kyonan | 15 | $5,099 | $419.89 | 42% |
| Adachi City | 47 | $4,752 | $301.69 | 50% |
| Kita | 15 | $4,563 | $305.24 | 57% |
| Shirako | 22 | $4,439 | $359.94 | 34% |
| Nagatoro | 10 | $4,035 | $249.70 | 52% |
| Kamogawa | 36 | $4,007 | $296.27 | 37% |
| Hakone | 335 | $3,905 | $289.84 | 48% |
| Karuizawa | 121 | $3,852 | $396.31 | 39% |