Iida Airbnb Market Analysis 2026: Short Term Rental Data & Vacation Rental Statistics in Nagano Prefecture, Japan
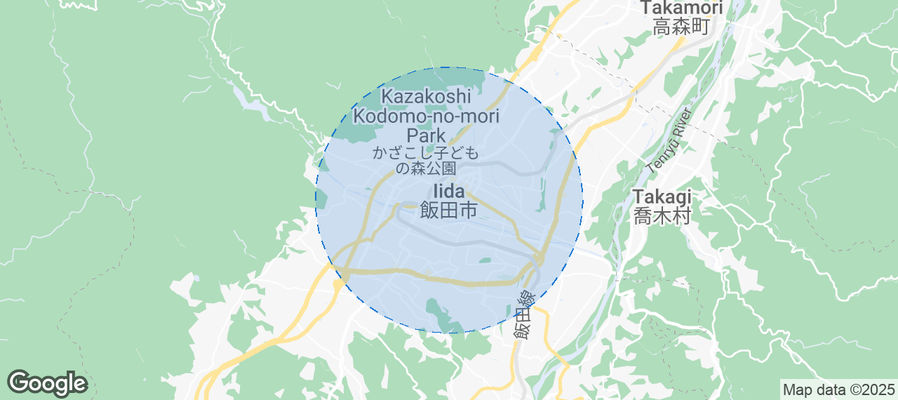
Is Airbnb profitable in Iida in 2026? Explore comprehensive Airbnb analytics for Iida, Nagano Prefecture, Japan to uncover income potential. This 2026 STR market report for Iida, based on AirROI data from February 2025 to January 2026, reveals key trends in the niche market of 21 active listings.
Whether you're considering an Airbnb investment in Iida, optimizing your existing vacation rental, or exploring rental arbitrage opportunities, understanding the Iida Airbnb data is crucial. Navigating the high regulation landscape is key to maximizing your short term rental income potential. Let's dive into the specifics.
Key Iida Airbnb Performance Metrics Overview
Monthly Airbnb Revenue Variations & Income Potential in Iida (2026)
Understanding the monthly revenue variations for Airbnb listings in Iida is key to maximizing your short term rental income potential. Seasonality significantly impacts earnings. Our analysis, based on data from the past 12 months, shows that the peak revenue month for STRs in Iida is typically February, while June often presents the lowest earnings, highlighting opportunities for strategic pricing adjustments during shoulder and low seasons. Explore the typical Airbnb income in Iida across different performance tiers:
- Best-in-class properties (Top 10%) achieve $3,235+ monthly, often utilizing dynamic pricing and superior guest experiences.
- Strong performing properties (Top 25%) earn $1,968 or more, indicating effective management and desirable locations/amenities.
- Typical properties (Median) generate around $1,043 per month, representing the average market performance.
- Entry-level properties (Bottom 25%) see earnings around $479, often with potential for optimization.
Average Monthly Airbnb Earnings Trend in Iida
Iida Airbnb Occupancy Rate Trends (2026)
Maximize your bookings by understanding the Iida STR occupancy trends. Seasonal demand shifts significantly influence how often properties are booked. Typically, Februarysees the highest demand (peak season occupancy), while June experiences the lowest (low season). Effective strategies, like adjusting minimum stays or offering promotions, can boost occupancy during slower periods. Here's how different property tiers perform in Iida:
- Best-in-class properties (Top 10%) achieve 71%+ occupancy, indicating high desirability and potentially optimized availability.
- Strong performing properties (Top 25%) maintain 52% or higher occupancy, suggesting good market fit and guest satisfaction.
- Typical properties (Median) have an occupancy rate around 31%.
- Entry-level properties (Bottom 25%) average 15% occupancy, potentially facing higher vacancy.
Average Monthly Occupancy Rate Trend in Iida
Average Daily Rate (ADR) Airbnb Trends in Iida (2026)
Effective short term rental pricing strategy in Iida involves understanding monthly ADR fluctuations. The Average Daily Rate (ADR) for Airbnb in Iida typically peaks in August and dips lowest during January. Leveraging Airbnb dynamic pricing tools or strategies based on this seasonality can significantly boost revenue. Here's a look at the typical nightly rates achieved:
- Best-in-class properties (Top 10%) command rates of $206+ per night, often due to premium features or locations.
- Strong performing properties (Top 25%) achieve nightly rates of $138 or more.
- Typical properties (Median) charge around $78 per night.
- Entry-level properties (Bottom 25%) earn around $58 per night.
Average Daily Rate (ADR) Trend by Month in Iida
Get Live Iida Market Intelligence 👇
Explore Real-time Analytics
Airbnb Seasonality Analysis & Trends in Iida (2026)
Peak Season (February, August, October)
- Revenue averages $1,873 per month
- Occupancy rates average 47.5%
- Daily rates average $117
Shoulder Season
- Revenue averages $1,507 per month
- Occupancy maintains around 34.9%
- Daily rates hold near $118
Low Season (January, June, December)
- Revenue drops to average $1,185 per month
- Occupancy decreases to average 27.0%
- Daily rates adjust to average $114
Seasonality Insights for Iida
- The Airbnb seasonality in Iida shows moderate seasonality with distinct peak and low periods. While the sections above show seasonal averages, it's also insightful to look at the extremes:
- During the high season, the absolute peak month showcases Iida's highest earning potential, with monthly revenues capable of climbing to $1,935, occupancy reaching a high of 51.4%, and ADRs peaking at $125.
- Conversely, the slowest single month of the year, typically falling within the low season, marks the market's lowest point. In this month, revenue might dip to $1,066, occupancy could drop to 20.0%, and ADRs may adjust down to $109.
- Understanding both the seasonal averages and these monthly peaks and troughs in revenue, occupancy, and ADR is crucial for maximizing your Airbnb profit potential in Iida.
Seasonal Strategies for Maximizing Profit
- Peak Season: Maximize revenue through premium pricing and potentially longer minimum stays. Ensure high availability.
- Low Season: Offer competitive pricing, special promotions (e.g., extended stay discounts), and flexible cancellation policies. Target off-season travelers like remote workers or budget-conscious guests.
- Shoulder Seasons: Implement dynamic pricing that balances peak and low rates. Target weekend travelers or specific events. Offer slightly more flexible terms than peak season.
- Regularly analyze your own performance against these Iida seasonality benchmarks and adjust your pricing and availability strategy accordingly.
Best Areas for Airbnb Investment in Iida (2026)
Exploring the top neighborhoods for short-term rentals in Iida? This section highlights key areas, outlining why they are attractive for hosts and guests, along with notable local attractions. Consider these locations based on your target guest profile and investment strategy.
| Neighborhood / Area | Why Host Here? (Target Guests & Appeal) | Key Attractions & Landmarks |
|---|---|---|
| Iida City Center | The heart of Iida, offering a mix of shopping, dining, and cultural experiences. Proximity to local attractions makes it a prime spot for tourists. | Iida Onsen, Iida City Museum of Art, Yamabiko no Sato, Iida City Park, local eateries and shops |
| Kiso Valley | A beautiful scenic area near Iida known for its breathtaking landscapes and traditional wooden houses. An attractive option for nature lovers and history enthusiasts. | Nakasendo Trail, Kiso-Fukushima, Yamabiko Pass, historical towns of Magome and Tsumago, local outdoor activities |
| Tenryukyo Gorge | A stunning natural area that attracts visitors for its scenic beauty and seasonal foliage. Great for those seeking outdoor experiences and relaxation. | Tenryukyo Gorge, hiking trails, nature observation points, hot springs nearby |
| Shirahone Onsen | A famous hot spring area nearby, renowned for its beautiful mountain setting and natural bathing experiences. Attracts visitors seeking wellness and tranquility. | Onsen baths, local ryokans, scenic mountain views, nature walks |
| Kamoshika Park | A lovely park area that's great for family activities and leisure. Close enough to the city for convenience while providing a natural retreat. | Playgrounds, picnic areas, open green spaces, walking trails, local wildlife |
| Iida Caves | An intriguing natural site that draws adventure seekers and explorers. Unique attractions for tourists looking to experience Iida's geological features. | Iida Caves, guided tours, geological formations, adventure activities |
| Mikuriya Shrine | A cultural and historical site that offers insights into the local heritage. Attracts those interested in traditional Japanese culture and architecture. | Cultural events at the shrine, beautiful shrine architecture, lush gardens |
| Yamabiko Takayama | A picturesque mountain area that serves as a gateway for outdoor activities and seasonal tourism. Perfect for attracting nature enthusiasts and adventure seekers. | Hiking routes, scenic views, seasonal flora and fauna festivals, mountain activities |
Understanding Airbnb License Requirements & STR Laws in Iida (2026)
Yes, Iida, Nagano Prefecture, Japan enforces high STR regulations. Obtaining a license and ensuring compliance is almost certainly required according to current 2026 STR laws. Always verify the latest short term rental regulations and Airbnb license requirements directly with local government authorities for Iida to ensure full compliance before hosting.
(Source: AirROI data, 2026, based on 90% licensed listings)
Top Performing Airbnb Properties in Iida (2026)
Benchmark your potential! Explore examples of top-performing Airbnb properties in Iidabased on Trailing Twelve Month (TTM) revenue. Analyze their characteristics, revenue, occupancy rate, and ADR to understand what drives success in this market.
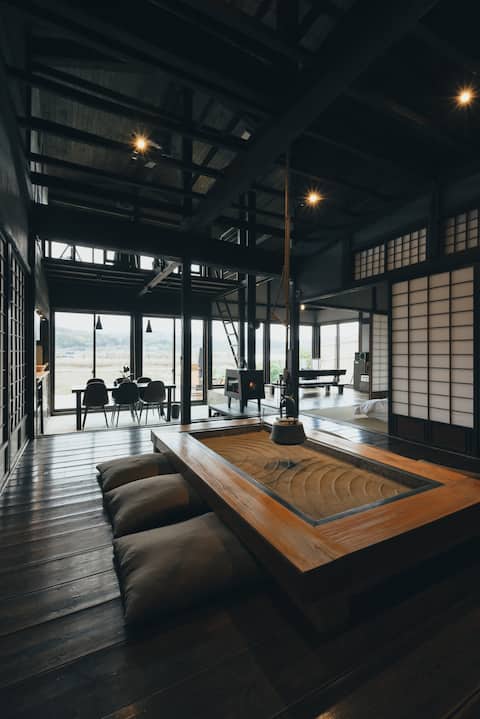
Private rental of a 130-year-old house with a traditional Japanese sunken fireplace, wood stove, and
Entire Place • 3 bedrooms
![[Winter hideaway to enjoy the starry sky] A warm villa stay for groups only, 3-minute walk to the ob](https://a0.muscache.com/im/pictures/miso/Hosting-44177508/original/e942739e-906d-4637-9e9a-23f8397cf154.jpeg?im_w=480&im_format=avif)
[Winter hideaway to enjoy the starry sky] A warm villa stay for groups only, 3-minute walk to the ob
Entire Place • 3 bedrooms
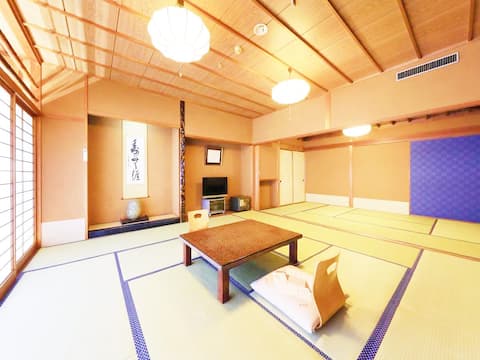
NonSmoking/Special JPN Room/Toilet+Bath/2meals/1~7
Private Room • 2 bedrooms
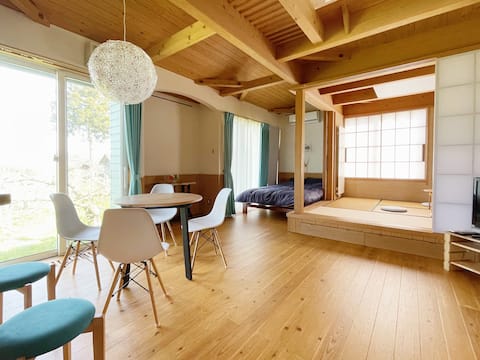
A house in an apple orchard. Stay in a cafe-like atmosphere in a refreshing open living room.
Entire Place • 3 bedrooms
![Experience the hearth and Kamado!1 group limited Ancient Minjuku [Morning, dinner]](https://a0.muscache.com/im/pictures/hosting/Hosting-52777864/original/2bbcc6e5-b345-4ab6-98b7-6148a96080b3.jpeg?im_w=480&im_format=avif)
Experience the hearth and Kamado!1 group limited Ancient Minjuku [Morning, dinner]
Entire Place • 1 bedroom

Perfect for a long stay with friends! 30minto Achi
Entire Place • 2 bedrooms
Note: Performance varies based on location, size, amenities, seasonality, and management quality. Data reflects the past 12 months.
Top Performing Airbnb Hosts in Iida (2026)
Learn from the best! This table showcases top-performing Airbnb hosts in Iida based on the number of properties managed and estimated total revenue over the past year. Analyze their scale and performance metrics.
| Host Name | Properties | Grossing Revenue | Stay Reviews | Avg Rating |
|---|---|---|---|---|
| Ryohei | 1 | $73,520 | 156 | 5.00/5.0 |
| 山梨 | 2 | $64,538 | 282 | 4.95/5.0 |
| 厚 | 2 | $33,391 | 176 | 4.83/5.0 |
| 食と体験の宿まごころ | 2 | $31,905 | 11 | 5.00/5.0 |
| Thomas | 2 | $31,159 | 110 | 4.92/5.0 |
| 天竜峡温泉-秘境のおやど-龍峡亭 | 1 | $26,854 | 4 | 5.00/5.0 |
| Masa | 1 | $15,147 | 26 | 5.00/5.0 |
| Tae | 2 | $13,644 | 372 | 4.94/5.0 |
| たにかぜ | 1 | $13,325 | 6 | 5.00/5.0 |
| Yutaka | 1 | $4,456 | 15 | 4.93/5.0 |
Analyzing the strategies of top hosts, such as their property selection, pricing, and guest communication, can offer valuable lessons for optimizing your own Airbnb operations in Iida.
Dive Deeper: Advanced Iida STR Market Data (2026)
Ready to unlock more insights? AirROI provides access to advanced metrics and comprehensive Airbnb data for Iida. Explore detailed analytics beyond this report to refine your investment strategy, optimize pricing, and maximize your vacation rental profits.
Explore Advanced MetricsIida Short-Term Rental Market Composition (2026): Property & Room Types
Room Type Distribution
Property Type Distribution
Market Composition Insights for Iida
- The Iida Airbnb market composition is heavily skewed towards Private Room listings, which make up 52.4% of the 21 active rentals. This indicates strong guest preference for privacy and space.
- Looking at the property type distribution in Iida, House properties are the most common (42.9%), reflecting the local real estate landscape.
- Houses represent a significant 42.9% portion, catering likely to families or larger groups.
- The presence of 28.6% Hotel/Boutique listings indicates integration with traditional hospitality.
Iida Airbnb Room Capacity Analysis (2026): Bedroom Distribution
Distribution of Listings by Number of Bedrooms
Room Capacity Insights for Iida
- The dominant room capacity in Iida is 1 bedroom listings, making up 28.6% of the market. This suggests a strong demand for properties suitable for couples or solo travelers.
- Together, 1 bedroom and 2 bedrooms properties represent 57.2% of the active Airbnb listings in Iida, indicating a high concentration in these sizes.
- A significant 28.6% of listings offer 3+ bedrooms, catering to larger groups and families seeking more space in Iida.
Iida Vacation Rental Guest Capacity Trends (2026)
Distribution of Listings by Guest Capacity
Guest Capacity Insights for Iida
- The most common guest capacity trend in Iida vacation rentals is listings accommodating 8+ guests (23.8%). This suggests the primary traveler segment is likely larger groups.
- Properties designed for 8+ guests and 5 guests dominate the Iida STR market, accounting for 33.3% of listings.
- 28.6% of properties accommodate 6+ guests, serving the market segment for larger families or group travel in Iida.
- On average, properties in Iida are equipped to host 3.4 guests.
Iida Airbnb Booking Patterns (2026): Available vs. Booked Days
Available Days Distribution
Booked Days Distribution
Booking Pattern Insights for Iida
- The most common availability pattern in Iida falls within the 271-366 days range, representing 52.4% of listings. This suggests many properties have significant open periods on their calendars.
- Approximately 76.2% of listings show high availability (181+ days open annually), indicating potential for increased bookings or specific owner usage patterns.
- For booked days, the 31-90 days range is most frequent in Iida (33.3%), reflecting common guest stay durations or potential owner blocking patterns.
- A notable 23.8% of properties secure long booking periods (181+ days booked per year), highlighting successful long-term rental strategies or significant owner usage.
Iida Airbnb Minimum Stay Requirements Analysis
Distribution of Listings by Minimum Night Requirement
1 Night
19 listings
90.5% of total
30+ Nights
2 listings
9.5% of total
Key Insights
- The most prevalent minimum stay requirement in Iida is 1 Night, adopted by 90.5% of listings. This highlights the market's preference for shorter, flexible bookings.
- A strong majority (90.5%) of the Iida Airbnb data shows acceptance of very short stays (1-2 nights), indicating a dynamic, high-turnover market.
Recommendations
- Align with the market by considering a 1 Night minimum stay, as 90.5% of Iida hosts use this setting.
- Explore offering discounts for stays of 30+ nights to attract the 9.5% of the market seeking extended stays.
- Adjust minimum nights based on seasonality – potentially shorter during low season and longer during peak demand periods in Iida.
Iida Airbnb Cancellation Policy Trends Analysis (2026)
Non-refundable
1 listings
4.8% of total
Refundable
1 listings
4.8% of total
Flexible
5 listings
23.8% of total
Moderate
13 listings
61.9% of total
Firm
1 listings
4.8% of total
Cancellation Policy Insights for Iida
- The prevailing Airbnb cancellation policy trend in Iida is Moderate, used by 61.9% of listings.
- The market strongly favors guest-friendly terms, with 85.7% of listings offering Flexible or Moderate policies. This suggests guests in Iida may expect booking flexibility.
Recommendations for Hosts
- Consider adopting a Moderate policy to align with the 61.9% market standard in Iida.
- Regularly review your cancellation policy against competitors and market demand shifts in Iida.
Iida STR Booking Lead Time Analysis (2026)
Average Booking Lead Time by Month
Booking Lead Time Insights for Iida
- The overall average booking lead time for vacation rentals in Iida is 33 days.
- Guests book furthest in advance for stays during February (average 47 days), likely coinciding with peak travel demand or local events.
- The shortest booking windows occur for stays in June (average 23 days), indicating more last-minute travel plans during this time.
- Seasonally, Fall (42 days avg.) sees the longest lead times, while Summer (27 days avg.) has the shortest, reflecting typical travel planning cycles.
Recommendations for Hosts
- Use the overall average lead time (33 days) as a baseline for your pricing and availability strategy in Iida.
- For February stays, consider implementing length-of-stay discounts or slightly higher rates for bookings made less than 47 days out to capitalize on advance planning.
- Target marketing efforts for the Fall season well in advance (at least 42 days) to capture early planners.
- Monitor your own booking lead times against these Iida averages to identify opportunities for dynamic pricing adjustments.
Popular & Essential Airbnb Amenities in Iida (2026)
Amenity Prevalence
Amenity Insights for Iida
- Essential amenities in Iida that guests expect include: Air conditioning. Lacking these (this) could significantly impact bookings.
- Popular amenities like Free parking on premises, Hair dryer, Fire extinguisher are common but not universal. Offering these can provide a competitive edge.
- Warning: Wifi is not universally provided but is considered essential globally. Ensure reliable Wifi is offered.
Recommendations for Hosts
- Ensure your listing includes all essential amenities for Iida: Air conditioning.
- Consider adding popular differentiators like Free parking on premises or Hair dryer to increase appeal.
- Highlight unique or less common amenities you offer (e.g., hot tub, dedicated workspace, EV charger) in your listing description and photos.
- Regularly check competitor amenities in Iida to stay competitive.
Iida Airbnb Guest Demographics & Profile Analysis (2026)
Guest Profile Summary for Iida
- The typical guest profile for Airbnb in Iida consists of a mix of domestic (45%) and international guests, with top international origins including United States, typically belonging to the Post-2000s (Gen Z/Alpha) group (50%), primarily speaking English or Japanese.
- Domestic travelers account for 44.7% of guests.
- Key international markets include Japan (44.7%) and United States (10.6%).
- Top languages spoken are English (43%) followed by Japanese (26%).
- A significant demographic segment is the Post-2000s (Gen Z/Alpha) group, representing 50% of guests.
Recommendations for Hosts
- Balance marketing efforts between domestic and international channels based on the guest mix.
- Tailor amenities and listing descriptions to appeal to the dominant Post-2000s (Gen Z/Alpha) demographic (e.g., highlight fast WiFi, smart home features, local guides).
- Highlight unique local experiences or amenities relevant to the primary guest profile.
- Consider seasonal promotions aligned with peak travel times for key origin markets.
Nearby Short-Term Rental Market Comparison
How does the Iida Airbnb market stack up against its neighbors? Compare key performance metrics like average monthly revenue, ADR, and occupancy rates in surrounding areas to understand the broader regional STR landscape.
| Market | Active Properties | Monthly Revenue | Daily Rate | Avg. Occupancy |
|---|---|---|---|---|
| Karuizawa | 121 | $3,852 | $396.31 | 39% |
| Miyota | 41 | $3,773 | $284.31 | 43% |
| Shima | 40 | $3,717 | $295.59 | 40% |
| Fujikawaguchiko | 473 | $3,594 | $242.94 | 51% |
| Toba | 12 | $3,477 | $332.20 | 31% |
| Shirakawa | 10 | $3,426 | $241.42 | 63% |
| Oshino | 11 | $3,377 | $274.05 | 37% |
| Yamanakako | 181 | $3,294 | $300.49 | 43% |
| Hakuba | 585 | $3,204 | $430.00 | 36% |
| Kusatsu | 37 | $3,105 | $311.94 | 36% |