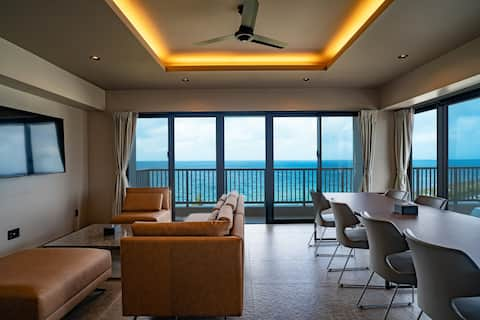
Chatan Airbnb Market Analysis 2026: Short Term Rental Data & Vacation Rental Statistics in Okinawa Prefecture, Japan
Is Airbnb profitable in Chatan in 2026? Explore comprehensive Airbnb analytics for Chatan, Okinawa Prefecture, Japan to uncover income potential. This 2026 STR market report for Chatan, based on AirROI data from February 2025 to January 2026, reveals key trends in the niche market of 162 active listings.
Whether you're considering an Airbnb investment in Chatan, optimizing your existing vacation rental, or exploring rental arbitrage opportunities, understanding the Chatan Airbnb data is crucial. Navigating the high regulation landscape is key to maximizing your short term rental income potential. Let's dive into the specifics.
Key Chatan Airbnb Performance Metrics Overview
Monthly Airbnb Revenue Variations & Income Potential in Chatan (2026)
Understanding the monthly revenue variations for Airbnb listings in Chatan is key to maximizing your short term rental income potential. Seasonality significantly impacts earnings. Our analysis, based on data from the past 12 months, shows that the peak revenue month for STRs in Chatan is typically August, while January often presents the lowest earnings, highlighting opportunities for strategic pricing adjustments during shoulder and low seasons. Explore the typical Airbnb income in Chatan across different performance tiers:
- Best-in-class properties (Top 10%) achieve $6,705+ monthly, often utilizing dynamic pricing and superior guest experiences.
- Strong performing properties (Top 25%) earn $4,858 or more, indicating effective management and desirable locations/amenities.
- Typical properties (Median) generate around $3,072 per month, representing the average market performance.
- Entry-level properties (Bottom 25%) see earnings around $1,656, often with potential for optimization.
Average Monthly Airbnb Earnings Trend in Chatan
Chatan Airbnb Occupancy Rate Trends (2026)
Maximize your bookings by understanding the Chatan STR occupancy trends. Seasonal demand shifts significantly influence how often properties are booked. Typically, Februarysees the highest demand (peak season occupancy), while January experiences the lowest (low season). Effective strategies, like adjusting minimum stays or offering promotions, can boost occupancy during slower periods. Here's how different property tiers perform in Chatan:
- Best-in-class properties (Top 10%) achieve 84%+ occupancy, indicating high desirability and potentially optimized availability.
- Strong performing properties (Top 25%) maintain 74% or higher occupancy, suggesting good market fit and guest satisfaction.
- Typical properties (Median) have an occupancy rate around 55%.
- Entry-level properties (Bottom 25%) average 29% occupancy, potentially facing higher vacancy.
Average Monthly Occupancy Rate Trend in Chatan
Average Daily Rate (ADR) Airbnb Trends in Chatan (2026)
Effective short term rental pricing strategy in Chatan involves understanding monthly ADR fluctuations. The Average Daily Rate (ADR) for Airbnb in Chatan typically peaks in August and dips lowest during January. Leveraging Airbnb dynamic pricing tools or strategies based on this seasonality can significantly boost revenue. Here's a look at the typical nightly rates achieved:
- Best-in-class properties (Top 10%) command rates of $371+ per night, often due to premium features or locations.
- Strong performing properties (Top 25%) achieve nightly rates of $276 or more.
- Typical properties (Median) charge around $203 per night.
- Entry-level properties (Bottom 25%) earn around $141 per night.
Average Daily Rate (ADR) Trend by Month in Chatan
Get Live Chatan Market Intelligence 👇

Explore Real-time Analytics
Airbnb Seasonality Analysis & Trends in Chatan (2026)
Peak Season (August, July, May)
- Revenue averages $4,684 per month
- Occupancy rates average 56.7%
- Daily rates average $261
Shoulder Season
- Revenue averages $3,539 per month
- Occupancy maintains around 53.4%
- Daily rates hold near $226
Low Season (January, November, December)
- Revenue drops to average $2,719 per month
- Occupancy decreases to average 43.5%
- Daily rates adjust to average $196
Seasonality Insights for Chatan
- The Airbnb seasonality in Chatan shows highly seasonal trends requiring careful strategy. While the sections above show seasonal averages, it's also insightful to look at the extremes:
- During the high season, the absolute peak month showcases Chatan's highest earning potential, with monthly revenues capable of climbing to $5,414, occupancy reaching a high of 60.2%, and ADRs peaking at $278.
- Conversely, the slowest single month of the year, typically falling within the low season, marks the market's lowest point. In this month, revenue might dip to $2,334, occupancy could drop to 37.8%, and ADRs may adjust down to $193.
- Understanding both the seasonal averages and these monthly peaks and troughs in revenue, occupancy, and ADR is crucial for maximizing your Airbnb profit potential in Chatan.
Seasonal Strategies for Maximizing Profit
- Peak Season: Maximize revenue through premium pricing and potentially longer minimum stays. Ensure high availability.
- Low Season: Offer competitive pricing, special promotions (e.g., extended stay discounts), and flexible cancellation policies. Target off-season travelers like remote workers or budget-conscious guests.
- Shoulder Seasons: Implement dynamic pricing that balances peak and low rates. Target weekend travelers or specific events. Offer slightly more flexible terms than peak season.
- Regularly analyze your own performance against these Chatan seasonality benchmarks and adjust your pricing and availability strategy accordingly.
Best Areas for Airbnb Investment in Chatan (2026)
Exploring the top neighborhoods for short-term rentals in Chatan? This section highlights key areas, outlining why they are attractive for hosts and guests, along with notable local attractions. Consider these locations based on your target guest profile and investment strategy.
| Neighborhood / Area | Why Host Here? (Target Guests & Appeal) | Key Attractions & Landmarks |
|---|---|---|
| Sunset Beach | Popular for its beautiful sunsets, calm waters, and family-friendly atmosphere. Ideal for beachgoers and those looking for water activities. | Sunset Beach, Chatan Park, American Village, Bargain Shopping Street, Araha Beach |
| American Village | A lively entertainment district that blends American and Okinawan culture, featuring shops, restaurants, and nightlife. Very attractive to tourists looking for unique experiences. | American Village, Sunset Beach, Mihama American Village, Chatan Harbor, Okinawa Prefectural Museum |
| Araha Beach Area | Well-known for its long sandy beach and beachfront activities, making it perfect for tourists wanting leisure time and water sports. | Araha Beach, Chatan Park, Sunset Beach, World of Ice, Military Beach |
| Chatan Town Center | A central hub with a mix of local culture, shopping, and dining. Great for tourists who want to experience local life. | Chatan Town Center, Chatan Harbor, Local markets, Restaurants, Cafes |
| Mihama | A scenic area with a focus on ocean views and seaside dining. Appeals to families and couples looking for romantic getaways. | Mihama American Village, Sunset Beach, Chatan Park, Shopping centers, Cafes |
| Kadena | Close to military bases and offers a unique cross-cultural experience. Attracts military families and international visitors. | Kadena Air Base, Chatan Town attractions, Local eateries, Shopping |
| Moon Beach | Known for its pristine waters and natural beauty, perfect for water sports and relaxation. Ideal for beach lovers. | Moon Beach Resort, Water sports activities, Beachfront dining, Chatan Park |
| Tropical Beach | Features a long stretch of beach and activities for families, making it a favorite among vacationers and tourists. | Tropical Beach, Beachfront facilities, Chatan parks, Water activities, Restaurants |
Understanding Airbnb License Requirements & STR Laws in Chatan (2026)
Yes, Chatan, Okinawa Prefecture, Japan enforces high STR regulations. Obtaining a license and ensuring compliance is almost certainly required according to current 2026 STR laws. Always verify the latest short term rental regulations and Airbnb license requirements directly with local government authorities for Chatan to ensure full compliance before hosting.
(Source: AirROI data, 2026, based on 97% licensed listings)
Top Performing Airbnb Properties in Chatan (2026)
Benchmark your potential! Explore examples of top-performing Airbnb properties in Chatanbased on Trailing Twelve Month (TTM) revenue. Analyze their characteristics, revenue, occupancy rate, and ADR to understand what drives success in this market.
Newly built 277 ㎡ in Kitaya/5-7F private/all rooms ocean view 3LDK/30-second walk to the sea/with lu
Entire Place • 3 bedrooms
![[ReVIERA Resort Villa] 5-minute walk to American Village/Private pool and sauna](https://a0.muscache.com/im/pictures/hosting/Hosting-U3RheVN1cHBseUxpc3Rpbmc6MTE3ODAyNTQ5MDMzMjg4MjQ0Nw==/original/9364eadc-5d8a-4ede-a42b-182b6d9e6b6f.jpeg?im_w=480&im_format=avif)
[ReVIERA Resort Villa] 5-minute walk to American Village/Private pool and sauna
Entire Place • 3 bedrooms

Chatan, can accommodate 20 or more people! Large single unit rental, 5-minute drive to American Vill
Entire Place • 7 bedrooms
TDY/TAD/Discount for long term stay/Pet ok
Entire Place • 4 bedrooms
![El Sol Town Okinawa [3rd floor Asian Suite] 3 bedrooms (220 sqm) 1-6 people](https://a0.muscache.com/im/pictures/miso/Hosting-52476880/original/e1674687-1632-4a2a-8fef-dc5e276f4ddc.jpeg?im_w=480&im_format=avif)
El Sol Town Okinawa [3rd floor Asian Suite] 3 bedrooms (220 sqm) 1-6 people
Private Room • 3 bedrooms

New open★American Village★サンセットビーチ★4ROOMS★TLA&TDY
Entire Place • 4 bedrooms
Note: Performance varies based on location, size, amenities, seasonality, and management quality. Data reflects the past 12 months.
Top Performing Airbnb Hosts in Chatan (2026)
Learn from the best! This table showcases top-performing Airbnb hosts in Chatan based on the number of properties managed and estimated total revenue over the past year. Analyze their scale and performance metrics.
| Host Name | Properties | Grossing Revenue | Stay Reviews | Avg Rating |
|---|---|---|---|---|
| Gostay | 6 | $403,575 | 419 | 4.88/5.0 |
| OKinawa | 5 | $325,218 | 1579 | 4.86/5.0 |
| 和代 | 7 | $309,871 | 297 | 4.85/5.0 |
| Upi | 11 | $294,163 | 461 | 4.87/5.0 |
| Go Stay | 6 | $266,086 | 340 | 4.72/5.0 |
| ユナイテッドリゾートレセプション | 1 | $242,417 | 39 | 4.95/5.0 |
| Arapana | 5 | $223,927 | 76 | 4.41/5.0 |
| コルディオプレミアム | 4 | $200,775 | 211 | 4.75/5.0 |
| Blue Steak Wonder | 6 | $199,384 | 333 | 4.89/5.0 |
| ELSOL TOWN Okinawa | 4 | $181,131 | 81 | 4.84/5.0 |
Analyzing the strategies of top hosts, such as their property selection, pricing, and guest communication, can offer valuable lessons for optimizing your own Airbnb operations in Chatan.
Dive Deeper: Advanced Chatan STR Market Data (2026)
Ready to unlock more insights? AirROI provides access to advanced metrics and comprehensive Airbnb data for Chatan. Explore detailed analytics beyond this report to refine your investment strategy, optimize pricing, and maximize your vacation rental profits.
Explore Advanced MetricsChatan Short-Term Rental Market Composition (2026): Property & Room Types
Room Type Distribution
Property Type Distribution
Market Composition Insights for Chatan
- The Chatan Airbnb market composition is heavily skewed towards Entire Home/Apt listings, which make up 76.5% of the 162 active rentals. This indicates strong guest preference for privacy and space.
- Looking at the property type distribution in Chatan, Apartment/Condo properties are the most common (56.8%), reflecting the local real estate landscape.
- Houses represent a significant 31.5% portion, catering likely to families or larger groups.
- The presence of 11.1% Hotel/Boutique listings indicates integration with traditional hospitality.
- Smaller segments like unique stays (combined 0.6%) offer potential for unique stay experiences.
Chatan Airbnb Room Capacity Analysis (2026): Bedroom Distribution
Distribution of Listings by Number of Bedrooms
Room Capacity Insights for Chatan
- The dominant room capacity in Chatan is 2 bedrooms listings, making up 29.6% of the market. This suggests a strong demand for properties suitable for couples or solo travelers.
- Together, 2 bedrooms and 1 bedroom properties represent 58.6% of the active Airbnb listings in Chatan, indicating a high concentration in these sizes.
- A significant 35.8% of listings offer 3+ bedrooms, catering to larger groups and families seeking more space in Chatan.
Chatan Vacation Rental Guest Capacity Trends (2026)
Distribution of Listings by Guest Capacity
Guest Capacity Insights for Chatan
- The most common guest capacity trend in Chatan vacation rentals is listings accommodating 8+ guests (43.2%). This suggests the primary traveler segment is likely larger groups.
- Properties designed for 8+ guests and 4 guests dominate the Chatan STR market, accounting for 56.8% of listings.
- 62.3% of properties accommodate 6+ guests, serving the market segment for larger families or group travel in Chatan.
- On average, properties in Chatan are equipped to host 5.8 guests.
Chatan Airbnb Booking Patterns (2026): Available vs. Booked Days
Available Days Distribution
Booked Days Distribution
Booking Pattern Insights for Chatan
- The most common availability pattern in Chatan falls within the 91-180 days range, representing 35.2% of listings. This suggests many properties have significant open periods on their calendars.
- Approximately 54.9% of listings show high availability (181+ days open annually), indicating potential for increased bookings or specific owner usage patterns.
- For booked days, the 181-270 days range is most frequent in Chatan (33.3%), reflecting common guest stay durations or potential owner blocking patterns.
- A notable 46.3% of properties secure long booking periods (181+ days booked per year), highlighting successful long-term rental strategies or significant owner usage.
Chatan Airbnb Minimum Stay Requirements Analysis
Distribution of Listings by Minimum Night Requirement
1 Night
126 listings
77.8% of total
2 Nights
11 listings
6.8% of total
3 Nights
2 listings
1.2% of total
4-6 Nights
2 listings
1.2% of total
7-29 Nights
1 listings
0.6% of total
30+ Nights
20 listings
12.3% of total
Key Insights
- The most prevalent minimum stay requirement in Chatan is 1 Night, adopted by 77.8% of listings. This highlights the market's preference for shorter, flexible bookings.
- A strong majority (84.6%) of the Chatan Airbnb data shows acceptance of very short stays (1-2 nights), indicating a dynamic, high-turnover market.
- A significant segment (12.3%) caters to monthly stays (30+ nights) in Chatan, pointing to opportunities in the extended-stay market.
Recommendations
- Align with the market by considering a 1 Night minimum stay, as 77.8% of Chatan hosts use this setting.
- Explore offering discounts for stays of 30+ nights to attract the 12.3% of the market seeking extended stays.
- Adjust minimum nights based on seasonality – potentially shorter during low season and longer during peak demand periods in Chatan.
Chatan Airbnb Cancellation Policy Trends Analysis (2026)
Super Strict 30 Days
2 listings
1.2% of total
Limited
6 listings
3.7% of total
Non-refundable
2 listings
1.2% of total
Flexible
9 listings
5.6% of total
Moderate
43 listings
26.5% of total
Firm
64 listings
39.5% of total
Strict
36 listings
22.2% of total
Cancellation Policy Insights for Chatan
- The prevailing Airbnb cancellation policy trend in Chatan is Firm, used by 39.5% of listings.
- A majority (61.7%) of hosts in Chatan utilize Firm or Strict policies, indicating a market where hosts prioritize booking security.
Recommendations for Hosts
- Consider adopting a Firm policy to align with the 39.5% market standard in Chatan.
- Regularly review your cancellation policy against competitors and market demand shifts in Chatan.
Chatan STR Booking Lead Time Analysis (2026)
Average Booking Lead Time by Month
Booking Lead Time Insights for Chatan
- The overall average booking lead time for vacation rentals in Chatan is 45 days.
- Guests book furthest in advance for stays during October (average 56 days), likely coinciding with peak travel demand or local events.
- The shortest booking windows occur for stays in January (average 37 days), indicating more last-minute travel plans during this time.
- Seasonally, Fall (49 days avg.) sees the longest lead times, while Spring (41 days avg.) has the shortest, reflecting typical travel planning cycles.
Recommendations for Hosts
- Use the overall average lead time (45 days) as a baseline for your pricing and availability strategy in Chatan.
- For October stays, consider implementing length-of-stay discounts or slightly higher rates for bookings made less than 56 days out to capitalize on advance planning.
- Target marketing efforts for the Fall season well in advance (at least 49 days) to capture early planners.
- Monitor your own booking lead times against these Chatan averages to identify opportunities for dynamic pricing adjustments.
Popular & Essential Airbnb Amenities in Chatan (2026)
Amenity Prevalence
Amenity Insights for Chatan
- Essential amenities in Chatan that guests expect include: Wifi, Air conditioning, Shampoo, Hair dryer, TV, Smoke alarm. Lacking these (any) could significantly impact bookings.
- Popular amenities like Kitchen, Washer, Fire extinguisher are common but not universal. Offering these can provide a competitive edge.
Recommendations for Hosts
- Ensure your listing includes all essential amenities for Chatan: Wifi, Air conditioning, Shampoo, Hair dryer, TV, Smoke alarm.
- Prioritize adding missing essentials: Shampoo, Hair dryer, TV, Smoke alarm.
- Consider adding popular differentiators like Kitchen or Washer to increase appeal.
- Highlight unique or less common amenities you offer (e.g., hot tub, dedicated workspace, EV charger) in your listing description and photos.
- Regularly check competitor amenities in Chatan to stay competitive.
Chatan Airbnb Guest Demographics & Profile Analysis (2026)
Guest Profile Summary for Chatan
- The typical guest profile for Airbnb in Chatan consists of predominantly international visitors (85%), with top international origins including Japan, typically belonging to the Post-2000s (Gen Z/Alpha) group (50%), primarily speaking English or Chinese.
- Domestic travelers account for 15.1% of guests.
- Key international markets include United States (32.1%) and Japan (15.1%).
- Top languages spoken are English (47.4%) followed by Chinese (14.8%).
- A significant demographic segment is the Post-2000s (Gen Z/Alpha) group, representing 50% of guests.
Recommendations for Hosts
- Focus marketing internationally, particularly towards travelers from Japan.
- Tailor amenities and listing descriptions to appeal to the dominant Post-2000s (Gen Z/Alpha) demographic (e.g., highlight fast WiFi, smart home features, local guides).
- Highlight unique local experiences or amenities relevant to the primary guest profile.
- Consider seasonal promotions aligned with peak travel times for key origin markets.
Nearby Short-Term Rental Market Comparison
How does the Chatan Airbnb market stack up against its neighbors? Compare key performance metrics like average monthly revenue, ADR, and occupancy rates in surrounding areas to understand the broader regional STR landscape.
| Market | Active Properties | Monthly Revenue | Daily Rate | Avg. Occupancy |
|---|---|---|---|---|
| Ginowan | 42 | $3,567 | $199.75 | 60% |
| Onna | 410 | $3,254 | $244.98 | 50% |
| Urasoe | 25 | $3,064 | $202.53 | 48% |
| Ginoza | 12 | $2,887 | $283.90 | 36% |
| Kin | 63 | $2,847 | $181.24 | 53% |
| Nanjo | 101 | $2,819 | $206.31 | 51% |
| Nakijin | 146 | $2,680 | $225.55 | 44% |
| Nago | 204 | $2,626 | $229.82 | 44% |
| Yomitan | 162 | $2,408 | $162.94 | 51% |
| Tomigusuku | 19 | $2,366 | $148.25 | 55% |