Yonabaru Airbnb Market Analysis 2026: Short Term Rental Data & Vacation Rental Statistics in Okinawa Prefecture, Japan
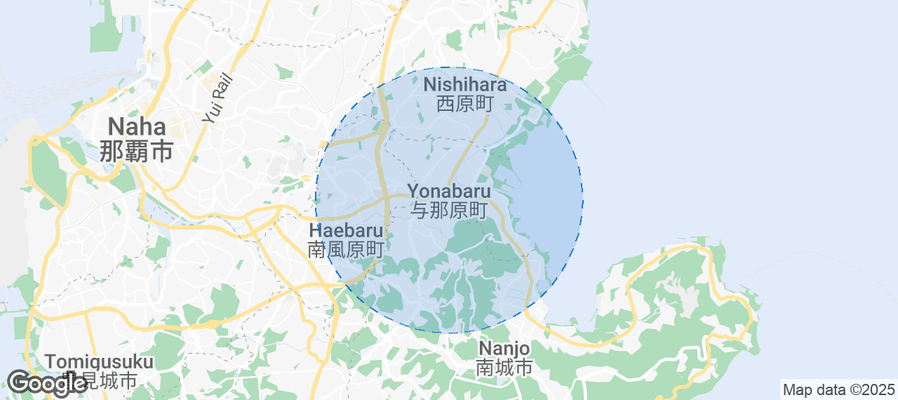
Is Airbnb profitable in Yonabaru in 2026? Explore comprehensive Airbnb analytics for Yonabaru, Okinawa Prefecture, Japan to uncover income potential. This 2026 STR market report for Yonabaru, based on AirROI data from February 2025 to January 2026, reveals key trends in the niche market of 21 active listings.
Whether you're considering an Airbnb investment in Yonabaru, optimizing your existing vacation rental, or exploring rental arbitrage opportunities, understanding the Yonabaru Airbnb data is crucial. Navigating the high regulation landscape is key to maximizing your short term rental income potential. Let's dive into the specifics.
Key Yonabaru Airbnb Performance Metrics Overview
Monthly Airbnb Revenue Variations & Income Potential in Yonabaru (2026)
Understanding the monthly revenue variations for Airbnb listings in Yonabaru is key to maximizing your short term rental income potential. Seasonality significantly impacts earnings. Our analysis, based on data from the past 12 months, shows that the peak revenue month for STRs in Yonabaru is typically August, while April often presents the lowest earnings, highlighting opportunities for strategic pricing adjustments during shoulder and low seasons. Explore the typical Airbnb income in Yonabaru across different performance tiers:
- Best-in-class properties (Top 10%) achieve $2,644+ monthly, often utilizing dynamic pricing and superior guest experiences.
- Strong performing properties (Top 25%) earn $1,654 or more, indicating effective management and desirable locations/amenities.
- Typical properties (Median) generate around $824 per month, representing the average market performance.
- Entry-level properties (Bottom 25%) see earnings around $313, often with potential for optimization.
Average Monthly Airbnb Earnings Trend in Yonabaru
Yonabaru Airbnb Occupancy Rate Trends (2026)
Maximize your bookings by understanding the Yonabaru STR occupancy trends. Seasonal demand shifts significantly influence how often properties are booked. Typically, Februarysees the highest demand (peak season occupancy), while June experiences the lowest (low season). Effective strategies, like adjusting minimum stays or offering promotions, can boost occupancy during slower periods. Here's how different property tiers perform in Yonabaru:
- Best-in-class properties (Top 10%) achieve 67%+ occupancy, indicating high desirability and potentially optimized availability.
- Strong performing properties (Top 25%) maintain 45% or higher occupancy, suggesting good market fit and guest satisfaction.
- Typical properties (Median) have an occupancy rate around 27%.
- Entry-level properties (Bottom 25%) average 15% occupancy, potentially facing higher vacancy.
Average Monthly Occupancy Rate Trend in Yonabaru
Average Daily Rate (ADR) Airbnb Trends in Yonabaru (2026)
Effective short term rental pricing strategy in Yonabaru involves understanding monthly ADR fluctuations. The Average Daily Rate (ADR) for Airbnb in Yonabaru typically peaks in August and dips lowest during March. Leveraging Airbnb dynamic pricing tools or strategies based on this seasonality can significantly boost revenue. Here's a look at the typical nightly rates achieved:
- Best-in-class properties (Top 10%) command rates of $148+ per night, often due to premium features or locations.
- Strong performing properties (Top 25%) achieve nightly rates of $126 or more.
- Typical properties (Median) charge around $99 per night.
- Entry-level properties (Bottom 25%) earn around $39 per night.
Average Daily Rate (ADR) Trend by Month in Yonabaru
Get Live Yonabaru Market Intelligence 👇
Explore Real-time Analytics
Airbnb Seasonality Analysis & Trends in Yonabaru (2026)
Peak Season (August, November, September)
- Revenue averages $1,439 per month
- Occupancy rates average 36.2%
- Daily rates average $102
Shoulder Season
- Revenue averages $1,106 per month
- Occupancy maintains around 35.1%
- Daily rates hold near $96
Low Season (April, May, June)
- Revenue drops to average $834 per month
- Occupancy decreases to average 24.0%
- Daily rates adjust to average $93
Seasonality Insights for Yonabaru
- The Airbnb seasonality in Yonabaru shows moderate seasonality with distinct peak and low periods. While the sections above show seasonal averages, it's also insightful to look at the extremes:
- During the high season, the absolute peak month showcases Yonabaru's highest earning potential, with monthly revenues capable of climbing to $1,518, occupancy reaching a high of 46.9%, and ADRs peaking at $110.
- Conversely, the slowest single month of the year, typically falling within the low season, marks the market's lowest point. In this month, revenue might dip to $772, occupancy could drop to 21.8%, and ADRs may adjust down to $86.
- Understanding both the seasonal averages and these monthly peaks and troughs in revenue, occupancy, and ADR is crucial for maximizing your Airbnb profit potential in Yonabaru.
Seasonal Strategies for Maximizing Profit
- Peak Season: Maximize revenue through premium pricing and potentially longer minimum stays. Ensure high availability.
- Low Season: Offer competitive pricing, special promotions (e.g., extended stay discounts), and flexible cancellation policies. Target off-season travelers like remote workers or budget-conscious guests.
- Shoulder Seasons: Implement dynamic pricing that balances peak and low rates. Target weekend travelers or specific events. Offer slightly more flexible terms than peak season.
- Regularly analyze your own performance against these Yonabaru seasonality benchmarks and adjust your pricing and availability strategy accordingly.
Best Areas for Airbnb Investment in Yonabaru (2026)
Exploring the top neighborhoods for short-term rentals in Yonabaru? This section highlights key areas, outlining why they are attractive for hosts and guests, along with notable local attractions. Consider these locations based on your target guest profile and investment strategy.
| Neighborhood / Area | Why Host Here? (Target Guests & Appeal) | Key Attractions & Landmarks |
|---|---|---|
| Yonabaru Town Center | The heart of Yonabaru, offering local shops and restaurants. This area is attractive for travelers wanting to experience local culture and cuisine. | Yonabaru Market, Yonabaru Town Hall, Shurijo Castle nearby, local eateries |
| Kadena Air Base vicinity | Near the Kadena Air Base, this area is popular with American military personnel and their families, making it a lucrative spot for short-term rentals. | Kadena Air Base, American Village, Kadena Marina |
| Okinawa World | A popular theme park and cultural experience showing traditional Okinawan culture. Offers unique attractions that can draw in tourists looking for local experiences. | Gyokusendo Cave, Okinawa Prefectural Museum, traditional craft workshops |
| Naha Airport area | Proximity to the airport makes this area ideal for travelers looking for convenient lodging before or after flights. | Naha Airport, Okinawa Outlet Mall, entertainment areas in Naha |
| Urasoe City | Just north of Yonabaru, Urasoe has various attractions and more urban amenities, making it appealing for guests looking for city experiences. | Urasoe Yodore Hall, Tamaudun Mausoleum, Urasoe Castle |
| Chatan Town | Known for beaches and a vibrant night scene, Chatan is a hit with tourists who enjoy water sports and entertainment. | American Village, Sunset Beach, Chatan Double Market |
| Itoman | Renowned for its historical significance and coastal views, attracting visitors interested in culture and nature. | Itoman Peace Memorial Park, Okinawa and itoman craft markets, beautiful beaches |
| Cape Kyan | Offers stunning ocean views and seaside attractions, ideal for tourists seeking relaxation and nature experiences. | Cape Kyan Beach, coral reefs, marine activities |
Understanding Airbnb License Requirements & STR Laws in Yonabaru (2026)
Yes, Yonabaru, Okinawa Prefecture, Japan enforces high STR regulations. Obtaining a license and ensuring compliance is almost certainly required according to current 2026 STR laws. Always verify the latest short term rental regulations and Airbnb license requirements directly with local government authorities for Yonabaru to ensure full compliance before hosting.
(Source: AirROI data, 2026, based on 95% licensed listings)
Top Performing Airbnb Properties in Yonabaru (2026)
Benchmark your potential! Explore examples of top-performing Airbnb properties in Yonabarubased on Trailing Twelve Month (TTM) revenue. Analyze their characteristics, revenue, occupancy rate, and ADR to understand what drives success in this market.
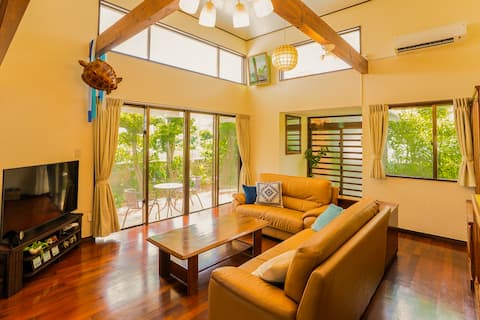
Maximum 8 guests! | A rental house surrounded by the wind and heart of Okinawa | Peace Branch
Entire Place • 2 bedrooms
![[Nu-chigusui-no-Yado] \ Limited to one group per day \ Ideal for sightseeing in southern Okinawa | 4](https://a0.muscache.com/im/pictures/hosting/Hosting-1082282382171272714/original/6d89c33e-ce51-4d0b-a9e2-c97f87d6c5c6.jpeg?im_w=480&im_format=avif)
[Nu-chigusui-no-Yado] \ Limited to one group per day \ Ideal for sightseeing in southern Okinawa | 4
Entire Place • 2 bedrooms

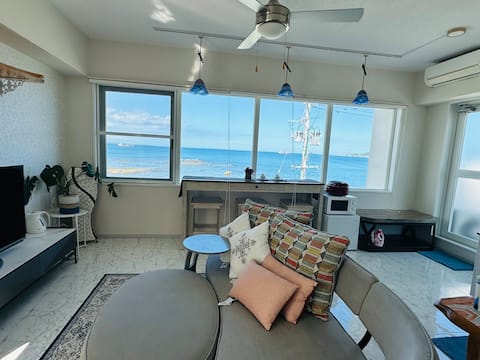
High floor with ocean view! Group stay welcome!
Entire Place • 3 bedrooms
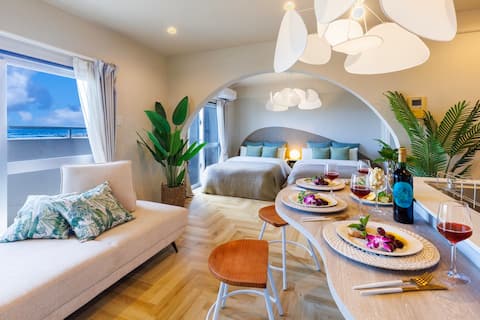
New!Coral House Luminous Shell>
Entire Place • 2 bedrooms
High floor with ocean view! Group stay welcome!
Entire Place • 2 bedrooms
Okinawa One Pair, Entire Rental Cottage (Pets Allowed)
Entire Place • 3 bedrooms
Note: Performance varies based on location, size, amenities, seasonality, and management quality. Data reflects the past 12 months.
Top Performing Airbnb Hosts in Yonabaru (2026)
Learn from the best! This table showcases top-performing Airbnb hosts in Yonabaru based on the number of properties managed and estimated total revenue over the past year. Analyze their scale and performance metrics.
| Host Name | Properties | Grossing Revenue | Stay Reviews | Avg Rating |
|---|---|---|---|---|
| Maho | 5 | $56,531 | 135 | 4.76/5.0 |
| Ryukyutower Yonabaru Marina | 5 | $55,215 | 62 | 4.73/5.0 |
| 和枝 | 1 | $27,826 | 36 | 4.86/5.0 |
| 松田めぐみ | 1 | $26,227 | 14 | 4.86/5.0 |
| 直 | 1 | $15,382 | 12 | 5.00/5.0 |
| ムーネー | 4 | $6,981 | 51 | 4.72/5.0 |
| Yuta | 3 | $3,284 | 114 | 4.70/5.0 |
| Ken | 1 | $633 | 6 | 4.67/5.0 |
Analyzing the strategies of top hosts, such as their property selection, pricing, and guest communication, can offer valuable lessons for optimizing your own Airbnb operations in Yonabaru.
Dive Deeper: Advanced Yonabaru STR Market Data (2026)
Ready to unlock more insights? AirROI provides access to advanced metrics and comprehensive Airbnb data for Yonabaru. Explore detailed analytics beyond this report to refine your investment strategy, optimize pricing, and maximize your vacation rental profits.
Explore Advanced MetricsYonabaru Short-Term Rental Market Composition (2026): Property & Room Types
Room Type Distribution
Property Type Distribution
Market Composition Insights for Yonabaru
- The Yonabaru Airbnb market composition is heavily skewed towards Entire Home/Apt listings, which make up 66.7% of the 21 active rentals. This indicates strong guest preference for privacy and space.
- However, a notable 23.8% share for Private Rooms suggests opportunities for budget-conscious travelers or hosts renting out spare rooms.
- Looking at the property type distribution in Yonabaru, Apartment/Condo properties are the most common (47.6%), reflecting the local real estate landscape.
- Houses represent a significant 47.6% portion, catering likely to families or larger groups.
- Smaller segments like hotel/boutique (combined 4.8%) offer potential for unique stay experiences.
Yonabaru Airbnb Room Capacity Analysis (2026): Bedroom Distribution
Distribution of Listings by Number of Bedrooms
Room Capacity Insights for Yonabaru
- The dominant room capacity in Yonabaru is 2 bedrooms listings, making up 42.9% of the market. This suggests a strong demand for properties suitable for couples or solo travelers.
- Together, 2 bedrooms and 1 bedroom properties represent 57.2% of the active Airbnb listings in Yonabaru, indicating a high concentration in these sizes.
- Listings with 3+ bedrooms (9.5%) represent a smaller niche, potentially indicating an underserved market for larger group accommodations in Yonabaru.
Yonabaru Vacation Rental Guest Capacity Trends (2026)
Distribution of Listings by Guest Capacity
Guest Capacity Insights for Yonabaru
- The most common guest capacity trend in Yonabaru vacation rentals is listings accommodating 4 guests (28.6%). This suggests the primary traveler segment is likely small families or groups.
- Properties designed for 4 guests and 8+ guests dominate the Yonabaru STR market, accounting for 42.9% of listings.
- 23.9% of properties accommodate 6+ guests, serving the market segment for larger families or group travel in Yonabaru.
- On average, properties in Yonabaru are equipped to host 3.2 guests.
Yonabaru Airbnb Booking Patterns (2026): Available vs. Booked Days
Available Days Distribution
Booked Days Distribution
Booking Pattern Insights for Yonabaru
- The most common availability pattern in Yonabaru falls within the 271-366 days range, representing 61.9% of listings. This suggests many properties have significant open periods on their calendars.
- Approximately 90.5% of listings show high availability (181+ days open annually), indicating potential for increased bookings or specific owner usage patterns.
- For booked days, the 31-90 days range is most frequent in Yonabaru (42.9%), reflecting common guest stay durations or potential owner blocking patterns.
- A notable 9.5% of properties secure long booking periods (181+ days booked per year), highlighting successful long-term rental strategies or significant owner usage.
Yonabaru Airbnb Minimum Stay Requirements Analysis
Distribution of Listings by Minimum Night Requirement
1 Night
21 listings
100% of total
Key Insights
- The most prevalent minimum stay requirement in Yonabaru is 1 Night, adopted by 100% of listings. This highlights the market's preference for shorter, flexible bookings.
- A strong majority (100.0%) of the Yonabaru Airbnb data shows acceptance of very short stays (1-2 nights), indicating a dynamic, high-turnover market.
Recommendations
- Align with the market by considering a 1 Night minimum stay, as 100% of Yonabaru hosts use this setting.
- Adjust minimum nights based on seasonality – potentially shorter during low season and longer during peak demand periods in Yonabaru.
Yonabaru Airbnb Cancellation Policy Trends Analysis (2026)
Flexible
7 listings
33.3% of total
Moderate
8 listings
38.1% of total
Firm
6 listings
28.6% of total
Cancellation Policy Insights for Yonabaru
- The prevailing Airbnb cancellation policy trend in Yonabaru is Moderate, used by 38.1% of listings.
- The market strongly favors guest-friendly terms, with 71.4% of listings offering Flexible or Moderate policies. This suggests guests in Yonabaru may expect booking flexibility.
Recommendations for Hosts
- Consider adopting a Moderate policy to align with the 38.1% market standard in Yonabaru.
- Regularly review your cancellation policy against competitors and market demand shifts in Yonabaru.
Yonabaru STR Booking Lead Time Analysis (2026)
Average Booking Lead Time by Month
Booking Lead Time Insights for Yonabaru
- The overall average booking lead time for vacation rentals in Yonabaru is 30 days.
- Guests book furthest in advance for stays during September (average 44 days), likely coinciding with peak travel demand or local events.
- The shortest booking windows occur for stays in June (average 12 days), indicating more last-minute travel plans during this time.
- Seasonally, Fall (29 days avg.) sees the longest lead times, while Spring (23 days avg.) has the shortest, reflecting typical travel planning cycles.
Recommendations for Hosts
- Use the overall average lead time (30 days) as a baseline for your pricing and availability strategy in Yonabaru.
- For September stays, consider implementing length-of-stay discounts or slightly higher rates for bookings made less than 44 days out to capitalize on advance planning.
- During June, focus on last-minute booking availability and promotions, as guests book with very short notice (12 days avg.).
- Target marketing efforts for the Fall season well in advance (at least 29 days) to capture early planners.
- Monitor your own booking lead times against these Yonabaru averages to identify opportunities for dynamic pricing adjustments.
Popular & Essential Airbnb Amenities in Yonabaru (2026)
Amenity Prevalence
Amenity Insights for Yonabaru
- Essential amenities in Yonabaru that guests expect include: Air conditioning, Smoke alarm, Wifi, Fire extinguisher. Lacking these (any) could significantly impact bookings.
- Popular amenities like Heating, Hair dryer, Shampoo are common but not universal. Offering these can provide a competitive edge.
Recommendations for Hosts
- Ensure your listing includes all essential amenities for Yonabaru: Air conditioning, Smoke alarm, Wifi, Fire extinguisher.
- Prioritize adding missing essentials: Fire extinguisher.
- Consider adding popular differentiators like Heating or Hair dryer to increase appeal.
- Highlight unique or less common amenities you offer (e.g., hot tub, dedicated workspace, EV charger) in your listing description and photos.
- Regularly check competitor amenities in Yonabaru to stay competitive.
Yonabaru Airbnb Guest Demographics & Profile Analysis (2026)
Guest Profile Summary for Yonabaru
- The typical guest profile for Airbnb in Yonabaru consists of predominantly international visitors (79%), with top international origins including Hong Kong, typically belonging to the Post-2000s (Gen Z/Alpha) group (50%), primarily speaking English or Chinese.
- Domestic travelers account for 21.1% of guests.
- Key international markets include Japan (21.1%) and Hong Kong (13.2%).
- Top languages spoken are English (41.6%) followed by Chinese (18%).
- A significant demographic segment is the Post-2000s (Gen Z/Alpha) group, representing 50% of guests.
Recommendations for Hosts
- Focus marketing internationally, particularly towards travelers from Hong Kong.
- Tailor amenities and listing descriptions to appeal to the dominant Post-2000s (Gen Z/Alpha) demographic (e.g., highlight fast WiFi, smart home features, local guides).
- Highlight unique local experiences or amenities relevant to the primary guest profile.
- Consider seasonal promotions aligned with peak travel times for key origin markets.
Nearby Short-Term Rental Market Comparison
How does the Yonabaru Airbnb market stack up against its neighbors? Compare key performance metrics like average monthly revenue, ADR, and occupancy rates in surrounding areas to understand the broader regional STR landscape.
| Market | Active Properties | Monthly Revenue | Daily Rate | Avg. Occupancy |
|---|---|---|---|---|
| Ginowan | 42 | $3,567 | $199.75 | 60% |
| Onna | 410 | $3,254 | $244.98 | 50% |
| Urasoe | 25 | $3,064 | $202.53 | 48% |
| Chatan | 162 | $3,037 | $226.73 | 49% |
| Ginoza | 12 | $2,887 | $283.90 | 36% |
| Kin | 63 | $2,847 | $181.24 | 53% |
| Nanjo | 101 | $2,819 | $206.31 | 51% |
| Nakijin | 146 | $2,680 | $225.55 | 44% |
| Nago | 204 | $2,626 | $229.82 | 44% |
| Yomitan | 162 | $2,408 | $162.94 | 51% |