Kita Ward Airbnb Market Analysis 2026: Short Term Rental Data & Vacation Rental Statistics in Osaka, Japan
Is Airbnb profitable in Kita Ward in 2026? Explore comprehensive Airbnb analytics for Kita Ward, Osaka, Japan to uncover income potential. This 2026 STR market report for Kita Ward, based on AirROI data from February 2025 to January 2026, reveals key trends in the niche market of 29 active listings.
Whether you're considering an Airbnb investment in Kita Ward, optimizing your existing vacation rental, or exploring rental arbitrage opportunities, understanding the Kita Ward Airbnb data is crucial. Navigating the high regulation landscape is key to maximizing your short term rental income potential. Let's dive into the specifics.
Key Kita Ward Airbnb Performance Metrics Overview
Monthly Airbnb Revenue Variations & Income Potential in Kita Ward (2026)
Understanding the monthly revenue variations for Airbnb listings in Kita Ward is key to maximizing your short term rental income potential. Seasonality significantly impacts earnings. Our analysis, based on data from the past 12 months, shows that the peak revenue month for STRs in Kita Ward is typically June, while May often presents the lowest earnings, highlighting opportunities for strategic pricing adjustments during shoulder and low seasons. Explore the typical Airbnb income in Kita Ward across different performance tiers:
- Best-in-class properties (Top 10%) achieve $3,151+ monthly, often utilizing dynamic pricing and superior guest experiences.
- Strong performing properties (Top 25%) earn $2,260 or more, indicating effective management and desirable locations/amenities.
- Typical properties (Median) generate around $1,701 per month, representing the average market performance.
- Entry-level properties (Bottom 25%) see earnings around $1,200, often with potential for optimization.
Average Monthly Airbnb Earnings Trend in Kita Ward
Kita Ward Airbnb Occupancy Rate Trends (2026)
Maximize your bookings by understanding the Kita Ward STR occupancy trends. Seasonal demand shifts significantly influence how often properties are booked. Typically, Junesees the highest demand (peak season occupancy), while May experiences the lowest (low season). Effective strategies, like adjusting minimum stays or offering promotions, can boost occupancy during slower periods. Here's how different property tiers perform in Kita Ward:
- Best-in-class properties (Top 10%) achieve 81%+ occupancy, indicating high desirability and potentially optimized availability.
- Strong performing properties (Top 25%) maintain 72% or higher occupancy, suggesting good market fit and guest satisfaction.
- Typical properties (Median) have an occupancy rate around 59%.
- Entry-level properties (Bottom 25%) average 39% occupancy, potentially facing higher vacancy.
Average Monthly Occupancy Rate Trend in Kita Ward
Average Daily Rate (ADR) Airbnb Trends in Kita Ward (2026)
Effective short term rental pricing strategy in Kita Ward involves understanding monthly ADR fluctuations. The Average Daily Rate (ADR) for Airbnb in Kita Ward typically peaks in October and dips lowest during July. Leveraging Airbnb dynamic pricing tools or strategies based on this seasonality can significantly boost revenue. Here's a look at the typical nightly rates achieved:
- Best-in-class properties (Top 10%) command rates of $169+ per night, often due to premium features or locations.
- Strong performing properties (Top 25%) achieve nightly rates of $135 or more.
- Typical properties (Median) charge around $99 per night.
- Entry-level properties (Bottom 25%) earn around $83 per night.
Average Daily Rate (ADR) Trend by Month in Kita Ward
Get Live Kita Ward Market Intelligence 👇
Explore Real-time Analytics
Airbnb Seasonality Analysis & Trends in Kita Ward (2026)
Peak Season (June, October, November)
- Revenue averages $2,371 per month
- Occupancy rates average 67.2%
- Daily rates average $117
Shoulder Season
- Revenue averages $1,612 per month
- Occupancy maintains around 48.3%
- Daily rates hold near $109
Low Season (February, March, April)
- Revenue drops to average $0 per month
- Occupancy decreases to average 0.0%
- Daily rates adjust to average $109
Seasonality Insights for Kita Ward
- The Airbnb seasonality in Kita Ward shows highly seasonal trends requiring careful strategy. While the sections above show seasonal averages, it's also insightful to look at the extremes:
- During the high season, the absolute peak month showcases Kita Ward's highest earning potential, with monthly revenues capable of climbing to $2,403, occupancy reaching a high of 73.0%, and ADRs peaking at $125.
- Conversely, the slowest single month of the year, typically falling within the low season, marks the market's lowest point. In this month, revenue might dip to $0, occupancy could drop to 0.0%, and ADRs may adjust down to $97.
- Understanding both the seasonal averages and these monthly peaks and troughs in revenue, occupancy, and ADR is crucial for maximizing your Airbnb profit potential in Kita Ward.
Seasonal Strategies for Maximizing Profit
- Peak Season: Maximize revenue through premium pricing and potentially longer minimum stays. Ensure high availability.
- Low Season: Offer competitive pricing, special promotions (e.g., extended stay discounts), and flexible cancellation policies. Target off-season travelers like remote workers or budget-conscious guests.
- Shoulder Seasons: Implement dynamic pricing that balances peak and low rates. Target weekend travelers or specific events. Offer slightly more flexible terms than peak season.
- Regularly analyze your own performance against these Kita Ward seasonality benchmarks and adjust your pricing and availability strategy accordingly.
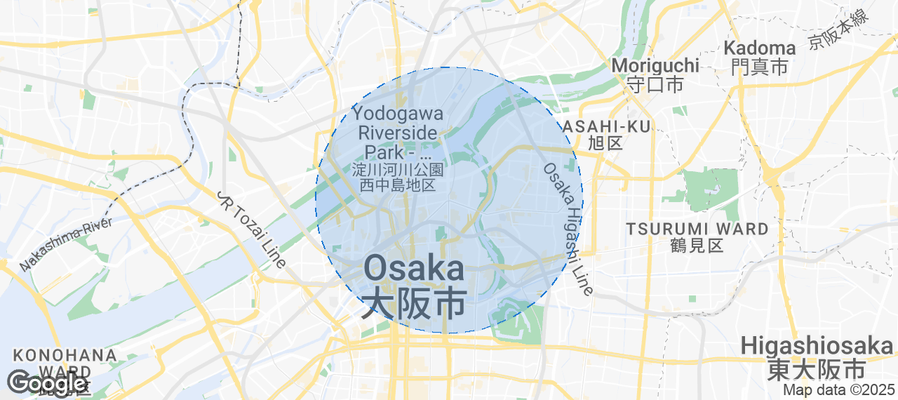
Best Areas for Airbnb Investment in Kita Ward (2026)
Exploring the top neighborhoods for short-term rentals in Kita Ward? This section highlights key areas, outlining why they are attractive for hosts and guests, along with notable local attractions. Consider these locations based on your target guest profile and investment strategy.
| Neighborhood / Area | Why Host Here? (Target Guests & Appeal) | Key Attractions & Landmarks |
|---|---|---|
| Namba | Namba is a bustling entertainment district known for its vibrant nightlife, shopping, and dining options. It is a prime location for tourists wanting to experience Osaka's famous culture and cuisine. | Dotonbori, Shinsaibashi Shopping Arcade, Namba Parks, Tsutenkaku Tower, Namba Yasaka Shrine |
| Shinsaibashi | Shinsaibashi is one of Osaka's most famous shopping areas, featuring upscale boutiques, international brands, and traditional shops. It's a favored spot for tourists looking for shopping and dining experiences. | Shinsaibashi-suji Shopping Street, Amerikamura, Midosuji Boulevard, Glico Man Sign, Dotonbori Nightlife |
| Umeda | Umeda is the central hub of the city, known for its skyscrapers, shopping centers, and corporate offices. It attracts business travelers and tourists alike with its convenience and amenities. | Umeda Sky Building, Grand Front Osaka, HEP Five, Osaka Station City, Osaka Aquarium Kaiyukan |
| Tennoji | Tennoji is a historical district that combines traditional culture with modern developments. It is home to several attractions that appeal to both history enthusiasts and modern-day travelers. | Shitennoji Temple, Tennoji Park, Abeno Harukas, Tsutenkaku Tower, Spa World |
| Osaka Castle | This area is famous for the iconic Osaka Castle and its surrounding park, making it a popular spot for tourists interested in history and nature. | Osaka Castle, Osaka Castle Park, NHK Osaka, Osaka Museum of History, Tomb of Toyotomi Hideyoshi |
| Kyobashi | Kyobashi is a convenient area for travelers with excellent transportation links. It offers a mix of residential and commercial spaces with easy access to major attractions. | Kyobashi Station, Osaka Tenmangu Shrine, Osaka Business Park, Kizu River, Umekita |
| Nishinari | Nishinari is an up-and-coming area known for its affordability and cultural diversity. It's gaining popularity with travelers looking for unique experiences away from mainstream tourist spots. | Shinsekai District, Tsutenkaku Tower, Spa World, Jan-Jan Yokocho, Fukushima Temple |
| Osaka Bay Area | This area includes attractions like Universal Studios and the Osaka Aquarium, making it a prime location for family-friendly travelers seeking entertainment and fun activities. | Universal Studios Japan, Osaka Aquarium Kaiyukan, Tempozan Ferris Wheel, Intex Osaka, Sumiyoshi Taisha |
Understanding Airbnb License Requirements & STR Laws in Kita Ward (2026)
Yes, Kita Ward, Osaka, Japan enforces high STR regulations. Obtaining a license and ensuring compliance is almost certainly required according to current 2026 STR laws. Always verify the latest short term rental regulations and Airbnb license requirements directly with local government authorities for Kita Ward to ensure full compliance before hosting.
(Source: AirROI data, 2026, based on 83% licensed listings)
Top Performing Airbnb Properties in Kita Ward (2026)
Benchmark your potential! Explore examples of top-performing Airbnb properties in Kita Wardbased on Trailing Twelve Month (TTM) revenue. Analyze their characteristics, revenue, occupancy rate, and ADR to understand what drives success in this market.
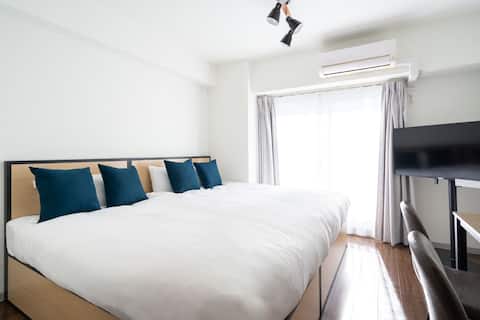
Good access to USJ / Near Osaka Station / f03
Entire Place • 1 bedroom
Right near Amanohashikō Station! Japanese modern hideaway luxury villa! Accommodates up to 14 people
Entire Place • 3 bedrooms
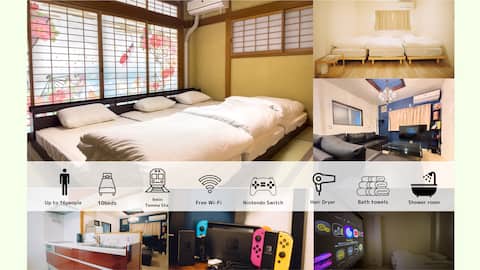
3 mins walk from Tenjinbashisuji 6-chome Station/1 room rental/Nintendo Switch/High-performance proj
Entire Place • 1 bedroom
Miyu・Kitagatsukyo|Walking distance to Umeda
Entire Place • 2 bedrooms
Tenma Family Suite Your Home in Osaka For 6 Guests
Entire Place • 2 bedrooms
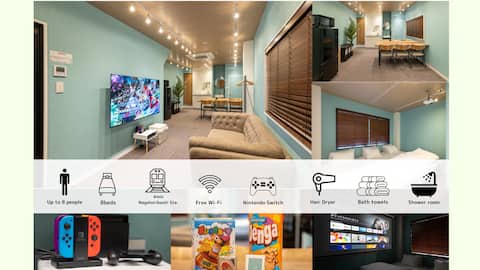
Tenmanbashi B&B Blue Sky Room; 3 bedrooms, 2 living rooms, 2 bathrooms, 2 bathrooms with floor heati
Entire Place • 3 bedrooms
Note: Performance varies based on location, size, amenities, seasonality, and management quality. Data reflects the past 12 months.
Top Performing Airbnb Hosts in Kita Ward (2026)
Learn from the best! This table showcases top-performing Airbnb hosts in Kita Ward based on the number of properties managed and estimated total revenue over the past year. Analyze their scale and performance metrics.
| Host Name | Properties | Grossing Revenue | Stay Reviews | Avg Rating |
|---|---|---|---|---|
| Yasu | 7 | $102,602 | 174 | 4.91/5.0 |
| Sumyca Osaka | 1 | $44,959 | 45 | 4.76/5.0 |
| 福澤 | 2 | $30,015 | 21 | 4.91/5.0 |
| 旭 | 5 | $29,883 | 17 | 4.83/5.0 |
| Daisuke | 1 | $28,798 | 73 | 4.78/5.0 |
| Matatabi | 2 | $28,560 | 39 | 4.76/5.0 |
| 大介 | 1 | $25,571 | 52 | 4.65/5.0 |
| Miyu | 1 | $23,758 | 24 | 4.88/5.0 |
| 心斋桥民宿 | 1 | $22,910 | 37 | 4.84/5.0 |
| 亜沙美 | 1 | $18,445 | 16 | 4.44/5.0 |
Analyzing the strategies of top hosts, such as their property selection, pricing, and guest communication, can offer valuable lessons for optimizing your own Airbnb operations in Kita Ward.
Dive Deeper: Advanced Kita Ward STR Market Data (2026)
Ready to unlock more insights? AirROI provides access to advanced metrics and comprehensive Airbnb data for Kita Ward. Explore detailed analytics beyond this report to refine your investment strategy, optimize pricing, and maximize your vacation rental profits.
Explore Advanced MetricsKita Ward Short-Term Rental Market Composition (2026): Property & Room Types
Room Type Distribution
Property Type Distribution
Market Composition Insights for Kita Ward
- The Kita Ward Airbnb market composition is heavily skewed towards Entire Home/Apt listings, which make up 100% of the 29 active rentals. This indicates strong guest preference for privacy and space.
- Looking at the property type distribution in Kita Ward, Apartment/Condo properties are the most common (86.2%), reflecting the local real estate landscape.
Kita Ward Airbnb Room Capacity Analysis (2026): Bedroom Distribution
Distribution of Listings by Number of Bedrooms
Room Capacity Insights for Kita Ward
- The dominant room capacity in Kita Ward is 1 bedroom listings, making up 72.4% of the market. This suggests a strong demand for properties suitable for couples or solo travelers.
- Together, 1 bedroom and 2 bedrooms properties represent 86.2% of the active Airbnb listings in Kita Ward, indicating a high concentration in these sizes.
- With over half the market (72.4%) consisting of studios or 1-bedroom units, Kita Ward is particularly well-suited for individuals or couples.
Kita Ward Vacation Rental Guest Capacity Trends (2026)
Distribution of Listings by Guest Capacity
Guest Capacity Insights for Kita Ward
- The most common guest capacity trend in Kita Ward vacation rentals is listings accommodating 4 guests (41.4%). This suggests the primary traveler segment is likely small families or groups.
- Properties designed for 4 guests and 3 guests dominate the Kita Ward STR market, accounting for 58.6% of listings.
- 27.5% of properties accommodate 6+ guests, serving the market segment for larger families or group travel in Kita Ward.
- On average, properties in Kita Ward are equipped to host 4.3 guests.
Kita Ward Airbnb Booking Patterns (2026): Available vs. Booked Days
Available Days Distribution
Booked Days Distribution
Booking Pattern Insights for Kita Ward
- The most common availability pattern in Kita Ward falls within the 181-270 days range, representing 55.2% of listings. This suggests many properties have significant open periods on their calendars.
- Approximately 79.3% of listings show high availability (181+ days open annually), indicating potential for increased bookings or specific owner usage patterns.
- For booked days, the 91-180 days range is most frequent in Kita Ward (44.8%), reflecting common guest stay durations or potential owner blocking patterns.
- A notable 31.0% of properties secure long booking periods (181+ days booked per year), highlighting successful long-term rental strategies or significant owner usage.
Kita Ward Airbnb Minimum Stay Requirements Analysis
Distribution of Listings by Minimum Night Requirement
1 Night
7 listings
24.1% of total
2 Nights
19 listings
65.5% of total
30+ Nights
3 listings
10.3% of total
Key Insights
- The most prevalent minimum stay requirement in Kita Ward is 2 Nights, adopted by 65.5% of listings. This highlights the market's preference for shorter, flexible bookings.
- A strong majority (89.6%) of the Kita Ward Airbnb data shows acceptance of very short stays (1-2 nights), indicating a dynamic, high-turnover market.
- A significant segment (10.3%) caters to monthly stays (30+ nights) in Kita Ward, pointing to opportunities in the extended-stay market.
Recommendations
- Align with the market by considering a 2 Nights minimum stay, as 65.5% of Kita Ward hosts use this setting.
- If feasible, allowing 1-night stays, especially midweek or during low season, could capture last-minute bookings, as only 24.1% currently do.
- Explore offering discounts for stays of 30+ nights to attract the 10.3% of the market seeking extended stays.
- Adjust minimum nights based on seasonality – potentially shorter during low season and longer during peak demand periods in Kita Ward.
Kita Ward Airbnb Cancellation Policy Trends Analysis (2026)
Flexible
10 listings
34.5% of total
Moderate
3 listings
10.3% of total
Firm
10 listings
34.5% of total
Strict
6 listings
20.7% of total
Cancellation Policy Insights for Kita Ward
- The prevailing Airbnb cancellation policy trend in Kita Ward is Flexible, used by 34.5% of listings.
- A majority (55.2%) of hosts in Kita Ward utilize Firm or Strict policies, indicating a market where hosts prioritize booking security.
Recommendations for Hosts
- Consider adopting a Flexible policy to align with the 34.5% market standard in Kita Ward.
- Regularly review your cancellation policy against competitors and market demand shifts in Kita Ward.
Kita Ward STR Booking Lead Time Analysis (2026)
Average Booking Lead Time by Month
Booking Lead Time Insights for Kita Ward
- The overall average booking lead time for vacation rentals in Kita Ward is 40 days.
- Guests book furthest in advance for stays during October (average 66 days), likely coinciding with peak travel demand or local events.
- The shortest booking windows occur for stays in April (average 0 days), indicating more last-minute travel plans during this time.
- Seasonally, Fall (58 days avg.) sees the longest lead times, while Spring (0 days avg.) has the shortest, reflecting typical travel planning cycles.
Recommendations for Hosts
- Use the overall average lead time (40 days) as a baseline for your pricing and availability strategy in Kita Ward.
- For October stays, consider implementing length-of-stay discounts or slightly higher rates for bookings made less than 66 days out to capitalize on advance planning.
- During April, focus on last-minute booking availability and promotions, as guests book with very short notice (0 days avg.).
- Target marketing efforts for the Fall season well in advance (at least 58 days) to capture early planners.
- Monitor your own booking lead times against these Kita Ward averages to identify opportunities for dynamic pricing adjustments.
Popular & Essential Airbnb Amenities in Kita Ward (2026)
Amenity Prevalence
Amenity Insights for Kita Ward
- Essential amenities in Kita Ward that guests expect include: Conditioner, Wifi, Hair dryer, Shampoo, Smoke alarm, Air conditioning, Hot water, Hot water kettle. Lacking these (any) could significantly impact bookings.
- Popular amenities like Kitchen, Dishes and silverware are common but not universal. Offering these can provide a competitive edge.
Recommendations for Hosts
- Ensure your listing includes all essential amenities for Kita Ward: Conditioner, Wifi, Hair dryer, Shampoo, Smoke alarm, Air conditioning, Hot water, Hot water kettle.
- Prioritize adding missing essentials: Hot water, Hot water kettle.
- Consider adding popular differentiators like Kitchen or Dishes and silverware to increase appeal.
- Highlight unique or less common amenities you offer (e.g., hot tub, dedicated workspace, EV charger) in your listing description and photos.
- Regularly check competitor amenities in Kita Ward to stay competitive.
Kita Ward Airbnb Guest Demographics & Profile Analysis (2026)
Guest Profile Summary for Kita Ward
- The typical guest profile for Airbnb in Kita Ward consists of predominantly international visitors (86%), with top international origins including United States, typically belonging to the Post-2000s (Gen Z/Alpha) group (50%), primarily speaking English or Japanese.
- Domestic travelers account for 14.5% of guests.
- Key international markets include Japan (14.5%) and United States (14%).
- Top languages spoken are English (40%) followed by Japanese (10.3%).
- A significant demographic segment is the Post-2000s (Gen Z/Alpha) group, representing 50% of guests.
Recommendations for Hosts
- Focus marketing internationally, particularly towards travelers from United States.
- Tailor amenities and listing descriptions to appeal to the dominant Post-2000s (Gen Z/Alpha) demographic (e.g., highlight fast WiFi, smart home features, local guides).
- Highlight unique local experiences or amenities relevant to the primary guest profile.
- Consider seasonal promotions aligned with peak travel times for key origin markets.
Nearby Short-Term Rental Market Comparison
How does the Kita Ward Airbnb market stack up against its neighbors? Compare key performance metrics like average monthly revenue, ADR, and occupancy rates in surrounding areas to understand the broader regional STR landscape.
| Market | Active Properties | Monthly Revenue | Daily Rate | Avg. Occupancy |
|---|---|---|---|---|
| Minamiawaji | 41 | $4,120 | $363.92 | 40% |
| Shima | 40 | $3,717 | $295.59 | 40% |
| Toba | 12 | $3,477 | $332.20 | 31% |
| Shimogyo Ward | 34 | $3,396 | $279.96 | 49% |
| Kameoka | 11 | $3,265 | $226.40 | 45% |
| Awaji | 106 | $3,260 | $271.78 | 41% |
| Kyoto | 3,744 | $3,232 | $193.65 | 57% |
| Minami Ward | 28 | $2,977 | $202.49 | 59% |
| Kamigyo Ward | 11 | $2,757 | $218.11 | 50% |
| Fushimi Ward | 12 | $2,704 | $194.55 | 53% |