Anan Airbnb Market Analysis 2026: Short Term Rental Data & Vacation Rental Statistics in Tokushima Prefecture, Japan
Is Airbnb profitable in Anan in 2026? Explore comprehensive Airbnb analytics for Anan, Tokushima Prefecture, Japan to uncover income potential. This 2026 STR market report for Anan, based on AirROI data from February 2025 to January 2026, reveals key trends in the niche market of 19 active listings.
Whether you're considering an Airbnb investment in Anan, optimizing your existing vacation rental, or exploring rental arbitrage opportunities, understanding the Anan Airbnb data is crucial. Navigating the high regulation landscape is key to maximizing your short term rental income potential. Let's dive into the specifics.
Key Anan Airbnb Performance Metrics Overview
Monthly Airbnb Revenue Variations & Income Potential in Anan (2026)
Understanding the monthly revenue variations for Airbnb listings in Anan is key to maximizing your short term rental income potential. Seasonality significantly impacts earnings. Our analysis, based on data from the past 12 months, shows that the peak revenue month for STRs in Anan is typically August, while January often presents the lowest earnings, highlighting opportunities for strategic pricing adjustments during shoulder and low seasons. Explore the typical Airbnb income in Anan across different performance tiers:
- Best-in-class properties (Top 10%) achieve $2,526+ monthly, often utilizing dynamic pricing and superior guest experiences.
- Strong performing properties (Top 25%) earn $1,794 or more, indicating effective management and desirable locations/amenities.
- Typical properties (Median) generate around $809 per month, representing the average market performance.
- Entry-level properties (Bottom 25%) see earnings around $374, often with potential for optimization.
Average Monthly Airbnb Earnings Trend in Anan
Anan Airbnb Occupancy Rate Trends (2026)
Maximize your bookings by understanding the Anan STR occupancy trends. Seasonal demand shifts significantly influence how often properties are booked. Typically, Augustsees the highest demand (peak season occupancy), while January experiences the lowest (low season). Effective strategies, like adjusting minimum stays or offering promotions, can boost occupancy during slower periods. Here's how different property tiers perform in Anan:
- Best-in-class properties (Top 10%) achieve 60%+ occupancy, indicating high desirability and potentially optimized availability.
- Strong performing properties (Top 25%) maintain 35% or higher occupancy, suggesting good market fit and guest satisfaction.
- Typical properties (Median) have an occupancy rate around 22%.
- Entry-level properties (Bottom 25%) average 12% occupancy, potentially facing higher vacancy.
Average Monthly Occupancy Rate Trend in Anan
Average Daily Rate (ADR) Airbnb Trends in Anan (2026)
Effective short term rental pricing strategy in Anan involves understanding monthly ADR fluctuations. The Average Daily Rate (ADR) for Airbnb in Anan typically peaks in May and dips lowest during April. Leveraging Airbnb dynamic pricing tools or strategies based on this seasonality can significantly boost revenue. Here's a look at the typical nightly rates achieved:
- Best-in-class properties (Top 10%) command rates of $277+ per night, often due to premium features or locations.
- Strong performing properties (Top 25%) achieve nightly rates of $236 or more.
- Typical properties (Median) charge around $55 per night.
- Entry-level properties (Bottom 25%) earn around $34 per night.
Average Daily Rate (ADR) Trend by Month in Anan
Get Live Anan Market Intelligence 👇
Explore Real-time Analytics
Airbnb Seasonality Analysis & Trends in Anan (2026)
Peak Season (August, November, March)
- Revenue averages $1,675 per month
- Occupancy rates average 39.3%
- Daily rates average $138
Shoulder Season
- Revenue averages $1,100 per month
- Occupancy maintains around 28.8%
- Daily rates hold near $134
Low Season (January, May, June)
- Revenue drops to average $744 per month
- Occupancy decreases to average 20.5%
- Daily rates adjust to average $144
Seasonality Insights for Anan
- The Airbnb seasonality in Anan shows highly seasonal trends requiring careful strategy. While the sections above show seasonal averages, it's also insightful to look at the extremes:
- During the high season, the absolute peak month showcases Anan's highest earning potential, with monthly revenues capable of climbing to $2,067, occupancy reaching a high of 43.8%, and ADRs peaking at $153.
- Conversely, the slowest single month of the year, typically falling within the low season, marks the market's lowest point. In this month, revenue might dip to $532, occupancy could drop to 13.8%, and ADRs may adjust down to $122.
- Understanding both the seasonal averages and these monthly peaks and troughs in revenue, occupancy, and ADR is crucial for maximizing your Airbnb profit potential in Anan.
Seasonal Strategies for Maximizing Profit
- Peak Season: Maximize revenue through premium pricing and potentially longer minimum stays. Ensure high availability.
- Low Season: Offer competitive pricing, special promotions (e.g., extended stay discounts), and flexible cancellation policies. Target off-season travelers like remote workers or budget-conscious guests.
- Shoulder Seasons: Implement dynamic pricing that balances peak and low rates. Target weekend travelers or specific events. Offer slightly more flexible terms than peak season.
- Regularly analyze your own performance against these Anan seasonality benchmarks and adjust your pricing and availability strategy accordingly.
Best Areas for Airbnb Investment in Anan (2026)
Exploring the top neighborhoods for short-term rentals in Anan? This section highlights key areas, outlining why they are attractive for hosts and guests, along with notable local attractions. Consider these locations based on your target guest profile and investment strategy.
| Neighborhood / Area | Why Host Here? (Target Guests & Appeal) | Key Attractions & Landmarks |
|---|---|---|
| Anan City Center | The heart of Anan, known for its accessibility and local attractions. Ideal for visitors wanting to explore the city culture and local food scene. | Anan City Hall, Matsushita Park, Local restaurants and izakayas, Shopping areas, Anan Sun Live Hall |
| Kito Beach | A beautiful beach area popular for summer tourism, providing an excellent location for beachgoers and water sports enthusiasts. | Kito Beach, Anan Marine Park, Water sports facilities, Beachside cafes, Scenic coastal walks |
| Tsunomine Park | A lovely park area that attracts nature lovers and families looking for a tranquil retreat near Anan, especially during cherry blossom season. | Tsunomine Shrine, Cherry blossom viewing spots, Walking trails, Picnic areas, Nature photography opportunities |
| O koya Mountain | Great for nature lovers and hikers, offering stunning views and hiking trails. Perfect for those seeking adventure and outdoor experiences. | O koya Hiking Trails, Scenic viewpoints, Wildlife watching, Nature retreats, Cultural experiences with local guides |
| Anan Port Area | A vibrant area that showcases Anan's maritime culture and seafood. Great for seafood enthusiasts and those interested in local maritime history. | Anan Port, Fresh seafood market, Cruise tours, Maritime museum, Waterfront dining |
| Tobishima Island | A beautiful island perfect for day trips, attracting visitors looking for scenic beauty and cultural experiences linked with local traditions. | Tobishima shrine, Bicycle tours around the island, Local seafood dining, Beautiful coastal scenery, Cultural festivals |
| Yakuo-ji Temple | One of the oldest temples in the region, attracting visitors interested in history and spirituality. A peaceful retreat from the city hustle. | Historic temple architecture, Peaceful gardens, Cultural heritage tours, Pilgrimage routes, Local religious festivals |
| Anan Aquarium | A family-friendly attraction that's perfect for those traveling with children. Provides a unique experience of marine life in Tokushima. | Marine exhibitions, Interactive exhibits, Feeding shows, Family-friendly activities, Ocean education programs |
Understanding Airbnb License Requirements & STR Laws in Anan (2026)
Yes, Anan, Tokushima Prefecture, Japan enforces high STR regulations. Obtaining a license and ensuring compliance is almost certainly required according to current 2026 STR laws. Always verify the latest short term rental regulations and Airbnb license requirements directly with local government authorities for Anan to ensure full compliance before hosting.
(Source: AirROI data, 2026, based on 89% licensed listings)
Top Performing Airbnb Properties in Anan (2026)
Benchmark your potential! Explore examples of top-performing Airbnb properties in Ananbased on Trailing Twelve Month (TTM) revenue. Analyze their characteristics, revenue, occupancy rate, and ADR to understand what drives success in this market.
Cottage-A Rental for Group & Family
Private Room • 3 bedrooms

Atarashiya|Cuisine of local fish and roasted coffee|Dinner and breakfast included Half board
Private Room • 1 bedroom

Cottage-B Rental for Group & Family
Private Room • 3 bedrooms

Polaris113~Villa~204㎡~75inTV/Nintendo/PS5/Netflix
Entire Place • 3 bedrooms

Cottage-C Rental for Group & Family
Private Room • 3 bedrooms
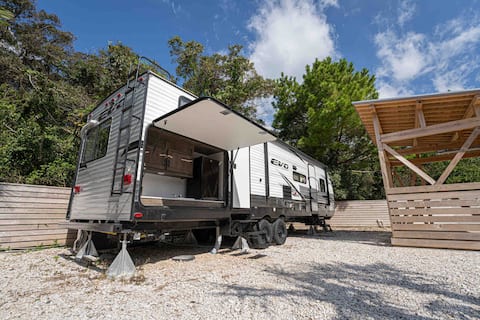
American trailer house with the sea right in front of you and a taco bar
Entire Place • 2 bedrooms
Note: Performance varies based on location, size, amenities, seasonality, and management quality. Data reflects the past 12 months.
Top Performing Airbnb Hosts in Anan (2026)
Learn from the best! This table showcases top-performing Airbnb hosts in Anan based on the number of properties managed and estimated total revenue over the past year. Analyze their scale and performance metrics.
| Host Name | Properties | Grossing Revenue | Stay Reviews | Avg Rating |
|---|---|---|---|---|
| Cottage | 3 | $70,929 | 57 | 4.82/5.0 |
| 英美 | 1 | $26,742 | 47 | 4.94/5.0 |
| Hiroto | 1 | $19,586 | 31 | 4.97/5.0 |
| 好貴 | 1 | $13,111 | 5 | 5.00/5.0 |
| 山本 | 3 | $11,398 | 64 | 4.82/5.0 |
| Yuki | 4 | $9,806 | 35 | 4.51/5.0 |
| Baysidehotel Ryugu | 1 | $8,029 | 1 | Not Rated |
| Hiro. | 1 | $6,119 | 27 | 4.70/5.0 |
| Daruma | 1 | $5,112 | 11 | 4.36/5.0 |
| Masaki | 2 | $3,031 | 6 | 5.00/5.0 |
Analyzing the strategies of top hosts, such as their property selection, pricing, and guest communication, can offer valuable lessons for optimizing your own Airbnb operations in Anan.
Dive Deeper: Advanced Anan STR Market Data (2026)
Ready to unlock more insights? AirROI provides access to advanced metrics and comprehensive Airbnb data for Anan. Explore detailed analytics beyond this report to refine your investment strategy, optimize pricing, and maximize your vacation rental profits.
Explore Advanced MetricsAnan Short-Term Rental Market Composition (2026): Property & Room Types
Room Type Distribution
Property Type Distribution
Market Composition Insights for Anan
- The Anan Airbnb market composition is heavily skewed towards Private Room listings, which make up 57.9% of the 19 active rentals. This indicates strong guest preference for privacy and space.
- Looking at the property type distribution in Anan, House properties are the most common (84.2%), reflecting the local real estate landscape.
- Houses represent a significant 84.2% portion, catering likely to families or larger groups.
- The presence of 10.5% Hotel/Boutique listings indicates integration with traditional hospitality.
Anan Airbnb Room Capacity Analysis (2026): Bedroom Distribution
Distribution of Listings by Number of Bedrooms
Room Capacity Insights for Anan
- The dominant room capacity in Anan is 3 bedrooms listings, making up 36.8% of the market. This suggests a strong demand for properties suitable for families or small groups.
- Together, 3 bedrooms and 1 bedroom properties represent 57.9% of the active Airbnb listings in Anan, indicating a high concentration in these sizes.
- A significant 42.1% of listings offer 3+ bedrooms, catering to larger groups and families seeking more space in Anan.
Anan Vacation Rental Guest Capacity Trends (2026)
Distribution of Listings by Guest Capacity
Guest Capacity Insights for Anan
- The most common guest capacity trend in Anan vacation rentals is listings accommodating 8+ guests (26.3%). This suggests the primary traveler segment is likely larger groups.
- Properties designed for 8+ guests and 6 guests dominate the Anan STR market, accounting for 36.8% of listings.
- 36.8% of properties accommodate 6+ guests, serving the market segment for larger families or group travel in Anan.
- On average, properties in Anan are equipped to host 3.6 guests.
Anan Airbnb Booking Patterns (2026): Available vs. Booked Days
Available Days Distribution
Booked Days Distribution
Booking Pattern Insights for Anan
- The most common availability pattern in Anan falls within the 271-366 days range, representing 73.7% of listings. This suggests many properties have significant open periods on their calendars.
- Approximately 94.8% of listings show high availability (181+ days open annually), indicating potential for increased bookings or specific owner usage patterns.
- For booked days, the 31-90 days range is most frequent in Anan (42.1%), reflecting common guest stay durations or potential owner blocking patterns.
- A notable 5.3% of properties secure long booking periods (181+ days booked per year), highlighting successful long-term rental strategies or significant owner usage.
Anan Airbnb Minimum Stay Requirements Analysis
Distribution of Listings by Minimum Night Requirement
1 Night
17 listings
89.5% of total
2 Nights
1 listings
5.3% of total
30+ Nights
1 listings
5.3% of total
Key Insights
- The most prevalent minimum stay requirement in Anan is 1 Night, adopted by 89.5% of listings. This highlights the market's preference for shorter, flexible bookings.
- A strong majority (94.8%) of the Anan Airbnb data shows acceptance of very short stays (1-2 nights), indicating a dynamic, high-turnover market.
Recommendations
- Align with the market by considering a 1 Night minimum stay, as 89.5% of Anan hosts use this setting.
- Explore offering discounts for stays of 30+ nights to attract the 5.3% of the market seeking extended stays.
- Adjust minimum nights based on seasonality – potentially shorter during low season and longer during peak demand periods in Anan.
Anan Airbnb Cancellation Policy Trends Analysis (2026)
Flexible
5 listings
26.3% of total
Moderate
7 listings
36.8% of total
Firm
7 listings
36.8% of total
Cancellation Policy Insights for Anan
- The prevailing Airbnb cancellation policy trend in Anan is Moderate, used by 36.8% of listings.
- There's a relatively balanced mix between guest-friendly (63.1%) and stricter (36.8%) policies, offering choices for different guest needs.
Recommendations for Hosts
- Consider adopting a Moderate policy to align with the 36.8% market standard in Anan.
- Regularly review your cancellation policy against competitors and market demand shifts in Anan.
Anan STR Booking Lead Time Analysis (2026)
Average Booking Lead Time by Month
Booking Lead Time Insights for Anan
- The overall average booking lead time for vacation rentals in Anan is 27 days.
- Guests book furthest in advance for stays during September (average 48 days), likely coinciding with peak travel demand or local events.
- The shortest booking windows occur for stays in February (average 17 days), indicating more last-minute travel plans during this time.
- Seasonally, Fall (34 days avg.) sees the longest lead times, while Spring (23 days avg.) has the shortest, reflecting typical travel planning cycles.
Recommendations for Hosts
- Use the overall average lead time (27 days) as a baseline for your pricing and availability strategy in Anan.
- For September stays, consider implementing length-of-stay discounts or slightly higher rates for bookings made less than 48 days out to capitalize on advance planning.
- Target marketing efforts for the Fall season well in advance (at least 34 days) to capture early planners.
- Monitor your own booking lead times against these Anan averages to identify opportunities for dynamic pricing adjustments.
Popular & Essential Airbnb Amenities in Anan (2026)
Amenity Prevalence
Amenity Insights for Anan
- Essential amenities in Anan that guests expect include: Shampoo, Air conditioning, Wifi, Smoke alarm, Hair dryer. Lacking these (any) could significantly impact bookings.
- Popular amenities like Heating, Conditioner, Body soap are common but not universal. Offering these can provide a competitive edge.
Recommendations for Hosts
- Ensure your listing includes all essential amenities for Anan: Shampoo, Air conditioning, Wifi, Smoke alarm, Hair dryer.
- Consider adding popular differentiators like Heating or Conditioner to increase appeal.
- Highlight unique or less common amenities you offer (e.g., hot tub, dedicated workspace, EV charger) in your listing description and photos.
- Regularly check competitor amenities in Anan to stay competitive.
Anan Airbnb Guest Demographics & Profile Analysis (2026)
Guest Profile Summary for Anan
- The typical guest profile for Airbnb in Anan consists of predominantly international visitors (75%), with top international origins including United States, typically belonging to the Post-2000s (Gen Z/Alpha) group (50%), primarily speaking Japanese or English.
- Domestic travelers account for 25.0% of guests.
- Key international markets include Japan (25%) and United States (20.8%).
- Top languages spoken are Japanese (34.8%) followed by English (26.1%).
- A significant demographic segment is the Post-2000s (Gen Z/Alpha) group, representing 50% of guests.
Recommendations for Hosts
- Focus marketing internationally, particularly towards travelers from United States.
- Offer listing details and communication support in Japanese.
- Tailor amenities and listing descriptions to appeal to the dominant Post-2000s (Gen Z/Alpha) demographic (e.g., highlight fast WiFi, smart home features, local guides).
- Highlight unique local experiences or amenities relevant to the primary guest profile.
- Consider seasonal promotions aligned with peak travel times for key origin markets.
Nearby Short-Term Rental Market Comparison
How does the Anan Airbnb market stack up against its neighbors? Compare key performance metrics like average monthly revenue, ADR, and occupancy rates in surrounding areas to understand the broader regional STR landscape.
| Market | Active Properties | Monthly Revenue | Daily Rate | Avg. Occupancy |
|---|---|---|---|---|
| Naoshima | 23 | $4,409 | $191.63 | 74% |
| Minamiawaji | 41 | $4,120 | $363.92 | 40% |
| Shimogyo Ward | 34 | $3,396 | $279.96 | 49% |
| Awaji | 106 | $3,260 | $271.78 | 41% |
| Minami Ward | 28 | $2,977 | $202.49 | 59% |
| Fushimi Ward | 12 | $2,704 | $194.55 | 53% |
| Tonosho | 59 | $2,640 | $169.56 | 51% |
| Shodoshima | 29 | $2,301 | $167.15 | 47% |
| Higashiyama Ward | 36 | $2,209 | $161.63 | 48% |
| Sumoto | 70 | $2,203 | $208.85 | 36% |