Bunkyo City Airbnb Market Analysis 2026: Short Term Rental Data & Vacation Rental Statistics in Tokyo Prefecture, Japan
Is Airbnb profitable in Bunkyo City in 2026? Explore comprehensive Airbnb analytics for Bunkyo City, Tokyo Prefecture, Japan to uncover income potential. This 2026 STR market report for Bunkyo City, based on AirROI data from February 2025 to January 2026, reveals key trends in the niche market of 44 active listings.
Whether you're considering an Airbnb investment in Bunkyo City, optimizing your existing vacation rental, or exploring rental arbitrage opportunities, understanding the Bunkyo City Airbnb data is crucial. Navigating the high regulation landscape is key to maximizing your short term rental income potential. Let's dive into the specifics.
Key Bunkyo City Airbnb Performance Metrics Overview
Monthly Airbnb Revenue Variations & Income Potential in Bunkyo City (2026)
Understanding the monthly revenue variations for Airbnb listings in Bunkyo City is key to maximizing your short term rental income potential. Seasonality significantly impacts earnings. Our analysis, based on data from the past 12 months, shows that the peak revenue month for STRs in Bunkyo City is typically October, while May often presents the lowest earnings, highlighting opportunities for strategic pricing adjustments during shoulder and low seasons. Explore the typical Airbnb income in Bunkyo City across different performance tiers:
- Best-in-class properties (Top 10%) achieve $8,574+ monthly, often utilizing dynamic pricing and superior guest experiences.
- Strong performing properties (Top 25%) earn $3,099 or more, indicating effective management and desirable locations/amenities.
- Typical properties (Median) generate around $1,992 per month, representing the average market performance.
- Entry-level properties (Bottom 25%) see earnings around $1,239, often with potential for optimization.
Average Monthly Airbnb Earnings Trend in Bunkyo City
Bunkyo City Airbnb Occupancy Rate Trends (2026)
Maximize your bookings by understanding the Bunkyo City STR occupancy trends. Seasonal demand shifts significantly influence how often properties are booked. Typically, Novembersees the highest demand (peak season occupancy), while May experiences the lowest (low season). Effective strategies, like adjusting minimum stays or offering promotions, can boost occupancy during slower periods. Here's how different property tiers perform in Bunkyo City:
- Best-in-class properties (Top 10%) achieve 75%+ occupancy, indicating high desirability and potentially optimized availability.
- Strong performing properties (Top 25%) maintain 68% or higher occupancy, suggesting good market fit and guest satisfaction.
- Typical properties (Median) have an occupancy rate around 52%.
- Entry-level properties (Bottom 25%) average 34% occupancy, potentially facing higher vacancy.
Average Monthly Occupancy Rate Trend in Bunkyo City
Average Daily Rate (ADR) Airbnb Trends in Bunkyo City (2026)
Effective short term rental pricing strategy in Bunkyo City involves understanding monthly ADR fluctuations. The Average Daily Rate (ADR) for Airbnb in Bunkyo City typically peaks in October and dips lowest during February. Leveraging Airbnb dynamic pricing tools or strategies based on this seasonality can significantly boost revenue. Here's a look at the typical nightly rates achieved:
- Best-in-class properties (Top 10%) command rates of $357+ per night, often due to premium features or locations.
- Strong performing properties (Top 25%) achieve nightly rates of $186 or more.
- Typical properties (Median) charge around $114 per night.
- Entry-level properties (Bottom 25%) earn around $89 per night.
Average Daily Rate (ADR) Trend by Month in Bunkyo City
Get Live Bunkyo City Market Intelligence 👇
Explore Real-time Analytics
Airbnb Seasonality Analysis & Trends in Bunkyo City (2026)
Peak Season (October, November, December)
- Revenue averages $6,009 per month
- Occupancy rates average 68.8%
- Daily rates average $268
Shoulder Season
- Revenue averages $2,490 per month
- Occupancy maintains around 41.7%
- Daily rates hold near $170
Low Season (February, March, April)
- Revenue drops to average $0 per month
- Occupancy decreases to average 0.0%
- Daily rates adjust to average $131
Seasonality Insights for Bunkyo City
- The Airbnb seasonality in Bunkyo City shows highly seasonal trends requiring careful strategy. While the sections above show seasonal averages, it's also insightful to look at the extremes:
- During the high season, the absolute peak month showcases Bunkyo City's highest earning potential, with monthly revenues capable of climbing to $6,705, occupancy reaching a high of 77.9%, and ADRs peaking at $275.
- Conversely, the slowest single month of the year, typically falling within the low season, marks the market's lowest point. In this month, revenue might dip to $0, occupancy could drop to 0.0%, and ADRs may adjust down to $131.
- Understanding both the seasonal averages and these monthly peaks and troughs in revenue, occupancy, and ADR is crucial for maximizing your Airbnb profit potential in Bunkyo City.
Seasonal Strategies for Maximizing Profit
- Peak Season: Maximize revenue through premium pricing and potentially longer minimum stays. Ensure high availability.
- Low Season: Offer competitive pricing, special promotions (e.g., extended stay discounts), and flexible cancellation policies. Target off-season travelers like remote workers or budget-conscious guests.
- Shoulder Seasons: Implement dynamic pricing that balances peak and low rates. Target weekend travelers or specific events. Offer slightly more flexible terms than peak season.
- Regularly analyze your own performance against these Bunkyo City seasonality benchmarks and adjust your pricing and availability strategy accordingly.
Best Areas for Airbnb Investment in Bunkyo City (2026)
Exploring the top neighborhoods for short-term rentals in Bunkyo City? This section highlights key areas, outlining why they are attractive for hosts and guests, along with notable local attractions. Consider these locations based on your target guest profile and investment strategy.
| Neighborhood / Area | Why Host Here? (Target Guests & Appeal) | Key Attractions & Landmarks |
|---|---|---|
| Yanaka | A historic neighborhood with traditional temples and a nostalgic atmosphere. Attracts tourists interested in traditional Japanese culture and local crafts. | Yanaka Ginza, Tenno-ji Temple, Zuiun-ji Temple, Yanaka Cemetery, Yuyake Dandan Stairs, Shitamachi Tanabata Matsuri |
| Nezu | Known for its beautiful shrines and traditional architecture, Nezu offers a quieter atmosphere and beautiful seasonal scenery, making it popular with those looking for a serene stay. | Nezu Shrine, Todaiji Temple, Yuyake Dandan Stairs, Inokashira Park, Toguri Museum of Art |
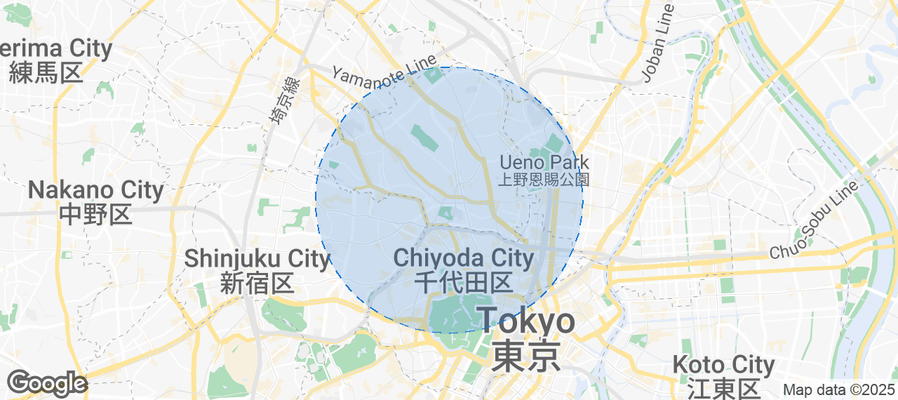
| Kamaigawa | A neighborhood close to Ueno Park, filled with museums and cultural institutions. It's a great base for exploring Tokyo's rich artistic heritage. | Ueno Park, Tokyo National Museum, Ueno Zoo, Tokyo Metropolitan Art Museum, Ameyoko Shopping Street |
| Hongo | Home to Tokyo University and a vibrant student population, Hongo is ideal for academic visitors and those seeking a lively urban experience with educational attractions. | Tokyo University, The National Museum of Nature and Science, Hongo Green Road, Kameido Tenjin Shrine, Koishikawa Botanical Garden |
| Sugamo | Often referred to as 'Granny's Harajuku', Sugamo attracts older crowds with its shopping streets dedicated to seniors, making it a unique location for family-oriented stays. | Jizo Dori Street, Koganji Temple, Sugamo Jizo-dori Shopping Street, Toshima City Life Safety Learning Center, Karaoke shops |
| Bunkyo Ward | A central area with a mix of residential living and cultural sites. It's ideal for visitors wanting a genuine Tokyo experience while being close to attractions and amenities. | Tokyo Dome City, Koishikawa Korakuen Garden, Bunkyo Civic Center, Bunkyo Gakuin University, Tokyo Dome |
| Iidabashi | A high-energy area with access to various trains and a bustling atmosphere, perfect for businesspeople and tourists seeking convenience and nightlife experiences. | Iidabashi Station, Tokyo Dome, Aquacity Odaiba, Bunkyo Civic Center, Korakuen |
| Takaido | A peaceful residential area with access to parks and local attractions. Great for those wanting a quiet stay while still being linked to central neighborhoods. | Takaido Park, Denzuin Temple, local shopping districts, Takaido-furin shops, Festivals in nearby parks |
Understanding Airbnb License Requirements & STR Laws in Bunkyo City (2026)
Yes, Bunkyo City, Tokyo Prefecture, Japan enforces high STR regulations. Obtaining a license and ensuring compliance is almost certainly required according to current 2026 STR laws. Always verify the latest short term rental regulations and Airbnb license requirements directly with local government authorities for Bunkyo City to ensure full compliance before hosting.
(Source: AirROI data, 2026, based on 93% licensed listings)
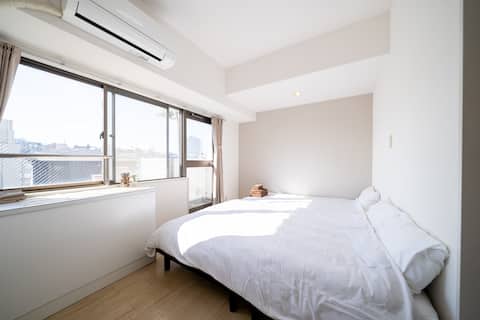
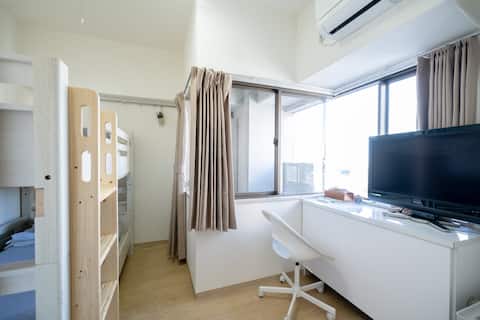
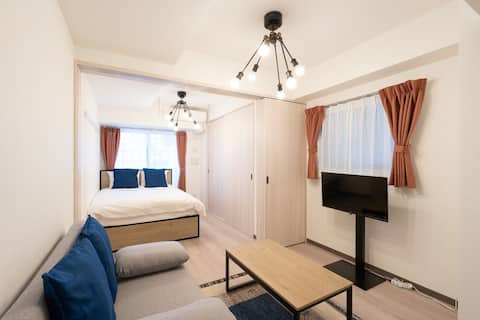
Top Performing Airbnb Properties in Bunkyo City (2026)
Benchmark your potential! Explore examples of top-performing Airbnb properties in Bunkyo Citybased on Trailing Twelve Month (TTM) revenue. Analyze their characteristics, revenue, occupancy rate, and ADR to understand what drives success in this market.
4px# JR subway 6 minutes walk / 4 people
Entire Place • 1 bedroom
#704 JR subway 6 minutes walk / 3 people
Entire Place • 1 bedroom
#901 JR subway 6 minutes walk / 2 people
Entire Place • 1 bedroom
1 station from Ikebukuro/Built in 2023/c01
Entire Place • 1 bedroom
Near Tokyo Dome/6 min. walk from Korakuen Station
Entire Place • N/A
West 3pxs - Entire rental. JR subway Yanakaginza 6 min walk / kitchen / private bathroom / appliance
Entire Place • 1 bedroom
Note: Performance varies based on location, size, amenities, seasonality, and management quality. Data reflects the past 12 months.
Top Performing Airbnb Hosts in Bunkyo City (2026)
Learn from the best! This table showcases top-performing Airbnb hosts in Bunkyo City based on the number of properties managed and estimated total revenue over the past year. Analyze their scale and performance metrics.
| Host Name | Properties | Grossing Revenue | Stay Reviews | Avg Rating |
|---|---|---|---|---|
| Sherry | 4 | $471,180 | 61 | 4.50/5.0 |
| Yoka | 13 | $150,632 | 210 | 4.26/5.0 |
| Sumyca Tokyo | 1 | $107,009 | 1 | Not Rated |
| 白山 | 3 | $78,529 | 108 | 4.66/5.0 |
| Sumyca | 1 | $55,551 | 47 | 4.74/5.0 |
| Selina | 5 | $51,269 | 43 | 4.98/5.0 |
| Yamashita | 1 | $46,982 | 26 | 4.96/5.0 |
| BB House | 4 | $45,463 | 122 | 4.88/5.0 |
| Shiki | 1 | $44,219 | 18 | 5.00/5.0 |
| Yui | 2 | $39,817 | 37 | 4.79/5.0 |
Analyzing the strategies of top hosts, such as their property selection, pricing, and guest communication, can offer valuable lessons for optimizing your own Airbnb operations in Bunkyo City.
Dive Deeper: Advanced Bunkyo City STR Market Data (2026)
Ready to unlock more insights? AirROI provides access to advanced metrics and comprehensive Airbnb data for Bunkyo City. Explore detailed analytics beyond this report to refine your investment strategy, optimize pricing, and maximize your vacation rental profits.
Explore Advanced MetricsBunkyo City Short-Term Rental Market Composition (2026): Property & Room Types
Room Type Distribution
Property Type Distribution
Market Composition Insights for Bunkyo City
- The Bunkyo City Airbnb market composition is heavily skewed towards Entire Home/Apt listings, which make up 88.6% of the 44 active rentals. This indicates strong guest preference for privacy and space.
- Looking at the property type distribution in Bunkyo City, Apartment/Condo properties are the most common (93.2%), reflecting the local real estate landscape.
Bunkyo City Airbnb Room Capacity Analysis (2026): Bedroom Distribution
Distribution of Listings by Number of Bedrooms
Room Capacity Insights for Bunkyo City
- The dominant room capacity in Bunkyo City is 1 bedroom listings, making up 68.2% of the market. This suggests a strong demand for properties suitable for couples or solo travelers.
- Together, 1 bedroom and 2 bedrooms properties represent 77.3% of the active Airbnb listings in Bunkyo City, indicating a high concentration in these sizes.
- With over half the market (68.2%) consisting of studios or 1-bedroom units, Bunkyo City is particularly well-suited for individuals or couples.
- Listings with 3+ bedrooms (2.3%) represent a smaller niche, potentially indicating an underserved market for larger group accommodations in Bunkyo City.
Bunkyo City Vacation Rental Guest Capacity Trends (2026)
Distribution of Listings by Guest Capacity
Guest Capacity Insights for Bunkyo City
- The most common guest capacity trend in Bunkyo City vacation rentals is listings accommodating 2 guests (40.9%). This suggests the primary traveler segment is likely couples or solo travelers.
- Properties designed for 2 guests and 4 guests dominate the Bunkyo City STR market, accounting for 59.1% of listings.
- A significant 40.9% of listings cater specifically to 1-2 guests, highlighting strong demand from couples and solo travelers in Bunkyo City.
- 18.2% of properties accommodate 6+ guests, serving the market segment for larger families or group travel in Bunkyo City.
- On average, properties in Bunkyo City are equipped to host 3.3 guests.
Bunkyo City Airbnb Booking Patterns (2026): Available vs. Booked Days
Available Days Distribution
Booked Days Distribution
Booking Pattern Insights for Bunkyo City
- The most common availability pattern in Bunkyo City falls within the 181-270 days range, representing 54.5% of listings. This suggests many properties have significant open periods on their calendars.
- Approximately 86.3% of listings show high availability (181+ days open annually), indicating potential for increased bookings or specific owner usage patterns.
- For booked days, the 91-180 days range is most frequent in Bunkyo City (59.1%), reflecting common guest stay durations or potential owner blocking patterns.
- A notable 13.6% of properties secure long booking periods (181+ days booked per year), highlighting successful long-term rental strategies or significant owner usage.
Bunkyo City Airbnb Minimum Stay Requirements Analysis
Distribution of Listings by Minimum Night Requirement
1 Night
26 listings
59.1% of total
2 Nights
6 listings
13.6% of total
3 Nights
3 listings
6.8% of total
7-29 Nights
2 listings
4.5% of total
30+ Nights
7 listings
15.9% of total
Key Insights
- The most prevalent minimum stay requirement in Bunkyo City is 1 Night, adopted by 59.1% of listings. This highlights the market's preference for shorter, flexible bookings.
- A strong majority (72.7%) of the Bunkyo City Airbnb data shows acceptance of very short stays (1-2 nights), indicating a dynamic, high-turnover market.
- A significant segment (15.9%) caters to monthly stays (30+ nights) in Bunkyo City, pointing to opportunities in the extended-stay market.
Recommendations
- Align with the market by considering a 1 Night minimum stay, as 59.1% of Bunkyo City hosts use this setting.
- Explore offering discounts for stays of 30+ nights to attract the 15.9% of the market seeking extended stays.
- Adjust minimum nights based on seasonality – potentially shorter during low season and longer during peak demand periods in Bunkyo City.
Bunkyo City Airbnb Cancellation Policy Trends Analysis (2026)
Super Strict 60 Days
1 listings
2.3% of total
Limited
1 listings
2.3% of total
Flexible
3 listings
6.8% of total
Moderate
6 listings
13.6% of total
Firm
12 listings
27.3% of total
Strict
21 listings
47.7% of total
Cancellation Policy Insights for Bunkyo City
- The prevailing Airbnb cancellation policy trend in Bunkyo City is Strict, used by 47.7% of listings.
- A majority (75.0%) of hosts in Bunkyo City utilize Firm or Strict policies, indicating a market where hosts prioritize booking security.
Recommendations for Hosts
- Consider adopting a Strict policy to align with the 47.7% market standard in Bunkyo City.
- With 47.7% using Strict terms, this is a viable option in Bunkyo City, particularly for high-value properties or during peak demand periods.
- Regularly review your cancellation policy against competitors and market demand shifts in Bunkyo City.
Bunkyo City STR Booking Lead Time Analysis (2026)
Average Booking Lead Time by Month
Booking Lead Time Insights for Bunkyo City
- The overall average booking lead time for vacation rentals in Bunkyo City is 33 days.
- Guests book furthest in advance for stays during November (average 59 days), likely coinciding with peak travel demand or local events.
- The shortest booking windows occur for stays in April (average 0 days), indicating more last-minute travel plans during this time.
- Seasonally, Fall (50 days avg.) sees the longest lead times, while Spring (1 days avg.) has the shortest, reflecting typical travel planning cycles.
Recommendations for Hosts
- Use the overall average lead time (33 days) as a baseline for your pricing and availability strategy in Bunkyo City.
- For November stays, consider implementing length-of-stay discounts or slightly higher rates for bookings made less than 59 days out to capitalize on advance planning.
- During April, focus on last-minute booking availability and promotions, as guests book with very short notice (0 days avg.).
- Target marketing efforts for the Fall season well in advance (at least 50 days) to capture early planners.
- Monitor your own booking lead times against these Bunkyo City averages to identify opportunities for dynamic pricing adjustments.
Popular & Essential Airbnb Amenities in Bunkyo City (2026)
Amenity Prevalence
Amenity Insights for Bunkyo City
- Essential amenities in Bunkyo City that guests expect include: Shampoo, Air conditioning, Wifi, Hair dryer, Conditioner, Hot water kettle, Smoke alarm, Heating, Hangers. Lacking these (any) could significantly impact bookings.
- Popular amenities like Hot water are common but not universal. Offering these can provide a competitive edge.
Recommendations for Hosts
- Ensure your listing includes all essential amenities for Bunkyo City: Shampoo, Air conditioning, Wifi, Hair dryer, Conditioner, Hot water kettle, Smoke alarm, Heating, Hangers.
- Prioritize adding missing essentials: Conditioner, Hot water kettle, Smoke alarm, Heating, Hangers.
- Consider adding popular differentiators like Hot water to increase appeal.
- Highlight unique or less common amenities you offer (e.g., hot tub, dedicated workspace, EV charger) in your listing description and photos.
- Regularly check competitor amenities in Bunkyo City to stay competitive.
Bunkyo City Airbnb Guest Demographics & Profile Analysis (2026)
Guest Profile Summary for Bunkyo City
- The typical guest profile for Airbnb in Bunkyo City consists of predominantly international visitors (95%), with top international origins including Canada, typically belonging to the Post-2000s (Gen Z/Alpha) group (50%), primarily speaking English or Chinese.
- Domestic travelers account for 4.9% of guests.
- Key international markets include United States (24.9%) and Canada (9%).
- Top languages spoken are English (45.6%) followed by Chinese (11.8%).
- A significant demographic segment is the Post-2000s (Gen Z/Alpha) group, representing 50% of guests.
Recommendations for Hosts
- Focus marketing internationally, particularly towards travelers from Canada.
- Tailor amenities and listing descriptions to appeal to the dominant Post-2000s (Gen Z/Alpha) demographic (e.g., highlight fast WiFi, smart home features, local guides).
- Highlight unique local experiences or amenities relevant to the primary guest profile.
- Consider seasonal promotions aligned with peak travel times for key origin markets.
Nearby Short-Term Rental Market Comparison
How does the Bunkyo City Airbnb market stack up against its neighbors? Compare key performance metrics like average monthly revenue, ADR, and occupancy rates in surrounding areas to understand the broader regional STR landscape.
| Market | Active Properties | Monthly Revenue | Daily Rate | Avg. Occupancy |
|---|---|---|---|---|
| Shinagawa City | 50 | $7,769 | $428.93 | 62% |
| Futtsu | 31 | $5,187 | $369.80 | 44% |
| Kyonan | 15 | $5,099 | $419.89 | 42% |
| Adachi City | 47 | $4,752 | $301.69 | 50% |
| Kita | 15 | $4,563 | $305.24 | 57% |
| Shirako | 22 | $4,439 | $359.94 | 34% |
| Nagatoro | 10 | $4,035 | $249.70 | 52% |
| Kamogawa | 36 | $4,007 | $296.27 | 37% |
| Hakone | 335 | $3,905 | $289.84 | 48% |
| Karuizawa | 121 | $3,852 | $396.31 | 39% |