Chiyoda City Airbnb Market Analysis 2026: Short Term Rental Data & Vacation Rental Statistics in Tokyo Prefecture, Japan
Is Airbnb profitable in Chiyoda City in 2026? Explore comprehensive Airbnb analytics for Chiyoda City, Tokyo Prefecture, Japan to uncover income potential. This 2026 STR market report for Chiyoda City, based on AirROI data from February 2025 to January 2026, reveals key trends in the niche market of 38 active listings.
Whether you're considering an Airbnb investment in Chiyoda City, optimizing your existing vacation rental, or exploring rental arbitrage opportunities, understanding the Chiyoda City Airbnb data is crucial. Navigating the high regulation landscape is key to maximizing your short term rental income potential. Let's dive into the specifics.
Key Chiyoda City Airbnb Performance Metrics Overview
Monthly Airbnb Revenue Variations & Income Potential in Chiyoda City (2026)
Understanding the monthly revenue variations for Airbnb listings in Chiyoda City is key to maximizing your short term rental income potential. Seasonality significantly impacts earnings. Our analysis, based on data from the past 12 months, shows that the peak revenue month for STRs in Chiyoda City is typically December, while May often presents the lowest earnings, highlighting opportunities for strategic pricing adjustments during shoulder and low seasons. Explore the typical Airbnb income in Chiyoda City across different performance tiers:
- Best-in-class properties (Top 10%) achieve $5,181+ monthly, often utilizing dynamic pricing and superior guest experiences.
- Strong performing properties (Top 25%) earn $4,258 or more, indicating effective management and desirable locations/amenities.
- Typical properties (Median) generate around $3,057 per month, representing the average market performance.
- Entry-level properties (Bottom 25%) see earnings around $2,188, often with potential for optimization.
Average Monthly Airbnb Earnings Trend in Chiyoda City
Chiyoda City Airbnb Occupancy Rate Trends (2026)
Maximize your bookings by understanding the Chiyoda City STR occupancy trends. Seasonal demand shifts significantly influence how often properties are booked. Typically, Octobersees the highest demand (peak season occupancy), while May experiences the lowest (low season). Effective strategies, like adjusting minimum stays or offering promotions, can boost occupancy during slower periods. Here's how different property tiers perform in Chiyoda City:
- Best-in-class properties (Top 10%) achieve 82%+ occupancy, indicating high desirability and potentially optimized availability.
- Strong performing properties (Top 25%) maintain 77% or higher occupancy, suggesting good market fit and guest satisfaction.
- Typical properties (Median) have an occupancy rate around 66%.
- Entry-level properties (Bottom 25%) average 51% occupancy, potentially facing higher vacancy.
Average Monthly Occupancy Rate Trend in Chiyoda City
Average Daily Rate (ADR) Airbnb Trends in Chiyoda City (2026)
Effective short term rental pricing strategy in Chiyoda City involves understanding monthly ADR fluctuations. The Average Daily Rate (ADR) for Airbnb in Chiyoda City typically peaks in December and dips lowest during August. Leveraging Airbnb dynamic pricing tools or strategies based on this seasonality can significantly boost revenue. Here's a look at the typical nightly rates achieved:
- Best-in-class properties (Top 10%) command rates of $264+ per night, often due to premium features or locations.
- Strong performing properties (Top 25%) achieve nightly rates of $217 or more.
- Typical properties (Median) charge around $157 per night.
- Entry-level properties (Bottom 25%) earn around $107 per night.
Average Daily Rate (ADR) Trend by Month in Chiyoda City
Get Live Chiyoda City Market Intelligence 👇
Explore Real-time Analytics
Airbnb Seasonality Analysis & Trends in Chiyoda City (2026)
Peak Season (December, October, November)
- Revenue averages $4,676 per month
- Occupancy rates average 80.0%
- Daily rates average $192
Shoulder Season
- Revenue averages $2,575 per month
- Occupancy maintains around 53.7%
- Daily rates hold near $162
Low Season (February, March, April)
- Revenue drops to average $0 per month
- Occupancy decreases to average 0.0%
- Daily rates adjust to average $162
Seasonality Insights for Chiyoda City
- The Airbnb seasonality in Chiyoda City shows highly seasonal trends requiring careful strategy. While the sections above show seasonal averages, it's also insightful to look at the extremes:
- During the high season, the absolute peak month showcases Chiyoda City's highest earning potential, with monthly revenues capable of climbing to $4,803, occupancy reaching a high of 83.4%, and ADRs peaking at $204.
- Conversely, the slowest single month of the year, typically falling within the low season, marks the market's lowest point. In this month, revenue might dip to $0, occupancy could drop to 0.0%, and ADRs may adjust down to $150.
- Understanding both the seasonal averages and these monthly peaks and troughs in revenue, occupancy, and ADR is crucial for maximizing your Airbnb profit potential in Chiyoda City.
Seasonal Strategies for Maximizing Profit
- Peak Season: Maximize revenue through premium pricing and potentially longer minimum stays. Ensure high availability.
- Low Season: Offer competitive pricing, special promotions (e.g., extended stay discounts), and flexible cancellation policies. Target off-season travelers like remote workers or budget-conscious guests.
- Shoulder Seasons: Implement dynamic pricing that balances peak and low rates. Target weekend travelers or specific events. Offer slightly more flexible terms than peak season.
- Regularly analyze your own performance against these Chiyoda City seasonality benchmarks and adjust your pricing and availability strategy accordingly.
Best Areas for Airbnb Investment in Chiyoda City (2026)
Exploring the top neighborhoods for short-term rentals in Chiyoda City? This section highlights key areas, outlining why they are attractive for hosts and guests, along with notable local attractions. Consider these locations based on your target guest profile and investment strategy.
| Neighborhood / Area | Why Host Here? (Target Guests & Appeal) | Key Attractions & Landmarks |
|---|---|---|
| Akihabara | Famous for its electronics shops and as a bustling otaku culture center. Ideal for attracting tourists interested in anime, manga, and technology. | Akihabara Electric Town, Manga and Anime Shops, Kanda Myojin Shrine, Maid Cafes, Gaming Centers |
| Ochanomizu | A charming area known for its guitar shops and proximity to universities. Great for music lovers and students looking for a cozy stay in Tokyo. | Bunkyo Civic Center, Yasukuni Shrine, Ochanomizu's Guitar Street, Shinobazu Pond |
| Hibiya | Central business district with beautiful parks and historic sites. Provides a balance between leisure and business for guests. | Hibiya Park, Imperial Palace, Tokyo Tower, Tokyo Midtown, Ginza shopping district |
| Marunouchi | Tokyo's commercial core, just outside the Imperial Palace. Attracts business travelers and tourists seeking luxury amenities. | Tokyo Station, Marunouchi Building, Imperial Palace East Gardens, Nihonbashi |
| Kudanshita | Home to historic landmarks and easy access to several train lines, it's a strategic location for tourists exploring Tokyo. | Yasukuni Shrine, Chidorigafuchi, Historical Document Archives, Shoukanraku Park |
| Otemachi | The heart of Tokyo's financial district with many corporate offices and close proximity to major attractions, great for short-term rentals. | Tokyo Financial City, Kitanomaru Park, National Museum of Modern Art Tokyo |
| Nihonbashi | A historic area known for its shopping and cuisine, appealing to tourists and business travelers alike. | Nihonbashi Bridge, Coredo Muromachi, Fukutoku Shrine, Tokyo Stock Exchange |
| Yurakucho | An entertainment hub with theaters and restaurants, ideal for tourists looking for nightlife and cultural experiences in Tokyo. | Yurakucho Gado-shita Dining Street, Tokyo Theater, Marunouchi Brick Square |
Understanding Airbnb License Requirements & STR Laws in Chiyoda City (2026)
Yes, Chiyoda City, Tokyo Prefecture, Japan enforces high STR regulations. Obtaining a license and ensuring compliance is almost certainly required according to current 2026 STR laws. Always verify the latest short term rental regulations and Airbnb license requirements directly with local government authorities for Chiyoda City to ensure full compliance before hosting.
(Source: AirROI data, 2026, based on 100% licensed listings)
Top Performing Airbnb Properties in Chiyoda City (2026)
Benchmark your potential! Explore examples of top-performing Airbnb properties in Chiyoda Citybased on Trailing Twelve Month (TTM) revenue. Analyze their characteristics, revenue, occupancy rate, and ADR to understand what drives success in this market.
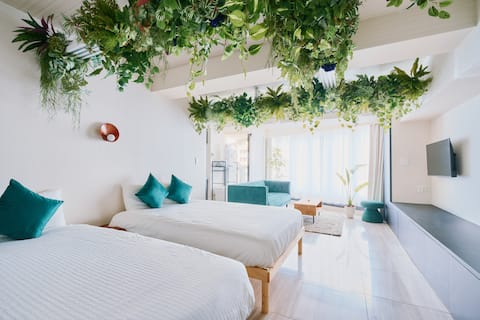
『5 min from Kanda St. 』Luxurious Living Sukumo 11F
Entire Place • 1 bedroom
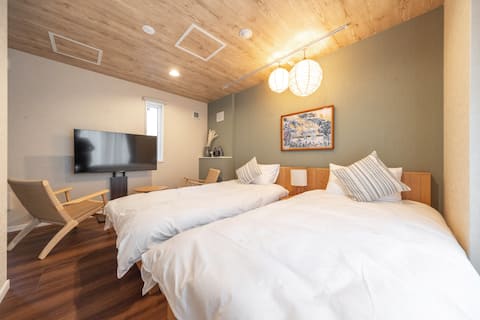
5F/ OPEN SALE! Stylish Stay near Akihabara
Entire Place • 2 bedrooms
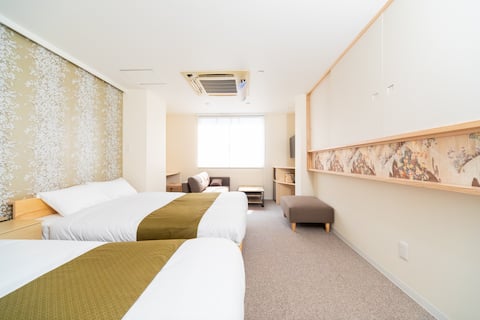
Near Akihabara・Ueno|Cherry blossom&Japanese style
Entire Place • 1 bedroom
![[New opening] 3-minute walk from Akihabara!Luxurious full renovation](https://a0.muscache.com/im/pictures/miso/Hosting-1394787459418128382/original/304b57f3-2e4d-434c-b770-1b67190e3859.jpeg?im_w=480&im_format=avif)
[New opening] 3-minute walk from Akihabara!Luxurious full renovation
Entire Place • 2 bedrooms
Near Akihabara・Ueno|Cherry blossom&Japanese style
Entire Place • 1 bedroom
![[New opening] 3-minute walk from Akihabara!Luxury Full Renovation # 405](https://a0.muscache.com/im/pictures/hosting/Hosting-U3RheVN1cHBseUxpc3Rpbmc6MTM5NDc3NDg4NTkzNzc4OTQ4Nw==/original/cbb5c45b-f374-4090-8939-5b18265ca101.jpeg?im_w=480&im_format=avif)
[New opening] 3-minute walk from Akihabara!Luxury Full Renovation # 405
Entire Place • 2 bedrooms
Note: Performance varies based on location, size, amenities, seasonality, and management quality. Data reflects the past 12 months.
Top Performing Airbnb Hosts in Chiyoda City (2026)
Learn from the best! This table showcases top-performing Airbnb hosts in Chiyoda City based on the number of properties managed and estimated total revenue over the past year. Analyze their scale and performance metrics.
| Host Name | Properties | Grossing Revenue | Stay Reviews | Avg Rating |
|---|---|---|---|---|
| Shigeru | 7 | $251,885 | 125 | 4.87/5.0 |
| Core Hotel | 7 | $234,327 | 169 | 4.92/5.0 |
| Tommy | 7 | $134,744 | 151 | 4.81/5.0 |
| Keiko | 7 | $100,188 | 33 | 4.89/5.0 |
| Phoenix | 3 | $90,869 | 60 | 4.93/5.0 |
| Omotenashi-Stay | 2 | $88,498 | 83 | 4.93/5.0 |
| Wherely | 1 | $51,761 | 16 | 4.94/5.0 |
| Mori | 2 | $36,253 | 9 | 4.67/5.0 |
| Miki | 1 | $35,730 | 9 | 4.67/5.0 |
| Ray | 1 | $31,466 | 24 | 4.96/5.0 |
Analyzing the strategies of top hosts, such as their property selection, pricing, and guest communication, can offer valuable lessons for optimizing your own Airbnb operations in Chiyoda City.
Dive Deeper: Advanced Chiyoda City STR Market Data (2026)
Ready to unlock more insights? AirROI provides access to advanced metrics and comprehensive Airbnb data for Chiyoda City. Explore detailed analytics beyond this report to refine your investment strategy, optimize pricing, and maximize your vacation rental profits.
Explore Advanced MetricsChiyoda City Short-Term Rental Market Composition (2026): Property & Room Types
Room Type Distribution
Property Type Distribution
Market Composition Insights for Chiyoda City
- The Chiyoda City Airbnb market composition is heavily skewed towards Entire Home/Apt listings, which make up 86.8% of the 38 active rentals. This indicates strong guest preference for privacy and space.
- Looking at the property type distribution in Chiyoda City, Apartment/Condo properties are the most common (89.5%), reflecting the local real estate landscape.
- The presence of 10.5% Hotel/Boutique listings indicates integration with traditional hospitality.
Chiyoda City Airbnb Room Capacity Analysis (2026): Bedroom Distribution
Distribution of Listings by Number of Bedrooms
Room Capacity Insights for Chiyoda City
- The dominant room capacity in Chiyoda City is 1 bedroom listings, making up 71.1% of the market. This suggests a strong demand for properties suitable for couples or solo travelers.
- Together, 1 bedroom and 2 bedrooms properties represent 84.3% of the active Airbnb listings in Chiyoda City, indicating a high concentration in these sizes.
- With over half the market (71.1%) consisting of studios or 1-bedroom units, Chiyoda City is particularly well-suited for individuals or couples.
Chiyoda City Vacation Rental Guest Capacity Trends (2026)
Distribution of Listings by Guest Capacity
Guest Capacity Insights for Chiyoda City
- The most common guest capacity trend in Chiyoda City vacation rentals is listings accommodating 2 guests (39.5%). This suggests the primary traveler segment is likely couples or solo travelers.
- Properties designed for 2 guests and 5 guests dominate the Chiyoda City STR market, accounting for 57.9% of listings.
- 15.8% of properties accommodate 6+ guests, serving the market segment for larger families or group travel in Chiyoda City.
- On average, properties in Chiyoda City are equipped to host 3.6 guests.
Chiyoda City Airbnb Booking Patterns (2026): Available vs. Booked Days
Available Days Distribution
Booked Days Distribution
Booking Pattern Insights for Chiyoda City
- The most common availability pattern in Chiyoda City falls within the 91-180 days range, representing 47.4% of listings. This suggests many properties have significant open periods on their calendars.
- Approximately 52.6% of listings show high availability (181+ days open annually), indicating potential for increased bookings or specific owner usage patterns.
- For booked days, the 181-270 days range is most frequent in Chiyoda City (47.4%), reflecting common guest stay durations or potential owner blocking patterns.
- A notable 47.4% of properties secure long booking periods (181+ days booked per year), highlighting successful long-term rental strategies or significant owner usage.
Chiyoda City Airbnb Minimum Stay Requirements Analysis
Distribution of Listings by Minimum Night Requirement
1 Night
25 listings
65.8% of total
2 Nights
2 listings
5.3% of total
3 Nights
2 listings
5.3% of total
30+ Nights
9 listings
23.7% of total
Key Insights
- The most prevalent minimum stay requirement in Chiyoda City is 1 Night, adopted by 65.8% of listings. This highlights the market's preference for shorter, flexible bookings.
- A strong majority (71.1%) of the Chiyoda City Airbnb data shows acceptance of very short stays (1-2 nights), indicating a dynamic, high-turnover market.
- A significant segment (23.7%) caters to monthly stays (30+ nights) in Chiyoda City, pointing to opportunities in the extended-stay market.
Recommendations
- Align with the market by considering a 1 Night minimum stay, as 65.8% of Chiyoda City hosts use this setting.
- Explore offering discounts for stays of 30+ nights to attract the 23.7% of the market seeking extended stays.
- Adjust minimum nights based on seasonality – potentially shorter during low season and longer during peak demand periods in Chiyoda City.
Chiyoda City Airbnb Cancellation Policy Trends Analysis (2026)
Limited
1 listings
2.6% of total
Flexible
3 listings
7.9% of total
Moderate
6 listings
15.8% of total
Firm
10 listings
26.3% of total
Strict
18 listings
47.4% of total
Cancellation Policy Insights for Chiyoda City
- The prevailing Airbnb cancellation policy trend in Chiyoda City is Strict, used by 47.4% of listings.
- A majority (73.7%) of hosts in Chiyoda City utilize Firm or Strict policies, indicating a market where hosts prioritize booking security.
Recommendations for Hosts
- Consider adopting a Strict policy to align with the 47.4% market standard in Chiyoda City.
- With 47.4% using Strict terms, this is a viable option in Chiyoda City, particularly for high-value properties or during peak demand periods.
- Regularly review your cancellation policy against competitors and market demand shifts in Chiyoda City.
Chiyoda City STR Booking Lead Time Analysis (2026)
Average Booking Lead Time by Month
Booking Lead Time Insights for Chiyoda City
- The overall average booking lead time for vacation rentals in Chiyoda City is 47 days.
- Guests book furthest in advance for stays during December (average 84 days), likely coinciding with peak travel demand or local events.
- The shortest booking windows occur for stays in April (average 0 days), indicating more last-minute travel plans during this time.
- Seasonally, Fall (67 days avg.) sees the longest lead times, while Spring (0 days avg.) has the shortest, reflecting typical travel planning cycles.
Recommendations for Hosts
- Use the overall average lead time (47 days) as a baseline for your pricing and availability strategy in Chiyoda City.
- For December stays, consider implementing length-of-stay discounts or slightly higher rates for bookings made less than 84 days out to capitalize on advance planning.
- During April, focus on last-minute booking availability and promotions, as guests book with very short notice (0 days avg.).
- Target marketing efforts for the Fall season well in advance (at least 67 days) to capture early planners.
- Monitor your own booking lead times against these Chiyoda City averages to identify opportunities for dynamic pricing adjustments.
Popular & Essential Airbnb Amenities in Chiyoda City (2026)
Amenity Prevalence
Amenity Insights for Chiyoda City
- Essential amenities in Chiyoda City that guests expect include: Air conditioning, Smoke alarm, Fire extinguisher, Wifi. Lacking these (any) could significantly impact bookings.
- Popular amenities like Shampoo, Microwave, Bed linens are common but not universal. Offering these can provide a competitive edge.
Recommendations for Hosts
- Ensure your listing includes all essential amenities for Chiyoda City: Air conditioning, Smoke alarm, Fire extinguisher, Wifi.
- Consider adding popular differentiators like Shampoo or Microwave to increase appeal.
- Highlight unique or less common amenities you offer (e.g., hot tub, dedicated workspace, EV charger) in your listing description and photos.
- Regularly check competitor amenities in Chiyoda City to stay competitive.
Chiyoda City Airbnb Guest Demographics & Profile Analysis (2026)
Guest Profile Summary for Chiyoda City
- The typical guest profile for Airbnb in Chiyoda City consists of predominantly international visitors (97%), with top international origins including Canada, typically belonging to the Post-2000s (Gen Z/Alpha) group (50%), primarily speaking English or Chinese.
- Domestic travelers account for 3.0% of guests.
- Key international markets include United States (24.2%) and Canada (8.7%).
- Top languages spoken are English (46.1%) followed by Chinese (11.6%).
- A significant demographic segment is the Post-2000s (Gen Z/Alpha) group, representing 50% of guests.
Recommendations for Hosts
- Focus marketing internationally, particularly towards travelers from Canada.
- Tailor amenities and listing descriptions to appeal to the dominant Post-2000s (Gen Z/Alpha) demographic (e.g., highlight fast WiFi, smart home features, local guides).
- Highlight unique local experiences or amenities relevant to the primary guest profile.
- Consider seasonal promotions aligned with peak travel times for key origin markets.
Nearby Short-Term Rental Market Comparison
How does the Chiyoda City Airbnb market stack up against its neighbors? Compare key performance metrics like average monthly revenue, ADR, and occupancy rates in surrounding areas to understand the broader regional STR landscape.
| Market | Active Properties | Monthly Revenue | Daily Rate | Avg. Occupancy |
|---|---|---|---|---|
| Shinagawa City | 50 | $7,769 | $428.93 | 62% |
| Futtsu | 31 | $5,187 | $369.80 | 44% |
| Kyonan | 15 | $5,099 | $419.89 | 42% |
| Adachi City | 47 | $4,752 | $301.69 | 50% |
| Kita | 15 | $4,563 | $305.24 | 57% |
| Shirako | 22 | $4,439 | $359.94 | 34% |
| Nagatoro | 10 | $4,035 | $249.70 | 52% |
| Kamogawa | 36 | $4,007 | $296.27 | 37% |
| Hakone | 335 | $3,905 | $289.84 | 48% |
| Karuizawa | 121 | $3,852 | $396.31 | 39% |