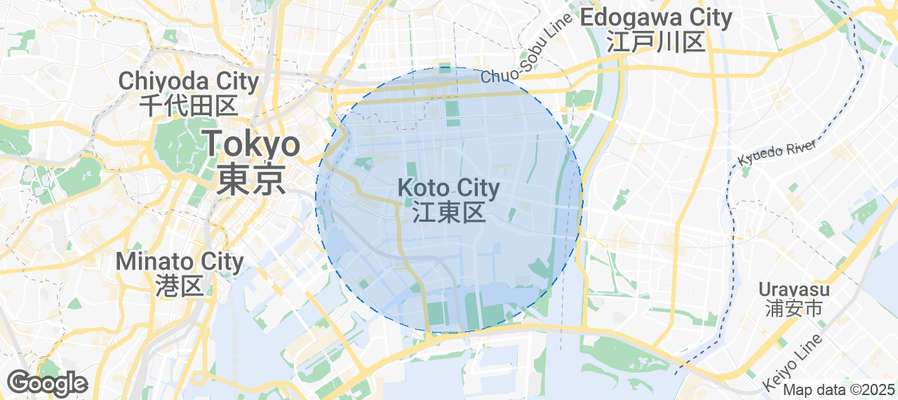
Koto City Airbnb Market Analysis 2026: Short Term Rental Data & Vacation Rental Statistics in Tokyo Prefecture, Japan
Is Airbnb profitable in Koto City in 2026? Explore comprehensive Airbnb analytics for Koto City, Tokyo Prefecture, Japan to uncover income potential. This 2026 STR market report for Koto City, based on AirROI data from February 2025 to January 2026, reveals key trends in the niche market of 51 active listings.
Whether you're considering an Airbnb investment in Koto City, optimizing your existing vacation rental, or exploring rental arbitrage opportunities, understanding the Koto City Airbnb data is crucial. Navigating the high regulation landscape is key to maximizing your short term rental income potential. Let's dive into the specifics.
Key Koto City Airbnb Performance Metrics Overview
Monthly Airbnb Revenue Variations & Income Potential in Koto City (2026)
Understanding the monthly revenue variations for Airbnb listings in Koto City is key to maximizing your short term rental income potential. Seasonality significantly impacts earnings. Our analysis, based on data from the past 12 months, shows that the peak revenue month for STRs in Koto City is typically October, while May often presents the lowest earnings, highlighting opportunities for strategic pricing adjustments during shoulder and low seasons. Explore the typical Airbnb income in Koto City across different performance tiers:
- Best-in-class properties (Top 10%) achieve $5,722+ monthly, often utilizing dynamic pricing and superior guest experiences.
- Strong performing properties (Top 25%) earn $3,450 or more, indicating effective management and desirable locations/amenities.
- Typical properties (Median) generate around $1,922 per month, representing the average market performance.
- Entry-level properties (Bottom 25%) see earnings around $846, often with potential for optimization.
Average Monthly Airbnb Earnings Trend in Koto City
Koto City Airbnb Occupancy Rate Trends (2026)
Maximize your bookings by understanding the Koto City STR occupancy trends. Seasonal demand shifts significantly influence how often properties are booked. Typically, Novembersees the highest demand (peak season occupancy), while May experiences the lowest (low season). Effective strategies, like adjusting minimum stays or offering promotions, can boost occupancy during slower periods. Here's how different property tiers perform in Koto City:
- Best-in-class properties (Top 10%) achieve 82%+ occupancy, indicating high desirability and potentially optimized availability.
- Strong performing properties (Top 25%) maintain 74% or higher occupancy, suggesting good market fit and guest satisfaction.
- Typical properties (Median) have an occupancy rate around 60%.
- Entry-level properties (Bottom 25%) average 35% occupancy, potentially facing higher vacancy.
Average Monthly Occupancy Rate Trend in Koto City
Average Daily Rate (ADR) Airbnb Trends in Koto City (2026)
Effective short term rental pricing strategy in Koto City involves understanding monthly ADR fluctuations. The Average Daily Rate (ADR) for Airbnb in Koto City typically peaks in December and dips lowest during August. Leveraging Airbnb dynamic pricing tools or strategies based on this seasonality can significantly boost revenue. Here's a look at the typical nightly rates achieved:
- Best-in-class properties (Top 10%) command rates of $273+ per night, often due to premium features or locations.
- Strong performing properties (Top 25%) achieve nightly rates of $169 or more.
- Typical properties (Median) charge around $106 per night.
- Entry-level properties (Bottom 25%) earn around $80 per night.
Average Daily Rate (ADR) Trend by Month in Koto City
Get Live Koto City Market Intelligence 👇
Explore Real-time Analytics
Airbnb Seasonality Analysis & Trends in Koto City (2026)
Peak Season (October, December, November)
- Revenue averages $3,258 per month
- Occupancy rates average 65.9%
- Daily rates average $153
Shoulder Season
- Revenue averages $2,164 per month
- Occupancy maintains around 47.8%
- Daily rates hold near $130
Low Season (February, March, April)
- Revenue drops to average $0 per month
- Occupancy decreases to average 0.0%
- Daily rates adjust to average $130
Seasonality Insights for Koto City
- The Airbnb seasonality in Koto City shows highly seasonal trends requiring careful strategy. While the sections above show seasonal averages, it's also insightful to look at the extremes:
- During the high season, the absolute peak month showcases Koto City's highest earning potential, with monthly revenues capable of climbing to $3,292, occupancy reaching a high of 70.0%, and ADRs peaking at $162.
- Conversely, the slowest single month of the year, typically falling within the low season, marks the market's lowest point. In this month, revenue might dip to $0, occupancy could drop to 0.0%, and ADRs may adjust down to $117.
- Understanding both the seasonal averages and these monthly peaks and troughs in revenue, occupancy, and ADR is crucial for maximizing your Airbnb profit potential in Koto City.
Seasonal Strategies for Maximizing Profit
- Peak Season: Maximize revenue through premium pricing and potentially longer minimum stays. Ensure high availability.
- Low Season: Offer competitive pricing, special promotions (e.g., extended stay discounts), and flexible cancellation policies. Target off-season travelers like remote workers or budget-conscious guests.
- Shoulder Seasons: Implement dynamic pricing that balances peak and low rates. Target weekend travelers or specific events. Offer slightly more flexible terms than peak season.
- Regularly analyze your own performance against these Koto City seasonality benchmarks and adjust your pricing and availability strategy accordingly.
Best Areas for Airbnb Investment in Koto City (2026)
Exploring the top neighborhoods for short-term rentals in Koto City? This section highlights key areas, outlining why they are attractive for hosts and guests, along with notable local attractions. Consider these locations based on your target guest profile and investment strategy.
| Neighborhood / Area | Why Host Here? (Target Guests & Appeal) | Key Attractions & Landmarks |
|---|---|---|
| Koto Ward | Koto Ward is a vibrant area known for its blend of modern living and traditional culture. It offers easy access to central Tokyo, making it appealing for tourists and business travelers alike. | Tokyo Bay, Koto Park, Tocation, Toyosu Market, Uminari Park, Tokyo Joypolis |
| Odaiba | Odaiba is a futuristic man-made island which offers a unique blend of shopping, entertainment, and fantastic views of Tokyo. It's a popular area for families and tourists due to its attractions. | DiverCity Tokyo Plaza, Odaiba Seaside Park, Fuji TV Building, Miraikan, TeamLab Borderless, Palette Town |
| Ariake | Ariake is known for its large-scale event venues and proximity to Tokyo Big Sight. It's a strategic location for business travelers and exhibition attendees. | Tokyo Big Sight, Ariake Arena, Ariake Tennis Park, Tsukishima Monjya Street, Tokyo Water Science Museum, Ariake Garden |
| Kiba Park | Kiba Park is a spacious park area that offers various recreational facilities. It's a great place for those who enjoy nature and want a peaceful stay in the city. | Kiba Park, Kiba 1-chome Park, Tokyo Metro Museum, Tokyo Garden Theatre, Koto Ward Museum, Japanese horticultural parks |
| Sumiyoshi | Sumiyoshi is a charming neighborhood often overlooked by tourists. It has traditional restaurants and historical sites, which attract those looking for authentic experiences. | Sumiyoshi Shrine, Koto Ward Historical Museum, Eitai Bridge, sumiyoshi park, Yanagibashi Ramen Street, Sumiyoshi Riverside Park |
| Toyosu | Toyosu is a rapidly developing area known for its modern architecture and the famous Toyosu Market. It's attractive to food lovers and those interested in culinary experiences. | Toyosu Market, Toyosu Community Center, Toyosu Park, Shinonome Canal Court, Gundam Factory Yokohama, Umi-no-Nakagawa Park |
| Koto City Center (Kachidoki) | Kachidoki is a lively urban center that offers convenient access to shopping and entertainment, making it ideal for visitors looking for a bustling city atmosphere. | Kachidoki Bridge, Kachidoki Park, LaLaPorts Toyosu, Tokyo Bay Cruising, Kachidoki Tsukudajima Park, Tsukishima Monja Street |
| Eitai | Eitai is a scenic riverside area known for its beautiful views and tranquil walkways alongside the Sumida River, perfect for those wanting to relax near the water. | Eitai Bridge, Sumida River, Eitai Park, Ariake Garden, Kameido Tenjin Shrine, Tokyo Skytree |
Understanding Airbnb License Requirements & STR Laws in Koto City (2026)
Yes, Koto City, Tokyo Prefecture, Japan enforces high STR regulations. Obtaining a license and ensuring compliance is almost certainly required according to current 2026 STR laws. Always verify the latest short term rental regulations and Airbnb license requirements directly with local government authorities for Koto City to ensure full compliance before hosting.
(Source: AirROI data, 2026, based on 98% licensed listings)
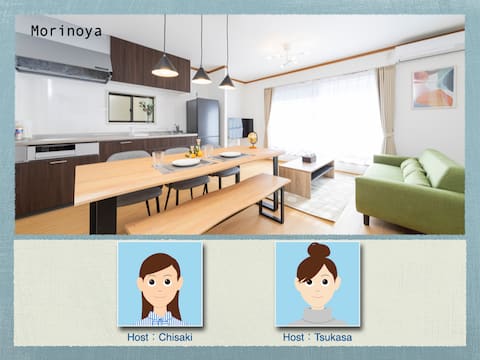
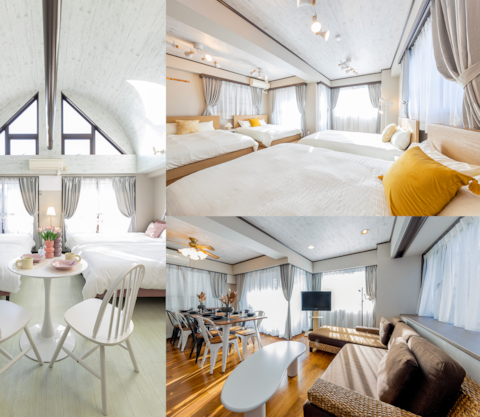
Top Performing Airbnb Properties in Koto City (2026)
Benchmark your potential! Explore examples of top-performing Airbnb properties in Koto Citybased on Trailing Twelve Month (TTM) revenue. Analyze their characteristics, revenue, occupancy rate, and ADR to understand what drives success in this market.
Ideal for family trips/ 4LDK private house
Entire Place • 4 bedrooms
146㎡ 4~18ppl / Private Urban Vacation Home/ Disney
Entire Place • 4 bedrooms
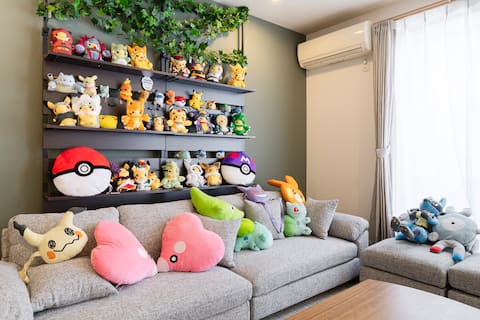
Monnaka Pocket Town/ぬいぐるみの宿/歴史ある神社近く/駅徒歩5分/100㎡
Entire Place • 4 bedrooms
Shibuya 26 minutes, Shinjuku 22 minutes, Skytree 5 minutes direct train/Comfortable for up to 8 peop
Private Room • 3 bedrooms
January Sale Only/90 m²/5 Bedrooms/Up to 14 People/Disney & Team Lab & Kidsania 15 Minutes/WiFi
Entire Place • 5 bedrooms
January-only sale/2-minute walk from the station/15 minutes to Disney, Tokyo Station, Ginza, and Tea
Entire Place • 2 bedrooms
Note: Performance varies based on location, size, amenities, seasonality, and management quality. Data reflects the past 12 months.
Top Performing Airbnb Hosts in Koto City (2026)
Learn from the best! This table showcases top-performing Airbnb hosts in Koto City based on the number of properties managed and estimated total revenue over the past year. Analyze their scale and performance metrics.
| Host Name | Properties | Grossing Revenue | Stay Reviews | Avg Rating |
|---|---|---|---|---|
| Ray | 2 | $106,567 | 98 | 4.84/5.0 |
| Eric | 3 | $86,886 | 162 | 4.92/5.0 |
| Chisaki | 1 | $66,212 | 35 | 4.94/5.0 |
| Zaito | 3 | $65,554 | 83 | 4.73/5.0 |
| Nico Coo | 1 | $63,270 | 24 | 4.92/5.0 |
| Masa | 1 | $60,992 | 42 | 4.93/5.0 |
| Kimiko | 1 | $60,255 | 40 | 4.83/5.0 |
| Hatago Ojima | 5 | $56,488 | 129 | 4.75/5.0 |
| Oishi | 9 | $38,025 | 174 | 4.45/5.0 |
| Lei | 1 | $37,578 | 25 | 4.84/5.0 |
Analyzing the strategies of top hosts, such as their property selection, pricing, and guest communication, can offer valuable lessons for optimizing your own Airbnb operations in Koto City.
Dive Deeper: Advanced Koto City STR Market Data (2026)
Ready to unlock more insights? AirROI provides access to advanced metrics and comprehensive Airbnb data for Koto City. Explore detailed analytics beyond this report to refine your investment strategy, optimize pricing, and maximize your vacation rental profits.
Explore Advanced MetricsKoto City Short-Term Rental Market Composition (2026): Property & Room Types
Room Type Distribution
Property Type Distribution
Market Composition Insights for Koto City
- The Koto City Airbnb market composition is heavily skewed towards Entire Home/Apt listings, which make up 80.4% of the 51 active rentals. This indicates strong guest preference for privacy and space.
- Looking at the property type distribution in Koto City, Apartment/Condo properties are the most common (64.7%), reflecting the local real estate landscape.
- Houses represent a significant 35.3% portion, catering likely to families or larger groups.
Koto City Airbnb Room Capacity Analysis (2026): Bedroom Distribution
Distribution of Listings by Number of Bedrooms
Room Capacity Insights for Koto City
- The dominant room capacity in Koto City is 1 bedroom listings, making up 49% of the market. This suggests a strong demand for properties suitable for couples or solo travelers.
- Together, 1 bedroom and 3 bedrooms properties represent 62.7% of the active Airbnb listings in Koto City, indicating a high concentration in these sizes.
- A significant 21.6% of listings offer 3+ bedrooms, catering to larger groups and families seeking more space in Koto City.
Koto City Vacation Rental Guest Capacity Trends (2026)
Distribution of Listings by Guest Capacity
Guest Capacity Insights for Koto City
- The most common guest capacity trend in Koto City vacation rentals is listings accommodating 4 guests (27.5%). This suggests the primary traveler segment is likely small families or groups.
- Properties designed for 4 guests and 8+ guests dominate the Koto City STR market, accounting for 47.1% of listings.
- 25.5% of properties accommodate 6+ guests, serving the market segment for larger families or group travel in Koto City.
- On average, properties in Koto City are equipped to host 3.9 guests.
Koto City Airbnb Booking Patterns (2026): Available vs. Booked Days
Available Days Distribution
Booked Days Distribution
Booking Pattern Insights for Koto City
- The most common availability pattern in Koto City falls within the 181-270 days range, representing 37.3% of listings. This suggests many properties have significant open periods on their calendars.
- Approximately 72.6% of listings show high availability (181+ days open annually), indicating potential for increased bookings or specific owner usage patterns.
- For booked days, the 181-270 days range is most frequent in Koto City (35.3%), reflecting common guest stay durations or potential owner blocking patterns.
- A notable 35.3% of properties secure long booking periods (181+ days booked per year), highlighting successful long-term rental strategies or significant owner usage.
Koto City Airbnb Minimum Stay Requirements Analysis
Distribution of Listings by Minimum Night Requirement
1 Night
10 listings
19.6% of total
2 Nights
18 listings
35.3% of total
7-29 Nights
5 listings
9.8% of total
30+ Nights
18 listings
35.3% of total
Key Insights
- The most prevalent minimum stay requirement in Koto City is 2 Nights, adopted by 35.3% of listings. This highlights the market's preference for shorter, flexible bookings.
- A significant segment (35.3%) caters to monthly stays (30+ nights) in Koto City, pointing to opportunities in the extended-stay market.
Recommendations
- Align with the market by considering a 2 Nights minimum stay, as 35.3% of Koto City hosts use this setting.
- If feasible, allowing 1-night stays, especially midweek or during low season, could capture last-minute bookings, as only 19.6% currently do.
- A 2-night minimum appears standard (35.3%). Consider this for weekends or peak periods.
- Explore offering discounts for stays of 30+ nights to attract the 35.3% of the market seeking extended stays.
- Adjust minimum nights based on seasonality – potentially shorter during low season and longer during peak demand periods in Koto City.
Koto City Airbnb Cancellation Policy Trends Analysis (2026)
Super Strict 30 Days
1 listings
2% of total
Limited
3 listings
5.9% of total
Super Strict 60 Days
4 listings
7.8% of total
Flexible
1 listings
2% of total
Moderate
10 listings
19.6% of total
Firm
29 listings
56.9% of total
Strict
3 listings
5.9% of total
Cancellation Policy Insights for Koto City
- The prevailing Airbnb cancellation policy trend in Koto City is Firm, used by 56.9% of listings.
- A majority (62.8%) of hosts in Koto City utilize Firm or Strict policies, indicating a market where hosts prioritize booking security.
- Strict cancellation policies are quite rare (5.9%), potentially making listings with this policy less competitive unless justified by high demand or property type.
Recommendations for Hosts
- Consider adopting a Firm policy to align with the 56.9% market standard in Koto City.
- Using a Strict policy might deter some guests, as only 5.9% of listings use it. Evaluate if potential revenue protection outweighs possible lower booking rates.
- Regularly review your cancellation policy against competitors and market demand shifts in Koto City.
Koto City STR Booking Lead Time Analysis (2026)
Average Booking Lead Time by Month
Booking Lead Time Insights for Koto City
- The overall average booking lead time for vacation rentals in Koto City is 38 days.
- Guests book furthest in advance for stays during December (average 58 days), likely coinciding with peak travel demand or local events.
- The shortest booking windows occur for stays in April (average 0 days), indicating more last-minute travel plans during this time.
- Seasonally, Fall (49 days avg.) sees the longest lead times, while Spring (0 days avg.) has the shortest, reflecting typical travel planning cycles.
Recommendations for Hosts
- Use the overall average lead time (38 days) as a baseline for your pricing and availability strategy in Koto City.
- For December stays, consider implementing length-of-stay discounts or slightly higher rates for bookings made less than 58 days out to capitalize on advance planning.
- During April, focus on last-minute booking availability and promotions, as guests book with very short notice (0 days avg.).
- Target marketing efforts for the Fall season well in advance (at least 49 days) to capture early planners.
- Monitor your own booking lead times against these Koto City averages to identify opportunities for dynamic pricing adjustments.
Popular & Essential Airbnb Amenities in Koto City (2026)
Amenity Prevalence
Amenity Insights for Koto City
- Essential amenities in Koto City that guests expect include: Air conditioning, Wifi. Lacking these (any) could significantly impact bookings.
- Popular amenities like Smoke alarm, Fire extinguisher, Washer are common but not universal. Offering these can provide a competitive edge.
Recommendations for Hosts
- Ensure your listing includes all essential amenities for Koto City: Air conditioning, Wifi.
- Consider adding popular differentiators like Smoke alarm or Fire extinguisher to increase appeal.
- Highlight unique or less common amenities you offer (e.g., hot tub, dedicated workspace, EV charger) in your listing description and photos.
- Regularly check competitor amenities in Koto City to stay competitive.
Koto City Airbnb Guest Demographics & Profile Analysis (2026)
Guest Profile Summary for Koto City
- The typical guest profile for Airbnb in Koto City consists of predominantly international visitors (91%), with top international origins including Japan, typically belonging to the Post-2000s (Gen Z/Alpha) group (50%), primarily speaking English or Spanish.
- Domestic travelers account for 8.9% of guests.
- Key international markets include United States (23.9%) and Japan (8.9%).
- Top languages spoken are English (44.7%) followed by Spanish (9.6%).
- A significant demographic segment is the Post-2000s (Gen Z/Alpha) group, representing 50% of guests.
Recommendations for Hosts
- Focus marketing internationally, particularly towards travelers from Japan.
- Tailor amenities and listing descriptions to appeal to the dominant Post-2000s (Gen Z/Alpha) demographic (e.g., highlight fast WiFi, smart home features, local guides).
- Highlight unique local experiences or amenities relevant to the primary guest profile.
- Consider seasonal promotions aligned with peak travel times for key origin markets.
Nearby Short-Term Rental Market Comparison
How does the Koto City Airbnb market stack up against its neighbors? Compare key performance metrics like average monthly revenue, ADR, and occupancy rates in surrounding areas to understand the broader regional STR landscape.
| Market | Active Properties | Monthly Revenue | Daily Rate | Avg. Occupancy |
|---|---|---|---|---|
| Shinagawa City | 50 | $7,769 | $428.93 | 62% |
| Futtsu | 31 | $5,187 | $369.80 | 44% |
| Kyonan | 15 | $5,099 | $419.89 | 42% |
| Adachi City | 47 | $4,752 | $301.69 | 50% |
| Kita | 15 | $4,563 | $305.24 | 57% |
| Shirako | 22 | $4,439 | $359.94 | 34% |
| Nagatoro | 10 | $4,035 | $249.70 | 52% |
| Kamogawa | 36 | $4,007 | $296.27 | 37% |
| Hakone | 335 | $3,905 | $289.84 | 48% |
| Karuizawa | 121 | $3,852 | $396.31 | 39% |