Shinagawa City Airbnb Market Analysis 2026: Short Term Rental Data & Vacation Rental Statistics in Tokyo Prefecture, Japan
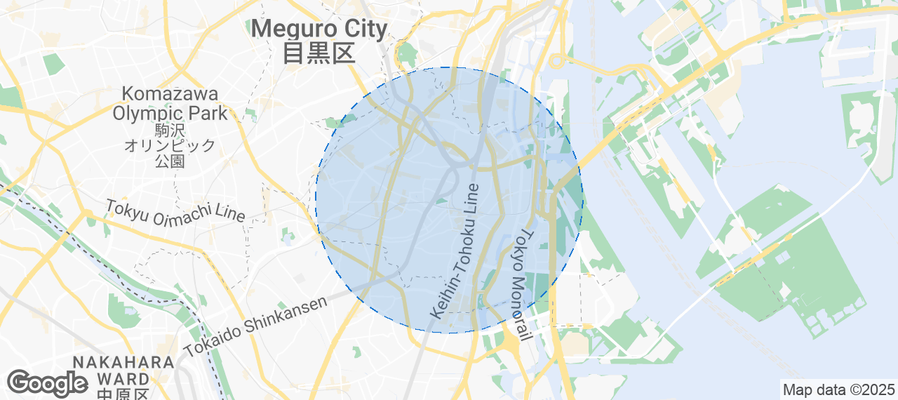
Is Airbnb profitable in Shinagawa City in 2026? Explore comprehensive Airbnb analytics for Shinagawa City, Tokyo Prefecture, Japan to uncover income potential. This 2026 STR market report for Shinagawa City, based on AirROI data from February 2025 to January 2026, reveals key trends in the niche market of 50 active listings.
Whether you're considering an Airbnb investment in Shinagawa City, optimizing your existing vacation rental, or exploring rental arbitrage opportunities, understanding the Shinagawa City Airbnb data is crucial. Navigating the high regulation landscape is key to maximizing your short term rental income potential. Let's dive into the specifics.
Key Shinagawa City Airbnb Performance Metrics Overview
Monthly Airbnb Revenue Variations & Income Potential in Shinagawa City (2026)
Understanding the monthly revenue variations for Airbnb listings in Shinagawa City is key to maximizing your short term rental income potential. Seasonality significantly impacts earnings. Our analysis, based on data from the past 12 months, shows that the peak revenue month for STRs in Shinagawa City is typically October, while May often presents the lowest earnings, highlighting opportunities for strategic pricing adjustments during shoulder and low seasons. Explore the typical Airbnb income in Shinagawa City across different performance tiers:
- Best-in-class properties (Top 10%) achieve $31,653+ monthly, often utilizing dynamic pricing and superior guest experiences.
- Strong performing properties (Top 25%) earn $17,241 or more, indicating effective management and desirable locations/amenities.
- Typical properties (Median) generate around $3,292 per month, representing the average market performance.
- Entry-level properties (Bottom 25%) see earnings around $1,978, often with potential for optimization.
Average Monthly Airbnb Earnings Trend in Shinagawa City
Shinagawa City Airbnb Occupancy Rate Trends (2026)
Maximize your bookings by understanding the Shinagawa City STR occupancy trends. Seasonal demand shifts significantly influence how often properties are booked. Typically, Octobersees the highest demand (peak season occupancy), while May experiences the lowest (low season). Effective strategies, like adjusting minimum stays or offering promotions, can boost occupancy during slower periods. Here's how different property tiers perform in Shinagawa City:
- Best-in-class properties (Top 10%) achieve 78%+ occupancy, indicating high desirability and potentially optimized availability.
- Strong performing properties (Top 25%) maintain 70% or higher occupancy, suggesting good market fit and guest satisfaction.
- Typical properties (Median) have an occupancy rate around 61%.
- Entry-level properties (Bottom 25%) average 46% occupancy, potentially facing higher vacancy.
Average Monthly Occupancy Rate Trend in Shinagawa City
Average Daily Rate (ADR) Airbnb Trends in Shinagawa City (2026)
Effective short term rental pricing strategy in Shinagawa City involves understanding monthly ADR fluctuations. The Average Daily Rate (ADR) for Airbnb in Shinagawa City typically peaks in August and dips lowest during April. Leveraging Airbnb dynamic pricing tools or strategies based on this seasonality can significantly boost revenue. Here's a look at the typical nightly rates achieved:
- Best-in-class properties (Top 10%) command rates of $1,172+ per night, often due to premium features or locations.
- Strong performing properties (Top 25%) achieve nightly rates of $837 or more.
- Typical properties (Median) charge around $157 per night.
- Entry-level properties (Bottom 25%) earn around $103 per night.
Average Daily Rate (ADR) Trend by Month in Shinagawa City
Get Live Shinagawa City Market Intelligence 👇
Explore Real-time Analytics
Airbnb Seasonality Analysis & Trends in Shinagawa City (2026)
Peak Season (October, September, August)
- Revenue averages $17,687 per month
- Occupancy rates average 69.0%
- Daily rates average $748
Shoulder Season
- Revenue averages $7,733 per month
- Occupancy maintains around 59.9%
- Daily rates hold near $418
Low Season (March, April, May)
- Revenue drops to average $162 per month
- Occupancy decreases to average 3.7%
- Daily rates adjust to average $137
Seasonality Insights for Shinagawa City
- The Airbnb seasonality in Shinagawa City shows highly seasonal trends requiring careful strategy. While the sections above show seasonal averages, it's also insightful to look at the extremes:
- During the high season, the absolute peak month showcases Shinagawa City's highest earning potential, with monthly revenues capable of climbing to $18,533, occupancy reaching a high of 77.3%, and ADRs peaking at $839.
- Conversely, the slowest single month of the year, typically falling within the low season, marks the market's lowest point. In this month, revenue might dip to $0, occupancy could drop to 0.0%, and ADRs may adjust down to $124.
- Understanding both the seasonal averages and these monthly peaks and troughs in revenue, occupancy, and ADR is crucial for maximizing your Airbnb profit potential in Shinagawa City.
Seasonal Strategies for Maximizing Profit
- Peak Season: Maximize revenue through premium pricing and potentially longer minimum stays. Ensure high availability.
- Low Season: Offer competitive pricing, special promotions (e.g., extended stay discounts), and flexible cancellation policies. Target off-season travelers like remote workers or budget-conscious guests.
- Shoulder Seasons: Implement dynamic pricing that balances peak and low rates. Target weekend travelers or specific events. Offer slightly more flexible terms than peak season.
- Regularly analyze your own performance against these Shinagawa City seasonality benchmarks and adjust your pricing and availability strategy accordingly.
Best Areas for Airbnb Investment in Shinagawa City (2026)
Exploring the top neighborhoods for short-term rentals in Shinagawa City? This section highlights key areas, outlining why they are attractive for hosts and guests, along with notable local attractions. Consider these locations based on your target guest profile and investment strategy.
| Neighborhood / Area | Why Host Here? (Target Guests & Appeal) | Key Attractions & Landmarks |
|---|---|---|
| Shinagawa Station | A major transport hub in Tokyo, Shinagawa Station offers easy access to both local and international travel. The area is convenient for business travelers and tourists, making it ideal for Airbnb hosting. | Shinagawa Aquarium, Hara Museum of Contemporary Art, Ohsaki New City, Tennozu Isle, Shinagawa Goos, Takanawa Gateway |
| Gotanda | Gotanda is an up-and-coming area with a vibrant nightlife and many dining options. It's also close to the business districts of Shinagawa and Shibuya, appealing to corporate guests. | Tokyu Theatre Orb, Gotanda Onsen, Nihondo Kampo, Shinagawa Guchi, Mizuno Shrine |
| Kitashinagawa | This area features a mix of residential and commercial developments with easy access to Tokyo Bay. It's attractive to those looking for a quieter alternative while still being close to the city center. | Shinagawa Historical Museum, Koyasu Shrine, Prince Shore Hitachi , Tokyo Bay Aqua-Line, Shinagawa Seaside Park |
| Shinagawa Seaside | A waterfront area that offers beautiful views and recreational opportunities. It's attractive for leisure travelers and those interested in outdoor activities. | Shinagawa Seaside Park, Tokyo Bay, Aqua Park Shinagawa, Daiba, Palette Town |
| Takanawa | This upscale neighborhood features luxury hotels and residential buildings. It is popular among affluent travelers looking for a comfortable and prestigious stay. | Shinagawa Palace Hotel, Shinagawa Shrine, Takanawa Gateway Station, Kyu Shinagawa Onsen |
| Osaki | A lively area with shopping malls and parks, Osaki is convenient for both tourists and business travelers. It offers a mix of leisure and professional environments. | Gotanda Onsen, Osaki New City Shopping Complex, Nihondo Kampo, Osaki Park |
| Ebara | A quieter residential area that provides a local experience. Ebara is suitable for guests looking to experience everyday life in Tokyo while remaining close to urban amenities. | Ebara Shrine, Ebara Park, Local supermarkets and shopping |
| Shinagawa Ward | The entire Shinagawa Ward has a lot of attractions and is progressively becoming more popular among tourists and travelers. It has a mix of modern and traditional experiences. | Shinagawa Shrine, Shinagawa Aquarium, Hara Museum, Tokyo Bay |
Understanding Airbnb License Requirements & STR Laws in Shinagawa City (2026)
Yes, Shinagawa City, Tokyo Prefecture, Japan enforces high STR regulations. Obtaining a license and ensuring compliance is almost certainly required according to current 2026 STR laws. Always verify the latest short term rental regulations and Airbnb license requirements directly with local government authorities for Shinagawa City to ensure full compliance before hosting.
(Source: AirROI data, 2026, based on 100% licensed listings)
Top Performing Airbnb Properties in Shinagawa City (2026)
Benchmark your potential! Explore examples of top-performing Airbnb properties in Shinagawa Citybased on Trailing Twelve Month (TTM) revenue. Analyze their characteristics, revenue, occupancy rate, and ADR to understand what drives success in this market.

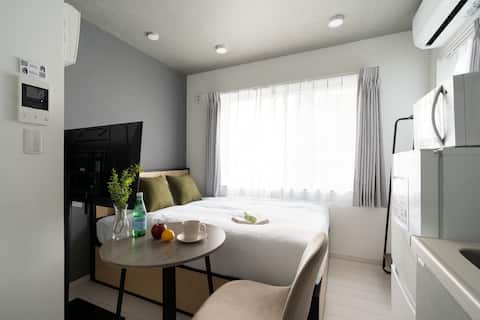
4-minute walk from the station / White-toned fashionable space / Comfortable stay in a 2024 building
Entire Place • 1 bedroom
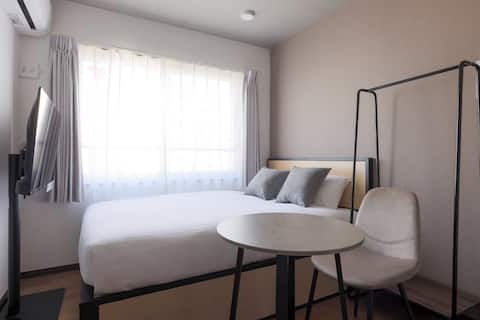
4-minute walk from the station / White-toned fashionable space / Comfortable stay in a 2024 building
Entire Place • 1 bedroom
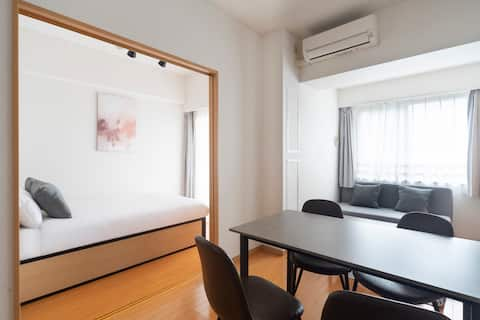
4-minute walk from the station / White-toned fashionable space / Comfortable stay in a 2024 building
Entire Place • 1 bedroom
8 minutes walk from the station!/b04
Entire Place • 1 bedroom
8 minutes walk from the station!/d03
Entire Place • 1 bedroom
4-minute walk from the station / White-toned fashionable space / Comfortable stay in a 2024 building
Entire Place • 1 bedroom
Note: Performance varies based on location, size, amenities, seasonality, and management quality. Data reflects the past 12 months.
Top Performing Airbnb Hosts in Shinagawa City (2026)
Learn from the best! This table showcases top-performing Airbnb hosts in Shinagawa City based on the number of properties managed and estimated total revenue over the past year. Analyze their scale and performance metrics.
| Host Name | Properties | Grossing Revenue | Stay Reviews | Avg Rating |
|---|---|---|---|---|
| Sumyca | 13 | $3,077,021 | 183 | 4.60/5.0 |
| Sumyca Tokyo | 4 | $809,917 | 75 | 4.66/5.0 |
| 大介 | 3 | $71,187 | 105 | 4.71/5.0 |
| Hiro | 6 | $68,800 | 106 | 4.68/5.0 |
| Illi Stays | 1 | $66,808 | 20 | 4.90/5.0 |
| Masa | 2 | $58,584 | 46 | 4.92/5.0 |
| Hiroko | 1 | $54,944 | 41 | 4.98/5.0 |
| Dan | 1 | $50,857 | 34 | 5.00/5.0 |
| Ken | 1 | $43,269 | 44 | 4.89/5.0 |
| Miu | 1 | $41,937 | 35 | 4.94/5.0 |
Analyzing the strategies of top hosts, such as their property selection, pricing, and guest communication, can offer valuable lessons for optimizing your own Airbnb operations in Shinagawa City.
Dive Deeper: Advanced Shinagawa City STR Market Data (2026)
Ready to unlock more insights? AirROI provides access to advanced metrics and comprehensive Airbnb data for Shinagawa City. Explore detailed analytics beyond this report to refine your investment strategy, optimize pricing, and maximize your vacation rental profits.
Explore Advanced MetricsShinagawa City Short-Term Rental Market Composition (2026): Property & Room Types
Room Type Distribution
Property Type Distribution
Market Composition Insights for Shinagawa City
- The Shinagawa City Airbnb market composition is heavily skewed towards Entire Home/Apt listings, which make up 94% of the 50 active rentals. This indicates strong guest preference for privacy and space.
- Looking at the property type distribution in Shinagawa City, Apartment/Condo properties are the most common (88%), reflecting the local real estate landscape.
- Smaller segments like hotel/boutique (combined 2.0%) offer potential for unique stay experiences.
Shinagawa City Airbnb Room Capacity Analysis (2026): Bedroom Distribution
Distribution of Listings by Number of Bedrooms
Room Capacity Insights for Shinagawa City
- The dominant room capacity in Shinagawa City is 1 bedroom listings, making up 68% of the market. This suggests a strong demand for properties suitable for couples or solo travelers.
- Together, 1 bedroom and 2 bedrooms properties represent 78.0% of the active Airbnb listings in Shinagawa City, indicating a high concentration in these sizes.
- With over half the market (68%) consisting of studios or 1-bedroom units, Shinagawa City is particularly well-suited for individuals or couples.
- Listings with 3+ bedrooms (6.0%) represent a smaller niche, potentially indicating an underserved market for larger group accommodations in Shinagawa City.
Shinagawa City Vacation Rental Guest Capacity Trends (2026)
Distribution of Listings by Guest Capacity
Guest Capacity Insights for Shinagawa City
- The most common guest capacity trend in Shinagawa City vacation rentals is listings accommodating 2 guests (40%). This suggests the primary traveler segment is likely couples or solo travelers.
- Properties designed for 2 guests and 3 guests dominate the Shinagawa City STR market, accounting for 52.0% of listings.
- A significant 42.0% of listings cater specifically to 1-2 guests, highlighting strong demand from couples and solo travelers in Shinagawa City.
- 22.0% of properties accommodate 6+ guests, serving the market segment for larger families or group travel in Shinagawa City.
- On average, properties in Shinagawa City are equipped to host 3.6 guests.
Shinagawa City Airbnb Booking Patterns (2026): Available vs. Booked Days
Available Days Distribution
Booked Days Distribution
Booking Pattern Insights for Shinagawa City
- The most common availability pattern in Shinagawa City falls within the 181-270 days range, representing 60% of listings. This suggests many properties have significant open periods on their calendars.
- Approximately 68.0% of listings show high availability (181+ days open annually), indicating potential for increased bookings or specific owner usage patterns.
- For booked days, the 91-180 days range is most frequent in Shinagawa City (56%), reflecting common guest stay durations or potential owner blocking patterns.
- A notable 36.0% of properties secure long booking periods (181+ days booked per year), highlighting successful long-term rental strategies or significant owner usage.
Shinagawa City Airbnb Minimum Stay Requirements Analysis
Distribution of Listings by Minimum Night Requirement
1 Night
18 listings
36% of total
2 Nights
6 listings
12% of total
3 Nights
2 listings
4% of total
4-6 Nights
6 listings
12% of total
7-29 Nights
4 listings
8% of total
30+ Nights
14 listings
28% of total
Key Insights
- The most prevalent minimum stay requirement in Shinagawa City is 1 Night, adopted by 36% of listings. This highlights the market's preference for shorter, flexible bookings.
- A significant segment (28%) caters to monthly stays (30+ nights) in Shinagawa City, pointing to opportunities in the extended-stay market.
Recommendations
- Align with the market by considering a 1 Night minimum stay, as 36% of Shinagawa City hosts use this setting.
- Explore offering discounts for stays of 30+ nights to attract the 28% of the market seeking extended stays.
- Adjust minimum nights based on seasonality – potentially shorter during low season and longer during peak demand periods in Shinagawa City.
Shinagawa City Airbnb Cancellation Policy Trends Analysis (2026)
Flexible
10 listings
20% of total
Moderate
7 listings
14% of total
Firm
30 listings
60% of total
Strict
3 listings
6% of total
Cancellation Policy Insights for Shinagawa City
- The prevailing Airbnb cancellation policy trend in Shinagawa City is Firm, used by 60% of listings.
- A majority (66.0%) of hosts in Shinagawa City utilize Firm or Strict policies, indicating a market where hosts prioritize booking security.
- Strict cancellation policies are quite rare (6%), potentially making listings with this policy less competitive unless justified by high demand or property type.
Recommendations for Hosts
- Consider adopting a Firm policy to align with the 60% market standard in Shinagawa City.
- Using a Strict policy might deter some guests, as only 6% of listings use it. Evaluate if potential revenue protection outweighs possible lower booking rates.
- Regularly review your cancellation policy against competitors and market demand shifts in Shinagawa City.
Shinagawa City STR Booking Lead Time Analysis (2026)
Average Booking Lead Time by Month
Booking Lead Time Insights for Shinagawa City
- The overall average booking lead time for vacation rentals in Shinagawa City is 28 days.
- Guests book furthest in advance for stays during November (average 45 days), likely coinciding with peak travel demand or local events.
- The shortest booking windows occur for stays in April (average 0 days), indicating more last-minute travel plans during this time.
- Seasonally, Fall (39 days avg.) sees the longest lead times, while Spring (0 days avg.) has the shortest, reflecting typical travel planning cycles.
Recommendations for Hosts
- Use the overall average lead time (28 days) as a baseline for your pricing and availability strategy in Shinagawa City.
- For November stays, consider implementing length-of-stay discounts or slightly higher rates for bookings made less than 45 days out to capitalize on advance planning.
- During April, focus on last-minute booking availability and promotions, as guests book with very short notice (0 days avg.).
- Target marketing efforts for the Fall season well in advance (at least 39 days) to capture early planners.
- Monitor your own booking lead times against these Shinagawa City averages to identify opportunities for dynamic pricing adjustments.
Popular & Essential Airbnb Amenities in Shinagawa City (2026)
Amenity Prevalence
Amenity Insights for Shinagawa City
- Essential amenities in Shinagawa City that guests expect include: Wifi, Air conditioning, Shampoo, Heating, Hot water kettle, Hair dryer, Refrigerator, Conditioner, Hot water, Smoke alarm. Lacking these (any) could significantly impact bookings.
Recommendations for Hosts
- Ensure your listing includes all essential amenities for Shinagawa City: Wifi, Air conditioning, Shampoo, Heating, Hot water kettle, Hair dryer, Refrigerator, Conditioner, Hot water, Smoke alarm.
- Prioritize adding missing essentials: Shampoo, Heating, Hot water kettle, Hair dryer, Refrigerator, Conditioner, Hot water, Smoke alarm.
- Highlight unique or less common amenities you offer (e.g., hot tub, dedicated workspace, EV charger) in your listing description and photos.
- Regularly check competitor amenities in Shinagawa City to stay competitive.
Shinagawa City Airbnb Guest Demographics & Profile Analysis (2026)
Guest Profile Summary for Shinagawa City
- The typical guest profile for Airbnb in Shinagawa City consists of predominantly international visitors (89%), with top international origins including Japan, typically belonging to the Post-2000s (Gen Z/Alpha) group (50%), primarily speaking English or Chinese.
- Domestic travelers account for 10.9% of guests.
- Key international markets include United States (24.5%) and Japan (10.9%).
- Top languages spoken are English (45.8%) followed by Chinese (11.1%).
- A significant demographic segment is the Post-2000s (Gen Z/Alpha) group, representing 50% of guests.
Recommendations for Hosts
- Focus marketing internationally, particularly towards travelers from Japan.
- Tailor amenities and listing descriptions to appeal to the dominant Post-2000s (Gen Z/Alpha) demographic (e.g., highlight fast WiFi, smart home features, local guides).
- Highlight unique local experiences or amenities relevant to the primary guest profile.
- Consider seasonal promotions aligned with peak travel times for key origin markets.
Nearby Short-Term Rental Market Comparison
How does the Shinagawa City Airbnb market stack up against its neighbors? Compare key performance metrics like average monthly revenue, ADR, and occupancy rates in surrounding areas to understand the broader regional STR landscape.
| Market | Active Properties | Monthly Revenue | Daily Rate | Avg. Occupancy |
|---|---|---|---|---|
| Futtsu | 31 | $5,187 | $369.80 | 44% |
| Kyonan | 15 | $5,099 | $419.89 | 42% |
| Adachi City | 47 | $4,752 | $301.69 | 50% |
| Kita | 15 | $4,563 | $305.24 | 57% |
| Shirako | 22 | $4,439 | $359.94 | 34% |
| Nagatoro | 10 | $4,035 | $249.70 | 52% |
| Kamogawa | 36 | $4,007 | $296.27 | 37% |
| Hakone | 335 | $3,905 | $289.84 | 48% |
| Karuizawa | 121 | $3,852 | $396.31 | 39% |
| Minato City | 99 | $3,809 | $311.75 | 53% |