Wakayama Airbnb Market Analysis 2026: Short Term Rental Data & Vacation Rental Statistics in Wakayama Prefecture, Japan
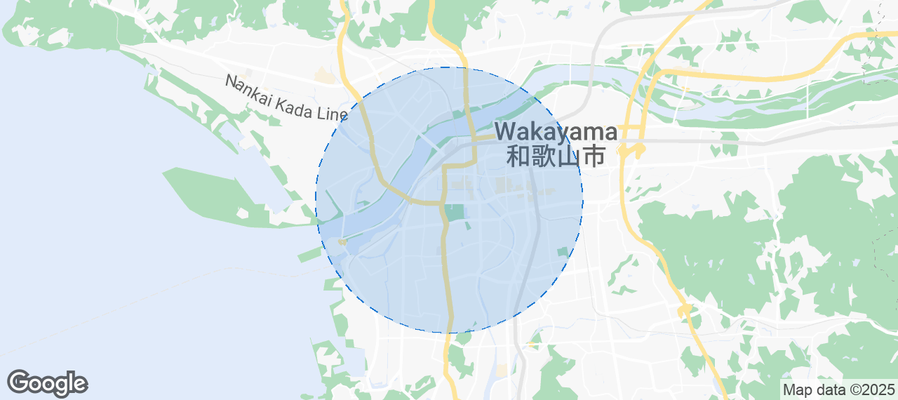
Is Airbnb profitable in Wakayama in 2026? Explore comprehensive Airbnb analytics for Wakayama, Wakayama Prefecture, Japan to uncover income potential. This 2026 STR market report for Wakayama, based on AirROI data from February 2025 to January 2026, reveals key trends in the niche market of 54 active listings.
Whether you're considering an Airbnb investment in Wakayama, optimizing your existing vacation rental, or exploring rental arbitrage opportunities, understanding the Wakayama Airbnb data is crucial. Navigating the high regulation landscape is key to maximizing your short term rental income potential. Let's dive into the specifics.
Key Wakayama Airbnb Performance Metrics Overview
Monthly Airbnb Revenue Variations & Income Potential in Wakayama (2026)
Understanding the monthly revenue variations for Airbnb listings in Wakayama is key to maximizing your short term rental income potential. Seasonality significantly impacts earnings. Our analysis, based on data from the past 12 months, shows that the peak revenue month for STRs in Wakayama is typically August, while February often presents the lowest earnings, highlighting opportunities for strategic pricing adjustments during shoulder and low seasons. Explore the typical Airbnb income in Wakayama across different performance tiers:
- Best-in-class properties (Top 10%) achieve $1,812+ monthly, often utilizing dynamic pricing and superior guest experiences.
- Strong performing properties (Top 25%) earn $1,138 or more, indicating effective management and desirable locations/amenities.
- Typical properties (Median) generate around $550 per month, representing the average market performance.
- Entry-level properties (Bottom 25%) see earnings around $292, often with potential for optimization.
Average Monthly Airbnb Earnings Trend in Wakayama
Wakayama Airbnb Occupancy Rate Trends (2026)
Maximize your bookings by understanding the Wakayama STR occupancy trends. Seasonal demand shifts significantly influence how often properties are booked. Typically, Junesees the highest demand (peak season occupancy), while January experiences the lowest (low season). Effective strategies, like adjusting minimum stays or offering promotions, can boost occupancy during slower periods. Here's how different property tiers perform in Wakayama:
- Best-in-class properties (Top 10%) achieve 64%+ occupancy, indicating high desirability and potentially optimized availability.
- Strong performing properties (Top 25%) maintain 48% or higher occupancy, suggesting good market fit and guest satisfaction.
- Typical properties (Median) have an occupancy rate around 31%.
- Entry-level properties (Bottom 25%) average 17% occupancy, potentially facing higher vacancy.
Average Monthly Occupancy Rate Trend in Wakayama
Average Daily Rate (ADR) Airbnb Trends in Wakayama (2026)
Effective short term rental pricing strategy in Wakayama involves understanding monthly ADR fluctuations. The Average Daily Rate (ADR) for Airbnb in Wakayama typically peaks in October and dips lowest during February. Leveraging Airbnb dynamic pricing tools or strategies based on this seasonality can significantly boost revenue. Here's a look at the typical nightly rates achieved:
- Best-in-class properties (Top 10%) command rates of $182+ per night, often due to premium features or locations.
- Strong performing properties (Top 25%) achieve nightly rates of $102 or more.
- Typical properties (Median) charge around $62 per night.
- Entry-level properties (Bottom 25%) earn around $39 per night.
Average Daily Rate (ADR) Trend by Month in Wakayama
Get Live Wakayama Market Intelligence 👇
Explore Real-time Analytics
Airbnb Seasonality Analysis & Trends in Wakayama (2026)
Peak Season (August, November, June)
- Revenue averages $1,170 per month
- Occupancy rates average 38.8%
- Daily rates average $101
Shoulder Season
- Revenue averages $927 per month
- Occupancy maintains around 34.4%
- Daily rates hold near $100
Low Season (January, February, March)
- Revenue drops to average $747 per month
- Occupancy decreases to average 29.7%
- Daily rates adjust to average $94
Seasonality Insights for Wakayama
- The Airbnb seasonality in Wakayama shows highly seasonal trends requiring careful strategy. While the sections above show seasonal averages, it's also insightful to look at the extremes:
- During the high season, the absolute peak month showcases Wakayama's highest earning potential, with monthly revenues capable of climbing to $1,390, occupancy reaching a high of 40.7%, and ADRs peaking at $108.
- Conversely, the slowest single month of the year, typically falling within the low season, marks the market's lowest point. In this month, revenue might dip to $716, occupancy could drop to 23.4%, and ADRs may adjust down to $88.
- Understanding both the seasonal averages and these monthly peaks and troughs in revenue, occupancy, and ADR is crucial for maximizing your Airbnb profit potential in Wakayama.
Seasonal Strategies for Maximizing Profit
- Peak Season: Maximize revenue through premium pricing and potentially longer minimum stays. Ensure high availability.
- Low Season: Offer competitive pricing, special promotions (e.g., extended stay discounts), and flexible cancellation policies. Target off-season travelers like remote workers or budget-conscious guests.
- Shoulder Seasons: Implement dynamic pricing that balances peak and low rates. Target weekend travelers or specific events. Offer slightly more flexible terms than peak season.
- Regularly analyze your own performance against these Wakayama seasonality benchmarks and adjust your pricing and availability strategy accordingly.
Best Areas for Airbnb Investment in Wakayama (2026)
Exploring the top neighborhoods for short-term rentals in Wakayama? This section highlights key areas, outlining why they are attractive for hosts and guests, along with notable local attractions. Consider these locations based on your target guest profile and investment strategy.
| Neighborhood / Area | Why Host Here? (Target Guests & Appeal) | Key Attractions & Landmarks |
|---|---|---|
| Kushimoto | Known for its stunning coastal views and marine activities, Kushimoto attracts tourists looking for beach adventures and relaxation. | Kushimoto Marine Park, Cape Shionomisaki, Kushimoto Undersea Park, Kushimoto Lighthouse, Wakayama Prefectural Museum of Nature |
| Shingu | A city rich in cultural heritage, Shingu offers historical sites and access to Kumano Kodo, attracting visitors interested in history and nature. | Kumano Hayatama Taisha, Shingu Castle, Kumano Kodo pilgrimage routes, The Shingu Folklore Museum, Kumano River |
| Tanabe | Famous for its hot springs and proximity to the Kumano region, Tanabe is popular among travelers seeking wellness and outdoor activities. | Kumano Nachi Taisha, Nachi Waterfall, Yuasa Soy Sauce Museum, Tenkasin Falls, Kumano Kodo pilgrimage routes |
| Wakayama City | As the capital of Wakayama Prefecture, it offers a mix of urban attractions, historical sites, and easy access to the surrounding area. | Wakayama Castle, Wakayama Marina City, Kishu Vinegar Museum, Kuroshio Market, Mizumoto Park |
| Goto Islands | With beautiful unspoiled nature and a more secluded feel, Goto Islands are perfect for those seeking peace and relaxation away from the crowds. | Aso Bay, Hirado Castle, Nakanoshima Island, Oshima Beach, Local seafood markets |
| Nanki Shirahama | Famous for its hot springs and beautiful beaches, a top destination for domestic and international tourists alike. | Shirahama Beach, Adventure World, Tsubaki Onsen, Senjojiki, Shirahama Energy Land |
| Kamikura Shrine | An important cultural site offering beautiful views and tranquility, it attracts visitors for its spiritual significance and natural beauty. | Kamikura Shrine, Oni no Sumu Sato, Sacred Rocks of Kamikura, Viewpoint of the Kumano River, Nature trails |
| Yoshino | Famous for its cherry blossoms, it's a major destination for tourists, especially in spring, offering splendid natural beauty and outdoor activities. | Yoshino Mountain, Yoshinoyama Cherry Blossom Park, Kinpusen-ji Temple, Niomon Gate, Yoshino Open Air Museum |
Understanding Airbnb License Requirements & STR Laws in Wakayama (2026)
Yes, Wakayama, Wakayama Prefecture, Japan enforces high STR regulations. Obtaining a license and ensuring compliance is almost certainly required according to current 2026 STR laws. Always verify the latest short term rental regulations and Airbnb license requirements directly with local government authorities for Wakayama to ensure full compliance before hosting.
(Source: AirROI data, 2026, based on 98% licensed listings)
Top Performing Airbnb Properties in Wakayama (2026)
Benchmark your potential! Explore examples of top-performing Airbnb properties in Wakayamabased on Trailing Twelve Month (TTM) revenue. Analyze their characteristics, revenue, occupancy rate, and ADR to understand what drives success in this market.

A stylish house that is warm and fun for everyone
Entire Place • 1 bedroom
Up to 14 people, private, free parking, for groups and families, hot springs, Wakayama Castle, Kuros
Private Room • 3 bedrooms
Villa in a charming town near the sea
Entire Place • 1 bedroom

Family & pets allowed | LA.FUKU Wakaura/90 minutes from Osaka
Entire Place • 3 bedrooms
For group & family/30min by car from KIX/park free
Entire Place • 4 bedrooms

Private apartment.2 bedrooms.6beds
Private Room • 2 bedrooms
Note: Performance varies based on location, size, amenities, seasonality, and management quality. Data reflects the past 12 months.
Top Performing Airbnb Hosts in Wakayama (2026)
Learn from the best! This table showcases top-performing Airbnb hosts in Wakayama based on the number of properties managed and estimated total revenue over the past year. Analyze their scale and performance metrics.
| Host Name | Properties | Grossing Revenue | Stay Reviews | Avg Rating |
|---|---|---|---|---|
| Houseland | 1 | $88,680 | 6 | 4.67/5.0 |
| Hiroko | 5 | $52,860 | 719 | 4.96/5.0 |
| Takashi | 8 | $46,570 | 354 | 4.83/5.0 |
| Samo | 6 | $40,352 | 254 | 4.42/5.0 |
| 容平 | 2 | $40,301 | 35 | 4.76/5.0 |
| Maki | 3 | $31,852 | 63 | 4.86/5.0 |
| Hiro And Yurika | 10 | $30,073 | 196 | 4.33/5.0 |
| Akihide | 1 | $19,323 | 19 | 5.00/5.0 |
| 晴 | 2 | $18,084 | 17 | 4.49/5.0 |
| Ayumi | 1 | $17,954 | 61 | 4.59/5.0 |
Analyzing the strategies of top hosts, such as their property selection, pricing, and guest communication, can offer valuable lessons for optimizing your own Airbnb operations in Wakayama.
Dive Deeper: Advanced Wakayama STR Market Data (2026)
Ready to unlock more insights? AirROI provides access to advanced metrics and comprehensive Airbnb data for Wakayama. Explore detailed analytics beyond this report to refine your investment strategy, optimize pricing, and maximize your vacation rental profits.
Explore Advanced MetricsWakayama Short-Term Rental Market Composition (2026): Property & Room Types
Room Type Distribution
Property Type Distribution
Market Composition Insights for Wakayama
- The Wakayama Airbnb market composition is heavily skewed towards Entire Home/Apt listings, which make up 53.7% of the 54 active rentals. This indicates strong guest preference for privacy and space.
- However, a notable 40.7% share for Private Rooms suggests opportunities for budget-conscious travelers or hosts renting out spare rooms.
- Looking at the property type distribution in Wakayama, Apartment/Condo properties are the most common (44.4%), reflecting the local real estate landscape.
- Houses represent a significant 25.9% portion, catering likely to families or larger groups.
- The presence of 24.1% Hotel/Boutique listings indicates integration with traditional hospitality.
Wakayama Airbnb Room Capacity Analysis (2026): Bedroom Distribution
Distribution of Listings by Number of Bedrooms
Room Capacity Insights for Wakayama
- The dominant room capacity in Wakayama is 1 bedroom listings, making up 46.3% of the market. This suggests a strong demand for properties suitable for couples or solo travelers.
- Together, 1 bedroom and 2 bedrooms properties represent 70.4% of the active Airbnb listings in Wakayama, indicating a high concentration in these sizes.
Wakayama Vacation Rental Guest Capacity Trends (2026)
Distribution of Listings by Guest Capacity
Guest Capacity Insights for Wakayama
- The most common guest capacity trend in Wakayama vacation rentals is listings accommodating 6 guests (14.8%). This suggests the primary traveler segment is likely larger groups.
- Properties designed for 6 guests and 2 guests dominate the Wakayama STR market, accounting for 29.6% of listings.
- 27.8% of properties accommodate 6+ guests, serving the market segment for larger families or group travel in Wakayama.
- On average, properties in Wakayama are equipped to host 3.6 guests.
Wakayama Airbnb Booking Patterns (2026): Available vs. Booked Days
Available Days Distribution
Booked Days Distribution
Booking Pattern Insights for Wakayama
- The most common availability pattern in Wakayama falls within the 271-366 days range, representing 48.1% of listings. This suggests many properties have significant open periods on their calendars.
- Approximately 90.7% of listings show high availability (181+ days open annually), indicating potential for increased bookings or specific owner usage patterns.
- For booked days, the 91-180 days range is most frequent in Wakayama (44.4%), reflecting common guest stay durations or potential owner blocking patterns.
- A notable 9.3% of properties secure long booking periods (181+ days booked per year), highlighting successful long-term rental strategies or significant owner usage.
Wakayama Airbnb Minimum Stay Requirements Analysis
Distribution of Listings by Minimum Night Requirement
1 Night
44 listings
81.5% of total
2 Nights
7 listings
13% of total
30+ Nights
3 listings
5.6% of total
Key Insights
- The most prevalent minimum stay requirement in Wakayama is 1 Night, adopted by 81.5% of listings. This highlights the market's preference for shorter, flexible bookings.
- A strong majority (94.5%) of the Wakayama Airbnb data shows acceptance of very short stays (1-2 nights), indicating a dynamic, high-turnover market.
Recommendations
- Align with the market by considering a 1 Night minimum stay, as 81.5% of Wakayama hosts use this setting.
- Explore offering discounts for stays of 30+ nights to attract the 5.6% of the market seeking extended stays.
- Adjust minimum nights based on seasonality – potentially shorter during low season and longer during peak demand periods in Wakayama.
Wakayama Airbnb Cancellation Policy Trends Analysis (2026)
Flexible
11 listings
20.4% of total
Moderate
24 listings
44.4% of total
Firm
18 listings
33.3% of total
Strict
1 listings
1.9% of total
Cancellation Policy Insights for Wakayama
- The prevailing Airbnb cancellation policy trend in Wakayama is Moderate, used by 44.4% of listings.
- There's a relatively balanced mix between guest-friendly (64.8%) and stricter (35.2%) policies, offering choices for different guest needs.
- Strict cancellation policies are quite rare (1.9%), potentially making listings with this policy less competitive unless justified by high demand or property type.
Recommendations for Hosts
- Consider adopting a Moderate policy to align with the 44.4% market standard in Wakayama.
- Using a Strict policy might deter some guests, as only 1.9% of listings use it. Evaluate if potential revenue protection outweighs possible lower booking rates.
- Regularly review your cancellation policy against competitors and market demand shifts in Wakayama.
Wakayama STR Booking Lead Time Analysis (2026)
Average Booking Lead Time by Month
Booking Lead Time Insights for Wakayama
- The overall average booking lead time for vacation rentals in Wakayama is 32 days.
- Guests book furthest in advance for stays during November (average 44 days), likely coinciding with peak travel demand or local events.
- The shortest booking windows occur for stays in April (average 26 days), indicating more last-minute travel plans during this time.
- Seasonally, Fall (37 days avg.) sees the longest lead times, while Winter (32 days avg.) has the shortest, reflecting typical travel planning cycles.
Recommendations for Hosts
- Use the overall average lead time (32 days) as a baseline for your pricing and availability strategy in Wakayama.
- For November stays, consider implementing length-of-stay discounts or slightly higher rates for bookings made less than 44 days out to capitalize on advance planning.
- Target marketing efforts for the Fall season well in advance (at least 37 days) to capture early planners.
- Monitor your own booking lead times against these Wakayama averages to identify opportunities for dynamic pricing adjustments.
Popular & Essential Airbnb Amenities in Wakayama (2026)
Amenity Prevalence
Amenity Insights for Wakayama
- Essential amenities in Wakayama that guests expect include: Air conditioning, Wifi. Lacking these (any) could significantly impact bookings.
- Popular amenities like Smoke alarm, Hair dryer, Washer are common but not universal. Offering these can provide a competitive edge.
Recommendations for Hosts
- Ensure your listing includes all essential amenities for Wakayama: Air conditioning, Wifi.
- Prioritize adding missing essentials: Air conditioning, Wifi.
- Consider adding popular differentiators like Smoke alarm or Hair dryer to increase appeal.
- Highlight unique or less common amenities you offer (e.g., hot tub, dedicated workspace, EV charger) in your listing description and photos.
- Regularly check competitor amenities in Wakayama to stay competitive.
Wakayama Airbnb Guest Demographics & Profile Analysis (2026)
Guest Profile Summary for Wakayama
- The typical guest profile for Airbnb in Wakayama consists of predominantly international visitors (88%), with top international origins including Japan, typically belonging to the Post-2000s (Gen Z/Alpha) group (50%), primarily speaking English or Chinese.
- Domestic travelers account for 11.9% of guests.
- Key international markets include China (20.5%) and Japan (11.9%).
- Top languages spoken are English (39.6%) followed by Chinese (19.6%).
- A significant demographic segment is the Post-2000s (Gen Z/Alpha) group, representing 50% of guests.
Recommendations for Hosts
- Focus marketing internationally, particularly towards travelers from Japan.
- Tailor amenities and listing descriptions to appeal to the dominant Post-2000s (Gen Z/Alpha) demographic (e.g., highlight fast WiFi, smart home features, local guides).
- Highlight unique local experiences or amenities relevant to the primary guest profile.
- Consider seasonal promotions aligned with peak travel times for key origin markets.
Nearby Short-Term Rental Market Comparison
How does the Wakayama Airbnb market stack up against its neighbors? Compare key performance metrics like average monthly revenue, ADR, and occupancy rates in surrounding areas to understand the broader regional STR landscape.
| Market | Active Properties | Monthly Revenue | Daily Rate | Avg. Occupancy |
|---|---|---|---|---|
| Minamiawaji | 41 | $4,120 | $363.92 | 40% |
| Shima | 40 | $3,717 | $295.59 | 40% |
| Toba | 12 | $3,477 | $332.20 | 31% |
| Shimogyo Ward | 34 | $3,396 | $279.96 | 49% |
| Kameoka | 11 | $3,265 | $226.40 | 45% |
| Awaji | 106 | $3,260 | $271.78 | 41% |
| Kyoto | 3,744 | $3,232 | $193.65 | 57% |
| Minami Ward | 28 | $2,977 | $202.49 | 59% |
| Kamigyo Ward | 11 | $2,757 | $218.11 | 50% |
| Fushimi Ward | 12 | $2,704 | $194.55 | 53% |