San Felípe Airbnb Market Analysis 2026: Short Term Rental Data & Vacation Rental Statistics in B.C., Mexico
Is Airbnb profitable in San Felípe in 2026? Explore comprehensive Airbnb analytics for San Felípe, B.C., Mexico to uncover income potential. This 2026 STR market report for San Felípe, based on AirROI data from February 2025 to January 2026, reveals key trends in the niche market of 21 active listings.
Whether you're considering an Airbnb investment in San Felípe, optimizing your existing vacation rental, or exploring rental arbitrage opportunities, understanding the San Felípe Airbnb data is crucial. Leveraging the low regulation environment is key to maximizing your short term rental income potential. Let's dive into the specifics.
Key San Felípe Airbnb Performance Metrics Overview
Monthly Airbnb Revenue Variations & Income Potential in San Felípe (2026)
Understanding the monthly revenue variations for Airbnb listings in San Felípe is key to maximizing your short term rental income potential. Seasonality significantly impacts earnings. Our analysis, based on data from the past 12 months, shows that the peak revenue month for STRs in San Felípe is typically May, while November often presents the lowest earnings, highlighting opportunities for strategic pricing adjustments during shoulder and low seasons. Explore the typical Airbnb income in San Felípe across different performance tiers:
- Best-in-class properties (Top 10%) achieve $3,886+ monthly, often utilizing dynamic pricing and superior guest experiences.
- Strong performing properties (Top 25%) earn $1,876 or more, indicating effective management and desirable locations/amenities.
- Typical properties (Median) generate around $1,191 per month, representing the average market performance.
- Entry-level properties (Bottom 25%) see earnings around $787, often with potential for optimization.
Average Monthly Airbnb Earnings Trend in San Felípe
San Felípe Airbnb Occupancy Rate Trends (2026)
Maximize your bookings by understanding the San Felípe STR occupancy trends. Seasonal demand shifts significantly influence how often properties are booked. Typically, Januarysees the highest demand (peak season occupancy), while September experiences the lowest (low season). Effective strategies, like adjusting minimum stays or offering promotions, can boost occupancy during slower periods. Here's how different property tiers perform in San Felípe:
- Best-in-class properties (Top 10%) achieve 32%+ occupancy, indicating high desirability and potentially optimized availability.
- Strong performing properties (Top 25%) maintain 23% or higher occupancy, suggesting good market fit and guest satisfaction.
- Typical properties (Median) have an occupancy rate around 16%.
- Entry-level properties (Bottom 25%) average 13% occupancy, potentially facing higher vacancy.
Average Monthly Occupancy Rate Trend in San Felípe
Average Daily Rate (ADR) Airbnb Trends in San Felípe (2026)
Effective short term rental pricing strategy in San Felípe involves understanding monthly ADR fluctuations. The Average Daily Rate (ADR) for Airbnb in San Felípe typically peaks in October and dips lowest during July. Leveraging Airbnb dynamic pricing tools or strategies based on this seasonality can significantly boost revenue. Here's a look at the typical nightly rates achieved:
- Best-in-class properties (Top 10%) command rates of $521+ per night, often due to premium features or locations.
- Strong performing properties (Top 25%) achieve nightly rates of $361 or more.
- Typical properties (Median) charge around $257 per night.
- Entry-level properties (Bottom 25%) earn around $216 per night.
Average Daily Rate (ADR) Trend by Month in San Felípe
Get Live San Felípe Market Intelligence 👇

Explore Real-time Analytics
Airbnb Seasonality Analysis & Trends in San Felípe (2026)
Peak Season (May, April, June)
- Revenue averages $2,564 per month
- Occupancy rates average 23.7%
- Daily rates average $323
Shoulder Season
- Revenue averages $1,704 per month
- Occupancy maintains around 18.0%
- Daily rates hold near $317
Low Season (January, September, November)
- Revenue drops to average $1,004 per month
- Occupancy decreases to average 21.8%
- Daily rates adjust to average $347
Seasonality Insights for San Felípe
- The Airbnb seasonality in San Felípe shows highly seasonal trends requiring careful strategy. While the sections above show seasonal averages, it's also insightful to look at the extremes:
- During the high season, the absolute peak month showcases San Felípe's highest earning potential, with monthly revenues capable of climbing to $2,903, occupancy reaching a high of 38.7%, and ADRs peaking at $352.
- Conversely, the slowest single month of the year, typically falling within the low season, marks the market's lowest point. In this month, revenue might dip to $825, occupancy could drop to 10.0%, and ADRs may adjust down to $295.
- Understanding both the seasonal averages and these monthly peaks and troughs in revenue, occupancy, and ADR is crucial for maximizing your Airbnb profit potential in San Felípe.
Seasonal Strategies for Maximizing Profit
- Peak Season: Maximize revenue through premium pricing and potentially longer minimum stays. Ensure high availability.
- Low Season: Offer competitive pricing, special promotions (e.g., extended stay discounts), and flexible cancellation policies. Target off-season travelers like remote workers or budget-conscious guests.
- Shoulder Seasons: Implement dynamic pricing that balances peak and low rates. Target weekend travelers or specific events. Offer slightly more flexible terms than peak season.
- Regularly analyze your own performance against these San Felípe seasonality benchmarks and adjust your pricing and availability strategy accordingly.
Best Areas for Airbnb Investment in San Felípe (2026)
Exploring the top neighborhoods for short-term rentals in San Felípe? This section highlights key areas, outlining why they are attractive for hosts and guests, along with notable local attractions. Consider these locations based on your target guest profile and investment strategy.
| Neighborhood / Area | Why Host Here? (Target Guests & Appeal) | Key Attractions & Landmarks |
|---|---|---|
| Playa San Felipe | A beautiful beach area that attracts tourists looking to enjoy sun and sea. It's great for families and offers recreational activities. | San Felipe Beach, Malecon de San Felipe, Sea of Cortez, Water sports, Fishing excursions, Local restaurants |
| Centro San Felipe | The downtown area filled with local culture, shops, and eateries. Perfect for tourists wanting to experience the local lifestyle. | San Felipe Church, Local markets, Artisan shops, Restaurants and cafes, Cultural festivities |
| Las Palmas | A popular residential area with a mix of locals and expats. Ideal for those looking for longer stays away from the tourist areas. | Las Palmas Beach, Community parks, Local eateries, Quiet neighborhoods, Views of the Sea of Cortez |
| El Dorado Ranch | A gated community that offers a range of amenities including golf, pools, and security. Appeals to retirees and families. | Golf course, Community pools, Nature trails, Social clubs, Private beach access |
| San Felipe Marina | An area with a marina offering water activities like boating and fishing. It's attractive to adventure seekers and water sports lovers. | Marina activities, Boat rentals, Fishing trips, Restaurant on the marina, Sunset views |
| Baja Amigas | A community known for its welcoming atmosphere and activities for snowbirds during the winter months, fostering a sense of community. | Community events, Group activities, Friendly locals, Potluck dinners, Craft markets |
| Pueblo Nuevo | A developing area with new homes and potential for investment, attracting those looking for lower prices and future growth. | New construction, Quiet surroundings, Affordable housing, Potential expat community, Close to town center |
| Desert Oasis | A retreat area located a bit away from the town bustle, offering peace and tranquility for those looking to escape. | Scenic views, Nature hikes, Stargazing, Desert activities, Peaceful ambiance |
Understanding Airbnb License Requirements & STR Laws in San Felípe (2026)
While San Felípe, B.C., Mexico currently shows low STR regulations, specific Airbnb license requirements might still exist or change. Always verify the latest short term rental regulations and Airbnb license requirements directly with local government authorities for San Felípe to ensure full compliance before hosting.
(Source: AirROI data, 2026, finding no licensed listings among those analyzed)
Top Performing Airbnb Properties in San Felípe (2026)
Benchmark your potential! Explore examples of top-performing Airbnb properties in San Felípebased on Trailing Twelve Month (TTM) revenue. Analyze their characteristics, revenue, occupancy rate, and ADR to understand what drives success in this market.
Casa Matas
Entire Place • 6 bedrooms
Casa Habana Beach views with WiFi
Entire Place • 6 bedrooms

Villa411 Beach+Tennis+Pool+Internet
Entire Place • 2 bedrooms
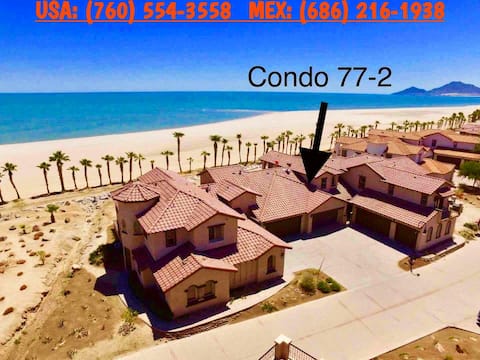
Beach Front Condo 2 Bed Sleeps 6 Condo 772 W/WiFi
Entire Place • 2 bedrooms

Beach Blessing ~ 75-4 with WiFi
Entire Place • 3 bedrooms
Beach House Palapa with Pool
Entire Place • 4 bedrooms
Note: Performance varies based on location, size, amenities, seasonality, and management quality. Data reflects the past 12 months.
Top Performing Airbnb Hosts in San Felípe (2026)
Learn from the best! This table showcases top-performing Airbnb hosts in San Felípe based on the number of properties managed and estimated total revenue over the past year. Analyze their scale and performance metrics.
| Host Name | Properties | Grossing Revenue | Stay Reviews | Avg Rating |
|---|---|---|---|---|
| Erick Adrian | 18 | $170,185 | 159 | 4.52/5.0 |
| Cesar | 1 | $13,566 | 29 | 4.62/5.0 |
| Cindy | 1 | $7,831 | 89 | 4.87/5.0 |
| Soby | 1 | $5,781 | 16 | 4.81/5.0 |
Analyzing the strategies of top hosts, such as their property selection, pricing, and guest communication, can offer valuable lessons for optimizing your own Airbnb operations in San Felípe.
Dive Deeper: Advanced San Felípe STR Market Data (2026)
Ready to unlock more insights? AirROI provides access to advanced metrics and comprehensive Airbnb data for San Felípe. Explore detailed analytics beyond this report to refine your investment strategy, optimize pricing, and maximize your vacation rental profits.
Explore Advanced MetricsSan Felípe Short-Term Rental Market Composition (2026): Property & Room Types
Room Type Distribution
Property Type Distribution
Market Composition Insights for San Felípe
- The San Felípe Airbnb market composition is heavily skewed towards Entire Home/Apt listings, which make up 100% of the 21 active rentals. This indicates strong guest preference for privacy and space.
- Looking at the property type distribution in San Felípe, House properties are the most common (66.7%), reflecting the local real estate landscape.
- Houses represent a significant 66.7% portion, catering likely to families or larger groups.
San Felípe Airbnb Room Capacity Analysis (2026): Bedroom Distribution
Distribution of Listings by Number of Bedrooms
Room Capacity Insights for San Felípe
- The dominant room capacity in San Felípe is 3 bedrooms listings, making up 38.1% of the market. This suggests a strong demand for properties suitable for families or small groups.
- Together, 3 bedrooms and 2 bedrooms properties represent 71.4% of the active Airbnb listings in San Felípe, indicating a high concentration in these sizes.
- A significant 57.1% of listings offer 3+ bedrooms, catering to larger groups and families seeking more space in San Felípe.
San Felípe Vacation Rental Guest Capacity Trends (2026)
Distribution of Listings by Guest Capacity
Guest Capacity Insights for San Felípe
- The most common guest capacity trend in San Felípe vacation rentals is listings accommodating 8+ guests (52.4%). This suggests the primary traveler segment is likely larger groups.
- Properties designed for 8+ guests and 6 guests dominate the San Felípe STR market, accounting for 90.5% of listings.
- 90.5% of properties accommodate 6+ guests, serving the market segment for larger families or group travel in San Felípe.
- On average, properties in San Felípe are equipped to host 6.8 guests.
San Felípe Airbnb Booking Patterns (2026): Available vs. Booked Days
Available Days Distribution
Booked Days Distribution
Booking Pattern Insights for San Felípe
- The most common availability pattern in San Felípe falls within the 271-366 days range, representing 100% of listings. This suggests many properties have significant open periods on their calendars.
- Approximately 100.0% of listings show high availability (181+ days open annually), indicating potential for increased bookings or specific owner usage patterns.
- For booked days, the 1-30 days range is most frequent in San Felípe (76.2%), reflecting common guest stay durations or potential owner blocking patterns.
San Felípe Airbnb Minimum Stay Requirements Analysis
Distribution of Listings by Minimum Night Requirement
1 Night
4 listings
19% of total
2 Nights
13 listings
61.9% of total
30+ Nights
4 listings
19% of total
Key Insights
- The most prevalent minimum stay requirement in San Felípe is 2 Nights, adopted by 61.9% of listings. This highlights the market's preference for shorter, flexible bookings.
- A strong majority (80.9%) of the San Felípe Airbnb data shows acceptance of very short stays (1-2 nights), indicating a dynamic, high-turnover market.
- A significant segment (19%) caters to monthly stays (30+ nights) in San Felípe, pointing to opportunities in the extended-stay market.
Recommendations
- Align with the market by considering a 2 Nights minimum stay, as 61.9% of San Felípe hosts use this setting.
- If feasible, allowing 1-night stays, especially midweek or during low season, could capture last-minute bookings, as only 19% currently do.
- A 2-night minimum appears standard (61.9%). Consider this for weekends or peak periods.
- Explore offering discounts for stays of 30+ nights to attract the 19% of the market seeking extended stays.
- Adjust minimum nights based on seasonality – potentially shorter during low season and longer during peak demand periods in San Felípe.
San Felípe Airbnb Cancellation Policy Trends Analysis (2026)
Flexible
2 listings
9.5% of total
Firm
19 listings
90.5% of total
Cancellation Policy Insights for San Felípe
- The prevailing Airbnb cancellation policy trend in San Felípe is Firm, used by 90.5% of listings.
- A majority (90.5%) of hosts in San Felípe utilize Firm or Strict policies, indicating a market where hosts prioritize booking security.
Recommendations for Hosts
- Consider adopting a Firm policy to align with the 90.5% market standard in San Felípe.
- Regularly review your cancellation policy against competitors and market demand shifts in San Felípe.
San Felípe STR Booking Lead Time Analysis (2026)
Average Booking Lead Time by Month
Booking Lead Time Insights for San Felípe
- The overall average booking lead time for vacation rentals in San Felípe is 56 days.
- Guests book furthest in advance for stays during March (average 118 days), likely coinciding with peak travel demand or local events.
- The shortest booking windows occur for stays in February (average 0 days), indicating more last-minute travel plans during this time.
- Seasonally, Spring (100 days avg.) sees the longest lead times, while Winter (22 days avg.) has the shortest, reflecting typical travel planning cycles.
Recommendations for Hosts
- Use the overall average lead time (56 days) as a baseline for your pricing and availability strategy in San Felípe.
- For March stays, consider implementing length-of-stay discounts or slightly higher rates for bookings made less than 118 days out to capitalize on advance planning.
- During February, focus on last-minute booking availability and promotions, as guests book with very short notice (0 days avg.).
- Target marketing efforts for the Spring season well in advance (at least 100 days) to capture early planners.
- Monitor your own booking lead times against these San Felípe averages to identify opportunities for dynamic pricing adjustments.
Popular & Essential Airbnb Amenities in San Felípe (2026)
Amenity Prevalence
Amenity Insights for San Felípe
- Essential amenities in San Felípe that guests expect include: Air conditioning, Heating. Lacking these (any) could significantly impact bookings.
- Popular amenities like Wifi, TV, Refrigerator are common but not universal. Offering these can provide a competitive edge.
- Warning: Wifi is not universally provided but is considered essential globally. Ensure reliable Wifi is offered.
Recommendations for Hosts
- Ensure your listing includes all essential amenities for San Felípe: Air conditioning, Heating.
- Prioritize adding missing essentials: Heating.
- Consider adding popular differentiators like Wifi or TV to increase appeal.
- Highlight unique or less common amenities you offer (e.g., hot tub, dedicated workspace, EV charger) in your listing description and photos.
- Regularly check competitor amenities in San Felípe to stay competitive.
San Felípe Airbnb Guest Demographics & Profile Analysis (2026)
Guest Profile Summary for San Felípe
- The typical guest profile for Airbnb in San Felípe consists of predominantly international visitors (78%), with top international origins including Mexico, typically belonging to the Post-2000s (Gen Z/Alpha) group (50%), primarily speaking English or Spanish.
- Domestic travelers account for 22.2% of guests.
- Key international markets include United States (66.7%) and Mexico (22.2%).
- Top languages spoken are English (55.6%) followed by Spanish (44.4%).
- A significant demographic segment is the Post-2000s (Gen Z/Alpha) group, representing 50% of guests.
Recommendations for Hosts
- Focus marketing internationally, particularly towards travelers from Mexico.
- Tailor amenities and listing descriptions to appeal to the dominant Post-2000s (Gen Z/Alpha) demographic (e.g., highlight fast WiFi, smart home features, local guides).
- Highlight unique local experiences or amenities relevant to the primary guest profile.
- Consider seasonal promotions aligned with peak travel times for key origin markets.
Nearby Short-Term Rental Market Comparison
How does the San Felípe Airbnb market stack up against its neighbors? Compare key performance metrics like average monthly revenue, ADR, and occupancy rates in surrounding areas to understand the broader regional STR landscape.
| Market | Active Properties | Monthly Revenue | Daily Rate | Avg. Occupancy |
|---|---|---|---|---|
| Playa Encanto | 86 | $2,191 | $297.59 | 31% |
| Las Conchas | 148 | $1,765 | $289.28 | 26% |
| Imperial | 18 | $1,578 | $184.17 | 48% |
| Brawley | 14 | $1,447 | $189.66 | 37% |
| Yuma | 348 | $1,404 | $143.12 | 43% |
| Rocky Point | 1,822 | $1,395 | $234.57 | 26% |
| El Centro | 41 | $1,277 | $121.55 | 43% |
| San Luis | 16 | $1,255 | $125.91 | 39% |
| Fortuna Foothills | 136 | $1,154 | $131.14 | 43% |
| Puerto Penasco | 231 | $1,128 | $250.21 | 25% |