Chihuahua City Airbnb Market Analysis 2026: Short Term Rental Data & Vacation Rental Statistics in Chihuahua, Mexico
Is Airbnb profitable in Chihuahua City in 2026? Explore comprehensive Airbnb analytics for Chihuahua City, Chihuahua, Mexico to uncover income potential. This 2026 STR market report for Chihuahua City, based on AirROI data from February 2025 to January 2026, reveals key trends in the market of 853 active listings.
Whether you're considering an Airbnb investment in Chihuahua City, optimizing your existing vacation rental, or exploring rental arbitrage opportunities, understanding the Chihuahua City Airbnb data is crucial. Leveraging the low regulation environment is key to maximizing your short term rental income potential. Let's dive into the specifics.
Key Chihuahua City Airbnb Performance Metrics Overview
Monthly Airbnb Revenue Variations & Income Potential in Chihuahua City (2026)
Understanding the monthly revenue variations for Airbnb listings in Chihuahua City is key to maximizing your short term rental income potential. Seasonality significantly impacts earnings. Our analysis, based on data from the past 12 months, shows that the peak revenue month for STRs in Chihuahua City is typically December, while February often presents the lowest earnings, highlighting opportunities for strategic pricing adjustments during shoulder and low seasons. Explore the typical Airbnb income in Chihuahua City across different performance tiers:
- Best-in-class properties (Top 10%) achieve $1,324+ monthly, often utilizing dynamic pricing and superior guest experiences.
- Strong performing properties (Top 25%) earn $823 or more, indicating effective management and desirable locations/amenities.
- Typical properties (Median) generate around $467 per month, representing the average market performance.
- Entry-level properties (Bottom 25%) see earnings around $222, often with potential for optimization.
Average Monthly Airbnb Earnings Trend in Chihuahua City
Chihuahua City Airbnb Occupancy Rate Trends (2026)
Maximize your bookings by understanding the Chihuahua City STR occupancy trends. Seasonal demand shifts significantly influence how often properties are booked. Typically, Marchsees the highest demand (peak season occupancy), while January experiences the lowest (low season). Effective strategies, like adjusting minimum stays or offering promotions, can boost occupancy during slower periods. Here's how different property tiers perform in Chihuahua City:
- Best-in-class properties (Top 10%) achieve 75%+ occupancy, indicating high desirability and potentially optimized availability.
- Strong performing properties (Top 25%) maintain 56% or higher occupancy, suggesting good market fit and guest satisfaction.
- Typical properties (Median) have an occupancy rate around 35%.
- Entry-level properties (Bottom 25%) average 17% occupancy, potentially facing higher vacancy.
Average Monthly Occupancy Rate Trend in Chihuahua City
Average Daily Rate (ADR) Airbnb Trends in Chihuahua City (2026)
Effective short term rental pricing strategy in Chihuahua City involves understanding monthly ADR fluctuations. The Average Daily Rate (ADR) for Airbnb in Chihuahua City typically peaks in August and dips lowest during April. Leveraging Airbnb dynamic pricing tools or strategies based on this seasonality can significantly boost revenue. Here's a look at the typical nightly rates achieved:
- Best-in-class properties (Top 10%) command rates of $85+ per night, often due to premium features or locations.
- Strong performing properties (Top 25%) achieve nightly rates of $60 or more.
- Typical properties (Median) charge around $42 per night.
- Entry-level properties (Bottom 25%) earn around $32 per night.
Average Daily Rate (ADR) Trend by Month in Chihuahua City
Get Live Chihuahua City Market Intelligence 👇

Explore Real-time Analytics
Airbnb Seasonality Analysis & Trends in Chihuahua City (2026)
Peak Season (December, August, July)
- Revenue averages $711 per month
- Occupancy rates average 40.2%
- Daily rates average $57
Shoulder Season
- Revenue averages $629 per month
- Occupancy maintains around 39.2%
- Daily rates hold near $54
Low Season (January, February, April)
- Revenue drops to average $507 per month
- Occupancy decreases to average 34.7%
- Daily rates adjust to average $53
Seasonality Insights for Chihuahua City
- The Airbnb seasonality in Chihuahua City shows moderate seasonality with distinct peak and low periods. While the sections above show seasonal averages, it's also insightful to look at the extremes:
- During the high season, the absolute peak month showcases Chihuahua City's highest earning potential, with monthly revenues capable of climbing to $718, occupancy reaching a high of 41.6%, and ADRs peaking at $57.
- Conversely, the slowest single month of the year, typically falling within the low season, marks the market's lowest point. In this month, revenue might dip to $482, occupancy could drop to 29.6%, and ADRs may adjust down to $51.
- Understanding both the seasonal averages and these monthly peaks and troughs in revenue, occupancy, and ADR is crucial for maximizing your Airbnb profit potential in Chihuahua City.
Seasonal Strategies for Maximizing Profit
- Peak Season: Maximize revenue through premium pricing and potentially longer minimum stays. Ensure high availability.
- Low Season: Offer competitive pricing, special promotions (e.g., extended stay discounts), and flexible cancellation policies. Target off-season travelers like remote workers or budget-conscious guests.
- Shoulder Seasons: Implement dynamic pricing that balances peak and low rates. Target weekend travelers or specific events. Offer slightly more flexible terms than peak season.
- Regularly analyze your own performance against these Chihuahua City seasonality benchmarks and adjust your pricing and availability strategy accordingly.
Best Areas for Airbnb Investment in Chihuahua City (2026)
Exploring the top neighborhoods for short-term rentals in Chihuahua City? This section highlights key areas, outlining why they are attractive for hosts and guests, along with notable local attractions. Consider these locations based on your target guest profile and investment strategy.
| Neighborhood / Area | Why Host Here? (Target Guests & Appeal) | Key Attractions & Landmarks |
|---|---|---|
| Centro Histórico | The historic center of Chihuahua City offers a rich cultural experience with its colonial architecture, museums, and vibrant plazas. Ideal for tourists who want to immerse themselves in history and local culture. | Chihuahua Cathedral, Palacio de Gobierno, Museo Casa de Juárez, Plaza de Armas, Teatro de la Ciudad, Museo Semilla |
| San Felipe | A growing neighborhood that combines residential and commercial areas, San Felipe is popular among families and young professionals. It has good amenities and is conveniently located to main roads. | Parque San Felipe, Centro Comercial San Felipe, Universidad Autónoma de Chihuahua, Local cafes and restaurants |
| La Cuarta | Known for its lively atmosphere and trendy spots, La Cuarta has become a hotspot for younger crowds due to its restaurants, bars, and proximity to cultural events. | Cinepolis La Cuarta, Plaza Del Angel, Cafés and nightlife in the area, Parque El Reliz |
| Chihuahua 2000 | A modern neighborhood offering spacious avenues and green areas, attracting families and professionals looking for a quieter environment while still being close to the city's amenities. | Parque Científico y Tecnológico, Centro de Convenciones, Museo de la Revolución, Restaurants and shopping centers nearby |
| Barrio de San Lorenzo | An artsy neighborhood with a bohemian vibe, perfect for creative travelers and those interested in local art, music, and food scenes. Rich in history and charm. | Casa Chihuahua, Art galleries, Local artisan shops, San Lorenzo Temple |
| Paseo Central | A commercial hub that draws both locals and visitors, Paseo Central is a great spot for shopping and entertainment, making it convenient for short-term rentals. | Paseo Central Mall, Restaurants and cafes along the main avenue, Cinemex, Fitness centers and parks nearby |
| Las Granjas | A quiet, residential area that offers a family-friendly atmosphere with parks and local schools, making it attractive for long-term rental investments. | Parque Las Granjas, Local grocery stores, Nearby schools, Community centers |
| Santa Rosa | A suburban area with a blend of residential and commercial developments, Santa Rosa is appealing for families and those looking for a peaceful, yet connected life. | Plaza Santa Rosa, Local markets, Parks and outdoor activities, Easy access to main roads and amenities |
Understanding Airbnb License Requirements & STR Laws in Chihuahua City (2026)
While Chihuahua City, Chihuahua, Mexico currently shows low STR regulations, specific Airbnb license requirements might still exist or change. Always verify the latest short term rental regulations and Airbnb license requirements directly with local government authorities for Chihuahua City to ensure full compliance before hosting.
(Source: AirROI data, 2026, finding no licensed listings among those analyzed)
Top Performing Airbnb Properties in Chihuahua City (2026)
Benchmark your potential! Explore examples of top-performing Airbnb properties in Chihuahua Citybased on Trailing Twelve Month (TTM) revenue. Analyze their characteristics, revenue, occupancy rate, and ADR to understand what drives success in this market.
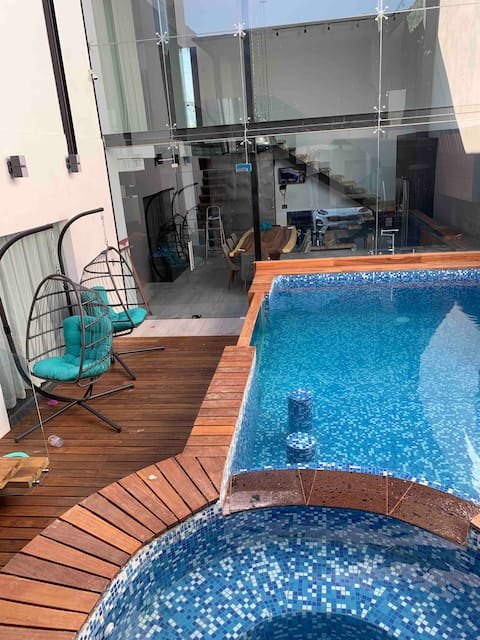
Beautiful central house with heated pool
Entire Place • 3 bedrooms
*Casa Barbago* House with a pool
Entire Place • 2 bedrooms

Casa Rebeca 3, Entire House
Entire Place • 6 bedrooms

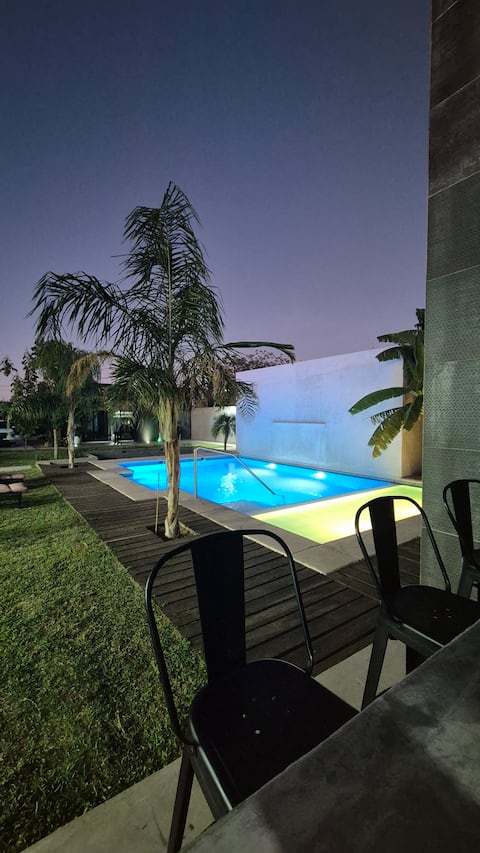
Luxurious house with a private pool
Entire Place • 3 bedrooms

16th floor Distrito Uno w/Restaurant&Bar services
Entire Place • 1 bedroom

Gutierrez Residence
Entire Place • 3 bedrooms
Note: Performance varies based on location, size, amenities, seasonality, and management quality. Data reflects the past 12 months.
Top Performing Airbnb Hosts in Chihuahua City (2026)
Learn from the best! This table showcases top-performing Airbnb hosts in Chihuahua City based on the number of properties managed and estimated total revenue over the past year. Analyze their scale and performance metrics.
| Host Name | Properties | Grossing Revenue | Stay Reviews | Avg Rating |
|---|---|---|---|---|
| Liz | 14 | $112,151 | 857 | 4.72/5.0 |
| Laura | 10 | $89,096 | 2022 | 4.88/5.0 |
| Evelyn | 1 | $88,362 | 19 | 5.00/5.0 |
| Karla Iveth | 10 | $75,942 | 916 | 4.91/5.0 |
| Paty Y Mauro | 16 | $65,898 | 2781 | 4.80/5.0 |
| Eduardo | 6 | $64,837 | 395 | 4.55/5.0 |
| Tania | 5 | $55,453 | 820 | 4.94/5.0 |
| Daniel | 4 | $53,026 | 482 | 4.88/5.0 |
| Anabel | 3 | $51,049 | 396 | 4.81/5.0 |
| Jorge | 3 | $50,561 | 126 | 4.79/5.0 |
Analyzing the strategies of top hosts, such as their property selection, pricing, and guest communication, can offer valuable lessons for optimizing your own Airbnb operations in Chihuahua City.
Dive Deeper: Advanced Chihuahua City STR Market Data (2026)
Ready to unlock more insights? AirROI provides access to advanced metrics and comprehensive Airbnb data for Chihuahua City. Explore detailed analytics beyond this report to refine your investment strategy, optimize pricing, and maximize your vacation rental profits.
Explore Advanced MetricsChihuahua City Short-Term Rental Market Composition (2026): Property & Room Types
Room Type Distribution
Property Type Distribution
Market Composition Insights for Chihuahua City
- The Chihuahua City Airbnb market composition is heavily skewed towards Entire Home/Apt listings, which make up 92.3% of the 853 active rentals. This indicates strong guest preference for privacy and space.
- Looking at the property type distribution in Chihuahua City, Apartment/Condo properties are the most common (63%), reflecting the local real estate landscape.
- Houses represent a significant 31.3% portion, catering likely to families or larger groups.
- Smaller segments like hotel/boutique, others, outdoor/unique (combined 5.8%) offer potential for unique stay experiences.
Chihuahua City Airbnb Room Capacity Analysis (2026): Bedroom Distribution
Distribution of Listings by Number of Bedrooms
Room Capacity Insights for Chihuahua City
- The dominant room capacity in Chihuahua City is 1 bedroom listings, making up 50.3% of the market. This suggests a strong demand for properties suitable for couples or solo travelers.
- Together, 1 bedroom and 2 bedrooms properties represent 77.0% of the active Airbnb listings in Chihuahua City, indicating a high concentration in these sizes.
- With over half the market (50.3%) consisting of studios or 1-bedroom units, Chihuahua City is particularly well-suited for individuals or couples.
Chihuahua City Vacation Rental Guest Capacity Trends (2026)
Distribution of Listings by Guest Capacity
Guest Capacity Insights for Chihuahua City
- The most common guest capacity trend in Chihuahua City vacation rentals is listings accommodating 2 guests (31.1%). This suggests the primary traveler segment is likely couples or solo travelers.
- Properties designed for 2 guests and 4 guests dominate the Chihuahua City STR market, accounting for 53.6% of listings.
- 21.9% of properties accommodate 6+ guests, serving the market segment for larger families or group travel in Chihuahua City.
- On average, properties in Chihuahua City are equipped to host 3.8 guests.
Chihuahua City Airbnb Booking Patterns (2026): Available vs. Booked Days
Available Days Distribution
Booked Days Distribution
Booking Pattern Insights for Chihuahua City
- The most common availability pattern in Chihuahua City falls within the 271-366 days range, representing 45.4% of listings. This suggests many properties have significant open periods on their calendars.
- Approximately 84.6% of listings show high availability (181+ days open annually), indicating potential for increased bookings or specific owner usage patterns.
- For booked days, the 91-180 days range is most frequent in Chihuahua City (39.2%), reflecting common guest stay durations or potential owner blocking patterns.
- A notable 16.9% of properties secure long booking periods (181+ days booked per year), highlighting successful long-term rental strategies or significant owner usage.
Chihuahua City Airbnb Minimum Stay Requirements Analysis
Distribution of Listings by Minimum Night Requirement
1 Night
407 listings
47.7% of total
2 Nights
239 listings
28% of total
3 Nights
47 listings
5.5% of total
4-6 Nights
19 listings
2.2% of total
7-29 Nights
7 listings
0.8% of total
30+ Nights
134 listings
15.7% of total
Key Insights
- The most prevalent minimum stay requirement in Chihuahua City is 1 Night, adopted by 47.7% of listings. This highlights the market's preference for shorter, flexible bookings.
- A strong majority (75.7%) of the Chihuahua City Airbnb data shows acceptance of very short stays (1-2 nights), indicating a dynamic, high-turnover market.
- A significant segment (15.7%) caters to monthly stays (30+ nights) in Chihuahua City, pointing to opportunities in the extended-stay market.
Recommendations
- Align with the market by considering a 1 Night minimum stay, as 47.7% of Chihuahua City hosts use this setting.
- Explore offering discounts for stays of 30+ nights to attract the 15.7% of the market seeking extended stays.
- Adjust minimum nights based on seasonality – potentially shorter during low season and longer during peak demand periods in Chihuahua City.
Chihuahua City Airbnb Cancellation Policy Trends Analysis (2026)
Limited
18 listings
2.1% of total
Flexible
342 listings
40.1% of total
Moderate
256 listings
30% of total
Firm
154 listings
18.1% of total
Strict
83 listings
9.7% of total
Cancellation Policy Insights for Chihuahua City
- The prevailing Airbnb cancellation policy trend in Chihuahua City is Flexible, used by 40.1% of listings.
- The market strongly favors guest-friendly terms, with 70.1% of listings offering Flexible or Moderate policies. This suggests guests in Chihuahua City may expect booking flexibility.
- Strict cancellation policies are quite rare (9.7%), potentially making listings with this policy less competitive unless justified by high demand or property type.
Recommendations for Hosts
- Consider adopting a Flexible policy to align with the 40.1% market standard in Chihuahua City.
- Using a Strict policy might deter some guests, as only 9.7% of listings use it. Evaluate if potential revenue protection outweighs possible lower booking rates.
- Regularly review your cancellation policy against competitors and market demand shifts in Chihuahua City.
Chihuahua City STR Booking Lead Time Analysis (2026)
Average Booking Lead Time by Month
Booking Lead Time Insights for Chihuahua City
- The overall average booking lead time for vacation rentals in Chihuahua City is 15 days.
- Guests book furthest in advance for stays during December (average 18 days), likely coinciding with peak travel demand or local events.
- The shortest booking windows occur for stays in February (average 8 days), indicating more last-minute travel plans during this time.
- Seasonally, Summer (14 days avg.) sees the longest lead times, while Winter (12 days avg.) has the shortest, reflecting typical travel planning cycles.
Recommendations for Hosts
- Use the overall average lead time (15 days) as a baseline for your pricing and availability strategy in Chihuahua City.
- Target marketing efforts for the Summer season well in advance (at least 14 days) to capture early planners.
- Monitor your own booking lead times against these Chihuahua City averages to identify opportunities for dynamic pricing adjustments.
Popular & Essential Airbnb Amenities in Chihuahua City (2026)
Amenity Prevalence
Amenity Insights for Chihuahua City
- Essential amenities in Chihuahua City that guests expect include: Wifi, TV, Air conditioning. Lacking these (any) could significantly impact bookings.
- Popular amenities like Hot water, Kitchen, Dishes and silverware are common but not universal. Offering these can provide a competitive edge.
Recommendations for Hosts
- Ensure your listing includes all essential amenities for Chihuahua City: Wifi, TV, Air conditioning.
- Prioritize adding missing essentials: Wifi, TV, Air conditioning.
- Consider adding popular differentiators like Hot water or Kitchen to increase appeal.
- Highlight unique or less common amenities you offer (e.g., hot tub, dedicated workspace, EV charger) in your listing description and photos.
- Regularly check competitor amenities in Chihuahua City to stay competitive.
Chihuahua City Airbnb Guest Demographics & Profile Analysis (2026)
Guest Profile Summary for Chihuahua City
- The typical guest profile for Airbnb in Chihuahua City consists of primarily domestic travelers (79%), often arriving from nearby Chihuahua, typically belonging to the Post-2000s (Gen Z/Alpha) group (50%), primarily speaking Spanish or English.
- Domestic travelers account for 79.1% of guests.
- Key international markets include Mexico (79.1%) and United States (18.1%).
- Top languages spoken are Spanish (57.3%) followed by English (36.7%).
- A significant demographic segment is the Post-2000s (Gen Z/Alpha) group, representing 50% of guests.
Recommendations for Hosts
- Target domestic marketing efforts towards travelers from Chihuahua and Ciudad Juárez.
- Tailor amenities and listing descriptions to appeal to the dominant Post-2000s (Gen Z/Alpha) demographic (e.g., highlight fast WiFi, smart home features, local guides).
- Highlight unique local experiences or amenities relevant to the primary guest profile.
- Consider seasonal promotions aligned with peak travel times for key origin markets.
Nearby Short-Term Rental Market Comparison
How does the Chihuahua City Airbnb market stack up against its neighbors? Compare key performance metrics like average monthly revenue, ADR, and occupancy rates in surrounding areas to understand the broader regional STR landscape.
| Market | Active Properties | Monthly Revenue | Daily Rate | Avg. Occupancy |
|---|---|---|---|---|
| Santa Isabel | 10 | $642 | $128.94 | 22% |
| Creel | 189 | $484 | $128.78 | 18% |
| Camargo | 18 | $452 | $60.97 | 31% |
| Urique | 10 | $420 | $110.22 | 16% |
| Chihuahua | 135 | $390 | $71.50 | 29% |
| Cuauhtémoc | 62 | $369 | $57.76 | 26% |
| Delicias | 102 | $334 | $62.78 | 27% |
| San Juanito | 14 | $306 | $128.49 | 15% |