Mexico City Airbnb Market Analysis 2026: Short Term Rental Data & Vacation Rental Statistics in Ciudad de México, Mexico
Is Airbnb profitable in Mexico City in 2026? Explore comprehensive Airbnb analytics for Mexico City, Ciudad de México, Mexico to uncover income potential. This 2026 STR market report for Mexico City, based on AirROI data from February 2025 to January 2026, reveals key trends in the bustling market of 19,365 active listings.
Whether you're considering an Airbnb investment in Mexico City, optimizing your existing vacation rental, or exploring rental arbitrage opportunities, understanding the Mexico City Airbnb data is crucial. Leveraging the low regulation environment is key to maximizing your short term rental income potential. Let's dive into the specifics.
Key Mexico City Airbnb Performance Metrics Overview
Monthly Airbnb Revenue Variations & Income Potential in Mexico City (2026)
Understanding the monthly revenue variations for Airbnb listings in Mexico City is key to maximizing your short term rental income potential. Seasonality significantly impacts earnings. Our analysis, based on data from the past 12 months, shows that the peak revenue month for STRs in Mexico City is typically December, while June often presents the lowest earnings, highlighting opportunities for strategic pricing adjustments during shoulder and low seasons. Explore the typical Airbnb income in Mexico City across different performance tiers:
- Best-in-class properties (Top 10%) achieve $3,379+ monthly, often utilizing dynamic pricing and superior guest experiences.
- Strong performing properties (Top 25%) earn $1,970 or more, indicating effective management and desirable locations/amenities.
- Typical properties (Median) generate around $1,042 per month, representing the average market performance.
- Entry-level properties (Bottom 25%) see earnings around $467, often with potential for optimization.
Average Monthly Airbnb Earnings Trend in Mexico City
Mexico City Airbnb Occupancy Rate Trends (2026)
Maximize your bookings by understanding the Mexico City STR occupancy trends. Seasonal demand shifts significantly influence how often properties are booked. Typically, Marchsees the highest demand (peak season occupancy), while January experiences the lowest (low season). Effective strategies, like adjusting minimum stays or offering promotions, can boost occupancy during slower periods. Here's how different property tiers perform in Mexico City:
- Best-in-class properties (Top 10%) achieve 88%+ occupancy, indicating high desirability and potentially optimized availability.
- Strong performing properties (Top 25%) maintain 76% or higher occupancy, suggesting good market fit and guest satisfaction.
- Typical properties (Median) have an occupancy rate around 54%.
- Entry-level properties (Bottom 25%) average 27% occupancy, potentially facing higher vacancy.
Average Monthly Occupancy Rate Trend in Mexico City
Average Daily Rate (ADR) Airbnb Trends in Mexico City (2026)
Effective short term rental pricing strategy in Mexico City involves understanding monthly ADR fluctuations. The Average Daily Rate (ADR) for Airbnb in Mexico City typically peaks in October and dips lowest during March. Leveraging Airbnb dynamic pricing tools or strategies based on this seasonality can significantly boost revenue. Here's a look at the typical nightly rates achieved:
- Best-in-class properties (Top 10%) command rates of $177+ per night, often due to premium features or locations.
- Strong performing properties (Top 25%) achieve nightly rates of $107 or more.
- Typical properties (Median) charge around $65 per night.
- Entry-level properties (Bottom 25%) earn around $39 per night.
Average Daily Rate (ADR) Trend by Month in Mexico City
Get Live Mexico City Market Intelligence 👇
Explore Real-time Analytics
Airbnb Seasonality Analysis & Trends in Mexico City (2026)
Peak Season (December, October, November)
- Revenue averages $1,976 per month
- Occupancy rates average 53.9%
- Daily rates average $109
Shoulder Season
- Revenue averages $1,547 per month
- Occupancy maintains around 52.7%
- Daily rates hold near $93
Low Season (May, June, August)
- Revenue drops to average $1,396 per month
- Occupancy decreases to average 47.3%
- Daily rates adjust to average $90
Seasonality Insights for Mexico City
- The Airbnb seasonality in Mexico City shows moderate seasonality with distinct peak and low periods. While the sections above show seasonal averages, it's also insightful to look at the extremes:
- During the high season, the absolute peak month showcases Mexico City's highest earning potential, with monthly revenues capable of climbing to $2,008, occupancy reaching a high of 61.0%, and ADRs peaking at $111.
- Conversely, the slowest single month of the year, typically falling within the low season, marks the market's lowest point. In this month, revenue might dip to $1,368, occupancy could drop to 43.0%, and ADRs may adjust down to $88.
- Understanding both the seasonal averages and these monthly peaks and troughs in revenue, occupancy, and ADR is crucial for maximizing your Airbnb profit potential in Mexico City.
Seasonal Strategies for Maximizing Profit
- Peak Season: Maximize revenue through premium pricing and potentially longer minimum stays. Ensure high availability.
- Low Season: Offer competitive pricing, special promotions (e.g., extended stay discounts), and flexible cancellation policies. Target off-season travelers like remote workers or budget-conscious guests.
- Shoulder Seasons: Implement dynamic pricing that balances peak and low rates. Target weekend travelers or specific events. Offer slightly more flexible terms than peak season.
- Regularly analyze your own performance against these Mexico City seasonality benchmarks and adjust your pricing and availability strategy accordingly.
Best Areas for Airbnb Investment in Mexico City (2026)
Exploring the top neighborhoods for short-term rentals in Mexico City? This section highlights key areas, outlining why they are attractive for hosts and guests, along with notable local attractions. Consider these locations based on your target guest profile and investment strategy.
| Neighborhood / Area | Why Host Here? (Target Guests & Appeal) | Key Attractions & Landmarks |
|---|---|---|
| Roma Norte | Cultural heart of Mexico City with historic architecture, bustling cafes, and a vibrant arts scene. It's popular among young people and tourists looking for a trendy and lively atmosphere. | Paseo de la Reforma, Parque México, Street art, Museo del Chocolate, Hip bars and restaurants |
| Condesa | Charming and leafy neighborhood known for its Art Nouveau architecture and cultural hotspots. It attracts tourists and locals alike who enjoy an upscale, relaxed lifestyle with plenty of parks. | Parque España, Parque México, Cafes and bars, Art galleries, Local boutiques |
| Polanco | Exclusive and upscale district, home to high-end shopping, luxury hotels, and gourmet dining. It appeals to affluent travelers seeking a high-quality experience and proximity to cultural sites. | Soumaya Museum, Antara Fashion Hall, Chapultepec Forest, Luxury boutiques |
| Coyoacán | Famous for its colonial architecture and artistic history, it offers a more traditional Mexican experience. Attracts visitors interested in culture and history, including fans of Frida Kahlo. | Frida Kahlo Museum, Coyoacán Market, Leon Trotsky Museum, Centennial Garden |
| Centro Histórico | The historical center of Mexico City, rich in history and architecture, with many attractions within walking distance. It's ideal for tourists who want to explore the city's heritage. | Zócalo, Metropolitan Cathedral, Palacio de Bellas Artes, Templo Mayor |
| Santa Fe | Modern corporate hub with high-rise buildings and shopping centers. It attracts business travelers and those seeking contemporary amenities in a bustling part of the city. | Centro Santa Fe Mall, Santa Fe Corporate Towers, Bosque de Chapultepec, Luxury hotels |
| Tlalpan | A quieter area known for its parks and natural beauty. It attracts visitors who want to escape the hustle of the city and enjoy outdoor activities. | Parque de los Ejés, Cultural Center, Museums, Local market |
| Chapultepec | Large urban park that offers a mix of nature and culture. It's perfect for those who love outdoor activities and visiting museums, and it draws both local residents and tourists. | Chapultepec Castle, National Museum of History, Chapultepec Park, Lake |
Understanding Airbnb License Requirements & STR Laws in Mexico City (2026)
While Mexico City, Ciudad de México, Mexico currently shows low STR regulations, specific Airbnb license requirements might still exist or change. Always verify the latest short term rental regulations and Airbnb license requirements directly with local government authorities for Mexico City to ensure full compliance before hosting.
(Source: AirROI data, 2026, based on 0% licensed listings)
Top Performing Airbnb Properties in Mexico City (2026)
Benchmark your potential! Explore examples of top-performing Airbnb properties in Mexico Citybased on Trailing Twelve Month (TTM) revenue. Analyze their characteristics, revenue, occupancy rate, and ADR to understand what drives success in this market.
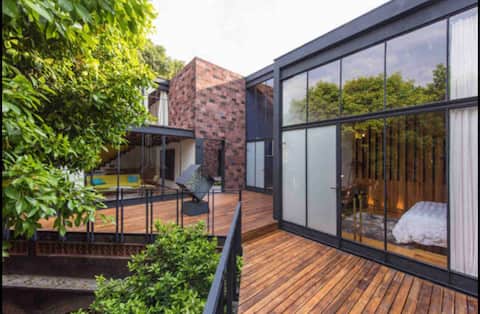
House and patio with artistic value for 22 guests
Entire Place • 11 bedrooms
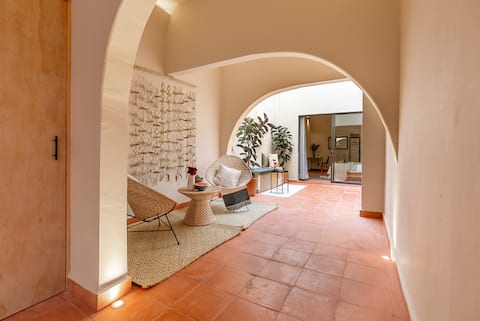
Mexican Desgn Villa Pvt. Roofgardn (A/C ALL Bdrms)
Entire Place • 9 bedrooms

Luxurious Villa with 9 BR and HUGE Terrace Condesa
Entire Place • 9 bedrooms

20 Guest Full Condo: 10BR/10BA w/private Rooftop.
Entire Place • 10 bedrooms
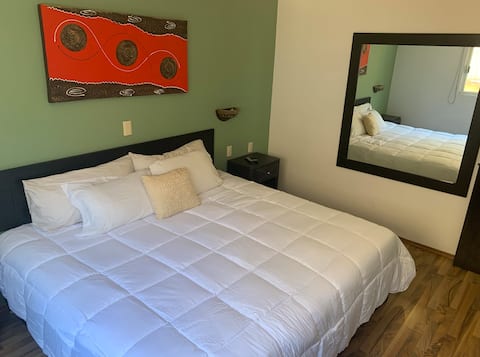
Charming Suite 10 feet away Presidente Masaryk
Entire Place • 1 bedroom
Breathtaking Mansion HUGE Rooftop w/4AC Condesa
Entire Place • 9 bedrooms
Note: Performance varies based on location, size, amenities, seasonality, and management quality. Data reflects the past 12 months.
Top Performing Airbnb Hosts in Mexico City (2026)
Learn from the best! This table showcases top-performing Airbnb hosts in Mexico City based on the number of properties managed and estimated total revenue over the past year. Analyze their scale and performance metrics.
| Host Name | Properties | Grossing Revenue | Stay Reviews | Avg Rating |
|---|---|---|---|---|
| Mr. W | 175 | $6,715,048 | 7331 | 4.76/5.0 |
| Remy | 46 | $5,630,108 | 2496 | 4.84/5.0 |
| Dave And Nat | 51 | $4,850,605 | 3214 | 4.85/5.0 |
| Juan | 170 | $3,958,292 | 10025 | 4.66/5.0 |
| Host Me Tender | 95 | $3,522,090 | 10966 | 4.81/5.0 |
| Blueground | 215 | $3,404,929 | 4832 | 4.54/5.0 |
| Clau | 161 | $3,187,096 | 16086 | 4.66/5.0 |
| Capitalia | 98 | $3,006,429 | 5248 | 4.78/5.0 |
| Arely | 74 | $2,437,336 | 5060 | 4.80/5.0 |
| Kasava Homes | 76 | $2,410,221 | 4827 | 4.71/5.0 |
Analyzing the strategies of top hosts, such as their property selection, pricing, and guest communication, can offer valuable lessons for optimizing your own Airbnb operations in Mexico City.
Dive Deeper: Advanced Mexico City STR Market Data (2026)
Ready to unlock more insights? AirROI provides access to advanced metrics and comprehensive Airbnb data for Mexico City. Explore detailed analytics beyond this report to refine your investment strategy, optimize pricing, and maximize your vacation rental profits.
Explore Advanced MetricsMexico City Short-Term Rental Market Composition (2026): Property & Room Types
Room Type Distribution
Property Type Distribution
Market Composition Insights for Mexico City
- The Mexico City Airbnb market composition is heavily skewed towards Entire Home/Apt listings, which make up 71.3% of the 19,365 active rentals. This indicates strong guest preference for privacy and space.
- Looking at the property type distribution in Mexico City, Apartment/Condo properties are the most common (78.4%), reflecting the local real estate landscape.
- The presence of 7.1% Hotel/Boutique listings indicates integration with traditional hospitality.
- Smaller segments like others, unique stays, outdoor/unique (combined 2.6%) offer potential for unique stay experiences.
Mexico City Airbnb Room Capacity Analysis (2026): Bedroom Distribution
Distribution of Listings by Number of Bedrooms
Room Capacity Insights for Mexico City
- The dominant room capacity in Mexico City is 1 bedroom listings, making up 41.1% of the market. This suggests a strong demand for properties suitable for couples or solo travelers.
- Together, 1 bedroom and 2 bedrooms properties represent 68.2% of the active Airbnb listings in Mexico City, indicating a high concentration in these sizes.
Mexico City Vacation Rental Guest Capacity Trends (2026)
Distribution of Listings by Guest Capacity
Guest Capacity Insights for Mexico City
- The most common guest capacity trend in Mexico City vacation rentals is listings accommodating 2 guests (27.4%). This suggests the primary traveler segment is likely couples or solo travelers.
- Properties designed for 2 guests and 4 guests dominate the Mexico City STR market, accounting for 49.1% of listings.
- 14.2% of properties accommodate 6+ guests, serving the market segment for larger families or group travel in Mexico City.
- On average, properties in Mexico City are equipped to host 2.9 guests.
Mexico City Airbnb Booking Patterns (2026): Available vs. Booked Days
Available Days Distribution
Booked Days Distribution
Booking Pattern Insights for Mexico City
- The most common availability pattern in Mexico City falls within the 271-366 days range, representing 35.3% of listings. This suggests many properties have significant open periods on their calendars.
- Approximately 62.5% of listings show high availability (181+ days open annually), indicating potential for increased bookings or specific owner usage patterns.
- For booked days, the 91-180 days range is most frequent in Mexico City (27.4%), reflecting common guest stay durations or potential owner blocking patterns.
- A notable 38.7% of properties secure long booking periods (181+ days booked per year), highlighting successful long-term rental strategies or significant owner usage.
Mexico City Airbnb Minimum Stay Requirements Analysis
Distribution of Listings by Minimum Night Requirement
1 Night
8393 listings
43.4% of total
2 Nights
4210 listings
21.8% of total
3 Nights
1225 listings
6.3% of total
4-6 Nights
934 listings
4.8% of total
7-29 Nights
549 listings
2.8% of total
30+ Nights
4036 listings
20.9% of total
Key Insights
- The most prevalent minimum stay requirement in Mexico City is 1 Night, adopted by 43.4% of listings. This highlights the market's preference for shorter, flexible bookings.
- A strong majority (65.2%) of the Mexico City Airbnb data shows acceptance of very short stays (1-2 nights), indicating a dynamic, high-turnover market.
- A significant segment (20.9%) caters to monthly stays (30+ nights) in Mexico City, pointing to opportunities in the extended-stay market.
Recommendations
- Align with the market by considering a 1 Night minimum stay, as 43.4% of Mexico City hosts use this setting.
- Explore offering discounts for stays of 30+ nights to attract the 20.9% of the market seeking extended stays.
- Adjust minimum nights based on seasonality – potentially shorter during low season and longer during peak demand periods in Mexico City.
Mexico City Airbnb Cancellation Policy Trends Analysis (2026)
Super Strict 60 Days
53 listings
0.3% of total
Super Strict 30 Days
38 listings
0.2% of total
Limited
284 listings
1.5% of total
Flexible
6320 listings
32.7% of total
Moderate
6318 listings
32.7% of total
Firm
4700 listings
24.3% of total
Strict
1608 listings
8.3% of total
Cancellation Policy Insights for Mexico City
- The prevailing Airbnb cancellation policy trend in Mexico City is Flexible, used by 32.7% of listings.
- There's a relatively balanced mix between guest-friendly (65.4%) and stricter (32.6%) policies, offering choices for different guest needs.
- Strict cancellation policies are quite rare (8.3%), potentially making listings with this policy less competitive unless justified by high demand or property type.
Recommendations for Hosts
- Consider adopting a Flexible policy to align with the 32.7% market standard in Mexico City.
- Using a Strict policy might deter some guests, as only 8.3% of listings use it. Evaluate if potential revenue protection outweighs possible lower booking rates.
- Regularly review your cancellation policy against competitors and market demand shifts in Mexico City.
Mexico City STR Booking Lead Time Analysis (2026)
Average Booking Lead Time by Month
Booking Lead Time Insights for Mexico City
- The overall average booking lead time for vacation rentals in Mexico City is 30 days.
- Guests book furthest in advance for stays during October (average 47 days), likely coinciding with peak travel demand or local events.
- The shortest booking windows occur for stays in June (average 23 days), indicating more last-minute travel plans during this time.
- Seasonally, Fall (38 days avg.) sees the longest lead times, while Summer (25 days avg.) has the shortest, reflecting typical travel planning cycles.
Recommendations for Hosts
- Use the overall average lead time (30 days) as a baseline for your pricing and availability strategy in Mexico City.
- For October stays, consider implementing length-of-stay discounts or slightly higher rates for bookings made less than 47 days out to capitalize on advance planning.
- Target marketing efforts for the Fall season well in advance (at least 38 days) to capture early planners.
- Monitor your own booking lead times against these Mexico City averages to identify opportunities for dynamic pricing adjustments.
Popular & Essential Airbnb Amenities in Mexico City (2026)
Amenity Prevalence
Amenity Insights for Mexico City
- Essential amenities in Mexico City that guests expect include: Wifi. Lacking these (this) could significantly impact bookings.
- Popular amenities like Hot water, TV, Kitchen are common but not universal. Offering these can provide a competitive edge.
Recommendations for Hosts
- Ensure your listing includes all essential amenities for Mexico City: Wifi.
- Prioritize adding missing essentials: Wifi.
- Consider adding popular differentiators like Hot water or TV to increase appeal.
- Highlight unique or less common amenities you offer (e.g., hot tub, dedicated workspace, EV charger) in your listing description and photos.
- Regularly check competitor amenities in Mexico City to stay competitive.
Mexico City Airbnb Guest Demographics & Profile Analysis (2026)
Guest Profile Summary for Mexico City
- The typical guest profile for Airbnb in Mexico City consists of a mix of domestic (48%) and international guests, with top international origins including United States, typically belonging to the Post-2000s (Gen Z/Alpha) group (50%), primarily speaking English or Spanish.
- Domestic travelers account for 48.0% of guests.
- Key international markets include Mexico (48%) and United States (33.3%).
- Top languages spoken are English (41.9%) followed by Spanish (41.6%).
- A significant demographic segment is the Post-2000s (Gen Z/Alpha) group, representing 50% of guests.
Recommendations for Hosts
- Balance marketing efforts between domestic and international channels based on the guest mix.
- Tailor amenities and listing descriptions to appeal to the dominant Post-2000s (Gen Z/Alpha) demographic (e.g., highlight fast WiFi, smart home features, local guides).
- Highlight unique local experiences or amenities relevant to the primary guest profile.
- Consider seasonal promotions aligned with peak travel times for key origin markets.
Nearby Short-Term Rental Market Comparison
How does the Mexico City Airbnb market stack up against its neighbors? Compare key performance metrics like average monthly revenue, ADR, and occupancy rates in surrounding areas to understand the broader regional STR landscape.
| Market | Active Properties | Monthly Revenue | Daily Rate | Avg. Occupancy |
|---|---|---|---|---|
| El Santuario | 44 | $2,583 | $420.27 | 25% |
| Cerro Gordo | 38 | $2,183 | $438.64 | 21% |
| Tepeji del Rio de Ocampo | 11 | $2,125 | $315.80 | 27% |
| Yautepec de Zaragoza | 16 | $2,032 | $269.32 | 26% |
| Xalmolonco | 24 | $1,944 | $281.85 | 28% |
| Avandaro | 212 | $1,892 | $411.24 | 24% |
| Rancho San Diego | 21 | $1,707 | $276.31 | 26% |
| Lomas de Cocoyoc | 137 | $1,662 | $258.05 | 28% |
| La Tortuga | 71 | $1,658 | $239.12 | 28% |
| La Ladrillera | 28 | $1,655 | $277.53 | 26% |