Arteaga Airbnb Market Analysis 2026: Short Term Rental Data & Vacation Rental Statistics in Coahuila, Mexico
Is Airbnb profitable in Arteaga in 2026? Explore comprehensive Airbnb analytics for Arteaga, Coahuila, Mexico to uncover income potential. This 2026 STR market report for Arteaga, based on AirROI data from February 2025 to January 2026, reveals key trends in the niche market of 86 active listings.
Whether you're considering an Airbnb investment in Arteaga, optimizing your existing vacation rental, or exploring rental arbitrage opportunities, understanding the Arteaga Airbnb data is crucial. Leveraging the low regulation environment is key to maximizing your short term rental income potential. Let's dive into the specifics.
Key Arteaga Airbnb Performance Metrics Overview
Monthly Airbnb Revenue Variations & Income Potential in Arteaga (2026)
Understanding the monthly revenue variations for Airbnb listings in Arteaga is key to maximizing your short term rental income potential. Seasonality significantly impacts earnings. Our analysis, based on data from the past 12 months, shows that the peak revenue month for STRs in Arteaga is typically December, while June often presents the lowest earnings, highlighting opportunities for strategic pricing adjustments during shoulder and low seasons. Explore the typical Airbnb income in Arteaga across different performance tiers:
- Best-in-class properties (Top 10%) achieve $5,239+ monthly, often utilizing dynamic pricing and superior guest experiences.
- Strong performing properties (Top 25%) earn $2,038 or more, indicating effective management and desirable locations/amenities.
- Typical properties (Median) generate around $930 per month, representing the average market performance.
- Entry-level properties (Bottom 25%) see earnings around $433, often with potential for optimization.
Average Monthly Airbnb Earnings Trend in Arteaga
Arteaga Airbnb Occupancy Rate Trends (2026)
Maximize your bookings by understanding the Arteaga STR occupancy trends. Seasonal demand shifts significantly influence how often properties are booked. Typically, Decembersees the highest demand (peak season occupancy), while January experiences the lowest (low season). Effective strategies, like adjusting minimum stays or offering promotions, can boost occupancy during slower periods. Here's how different property tiers perform in Arteaga:
- Best-in-class properties (Top 10%) achieve 64%+ occupancy, indicating high desirability and potentially optimized availability.
- Strong performing properties (Top 25%) maintain 35% or higher occupancy, suggesting good market fit and guest satisfaction.
- Typical properties (Median) have an occupancy rate around 19%.
- Entry-level properties (Bottom 25%) average 9% occupancy, potentially facing higher vacancy.
Average Monthly Occupancy Rate Trend in Arteaga
Average Daily Rate (ADR) Airbnb Trends in Arteaga (2026)
Effective short term rental pricing strategy in Arteaga involves understanding monthly ADR fluctuations. The Average Daily Rate (ADR) for Airbnb in Arteaga typically peaks in December and dips lowest during March. Leveraging Airbnb dynamic pricing tools or strategies based on this seasonality can significantly boost revenue. Here's a look at the typical nightly rates achieved:
- Best-in-class properties (Top 10%) command rates of $442+ per night, often due to premium features or locations.
- Strong performing properties (Top 25%) achieve nightly rates of $252 or more.
- Typical properties (Median) charge around $165 per night.
- Entry-level properties (Bottom 25%) earn around $101 per night.
Average Daily Rate (ADR) Trend by Month in Arteaga
Get Live Arteaga Market Intelligence 👇

Explore Real-time Analytics
Airbnb Seasonality Analysis & Trends in Arteaga (2026)
Peak Season (December, November, April)
- Revenue averages $2,306 per month
- Occupancy rates average 30.4%
- Daily rates average $217
Shoulder Season
- Revenue averages $1,865 per month
- Occupancy maintains around 25.8%
- Daily rates hold near $206
Low Season (May, June, July)
- Revenue drops to average $1,543 per month
- Occupancy decreases to average 23.9%
- Daily rates adjust to average $199
Seasonality Insights for Arteaga
- The Airbnb seasonality in Arteaga shows moderate seasonality with distinct peak and low periods. While the sections above show seasonal averages, it's also insightful to look at the extremes:
- During the high season, the absolute peak month showcases Arteaga's highest earning potential, with monthly revenues capable of climbing to $2,743, occupancy reaching a high of 31.5%, and ADRs peaking at $232.
- Conversely, the slowest single month of the year, typically falling within the low season, marks the market's lowest point. In this month, revenue might dip to $1,475, occupancy could drop to 21.0%, and ADRs may adjust down to $191.
- Understanding both the seasonal averages and these monthly peaks and troughs in revenue, occupancy, and ADR is crucial for maximizing your Airbnb profit potential in Arteaga.
Seasonal Strategies for Maximizing Profit
- Peak Season: Maximize revenue through premium pricing and potentially longer minimum stays. Ensure high availability.
- Low Season: Offer competitive pricing, special promotions (e.g., extended stay discounts), and flexible cancellation policies. Target off-season travelers like remote workers or budget-conscious guests.
- Shoulder Seasons: Implement dynamic pricing that balances peak and low rates. Target weekend travelers or specific events. Offer slightly more flexible terms than peak season.
- Regularly analyze your own performance against these Arteaga seasonality benchmarks and adjust your pricing and availability strategy accordingly.
Best Areas for Airbnb Investment in Arteaga (2026)
Exploring the top neighborhoods for short-term rentals in Arteaga? This section highlights key areas, outlining why they are attractive for hosts and guests, along with notable local attractions. Consider these locations based on your target guest profile and investment strategy.
| Neighborhood / Area | Why Host Here? (Target Guests & Appeal) | Key Attractions & Landmarks |
|---|---|---|
| Centro de Arteaga | The central area of Arteaga is vibrant and close to local attractions, making it a prime spot for visitors looking to experience the culture and history of the town. | Parroquia de San Isidro Labrador, Plaza Principal, Arteaga's Market, Cultural Center, Local restaurants and boutiques |
| Bosque de Arteaga | Known for its beautiful natural surroundings, this area provides an escape for those looking to enjoy nature and outdoor activities, appealing to tourists who favor eco-tourism. | Parque Nacional Cumbres de Monterrey, Hiking trails, Picnic areas, Scenic viewpoints |
| Las Peñas | This neighborhood offers a mix of local charm and modern amenities, ideal for families and travelers who want a comfortable stay while remaining connected to the town's culture. | Local parks, Community events, Shopping areas, Grocery stores |
| Los Azufres | Famous for its hot springs, this area attracts health and wellness tourists, making it an appealing destination for those looking to relax and rejuvenate. | Los Azufres Hot Springs, Spa facilities, Nature walks, Thermal waters |
| Barrio de San Isidro | A quaint neighborhood with a traditional vibe, it offers an authentic experience of local life while being close to key attractions. | Traditional festivals, Local craft shops, Artisan markets, Cultural events |
| Fraccionamiento San Antonio | A residential area with modern housing developments, popular among families and longer-stay tourists seeking comfort and amenities. | Local schools, Nearby shopping areas, Parks |
| Colonia Valle Verde | A neighborhood that offers great access to local dining options and is a hub for nightlife, perfect for younger travelers looking to enjoy the local scene. | Bars and lounges, Local eateries, Live music venues |
| El Mirador | Famous for its breathtaking views, this area appeals to tourists seeking picturesque landscapes and unique photo opportunities. | Mirador viewpoints, Scenic pathways, Photography spots |
Understanding Airbnb License Requirements & STR Laws in Arteaga (2026)
While Arteaga, Coahuila, Mexico currently shows low STR regulations, specific Airbnb license requirements might still exist or change. Always verify the latest short term rental regulations and Airbnb license requirements directly with local government authorities for Arteaga to ensure full compliance before hosting.
(Source: AirROI data, 2026, finding no licensed listings among those analyzed)
Top Performing Airbnb Properties in Arteaga (2026)
Benchmark your potential! Explore examples of top-performing Airbnb properties in Arteagabased on Trailing Twelve Month (TTM) revenue. Analyze their characteristics, revenue, occupancy rate, and ADR to understand what drives success in this market.
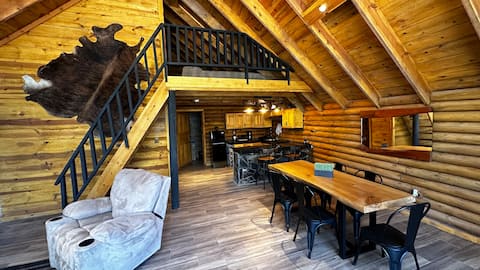
The Bear's Cave - Black Bear
Entire Place • 2 bedrooms
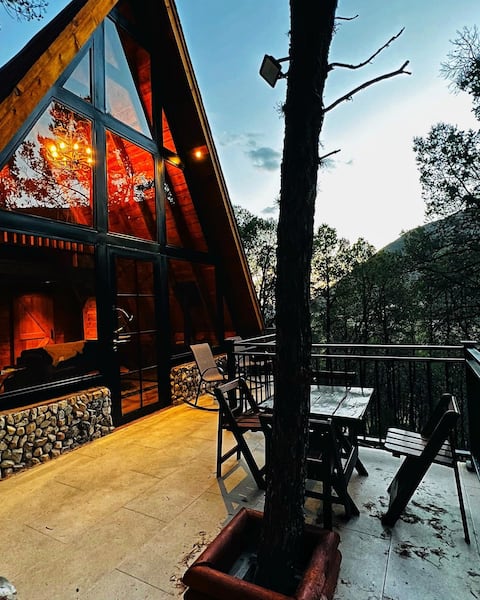
Bear Cave - Alaska
Entire Place • 1 bedroom

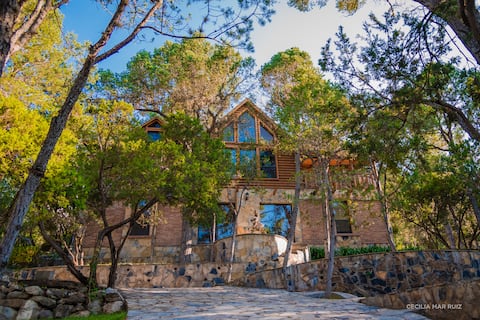
Premium Cabin at Bosques de Monterreal
Entire Place • 5 bedrooms

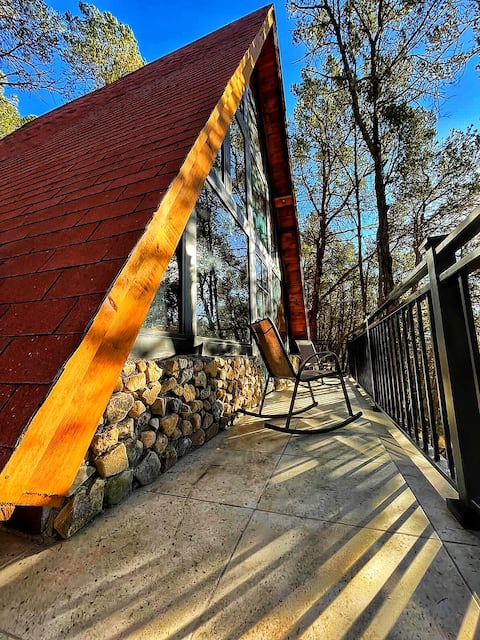
The Bear's Cave - Arteaga
Entire Place • 1 bedroom
Large cabin in Arteaga, Coahuila
Entire Place • 5 bedrooms
Bear's Best - Montana
Entire Place • 1 bedroom
Note: Performance varies based on location, size, amenities, seasonality, and management quality. Data reflects the past 12 months.
Top Performing Airbnb Hosts in Arteaga (2026)
Learn from the best! This table showcases top-performing Airbnb hosts in Arteaga based on the number of properties managed and estimated total revenue over the past year. Analyze their scale and performance metrics.
| Host Name | Properties | Grossing Revenue | Stay Reviews | Avg Rating |
|---|---|---|---|---|
| La Cueva Del Oso | 4 | $369,570 | 151 | 4.95/5.0 |
| Arturo | 1 | $82,538 | 193 | 4.92/5.0 |
| Francisco | 1 | $79,343 | 181 | 4.93/5.0 |
| Liliana | 1 | $56,319 | 258 | 4.97/5.0 |
| Roberto Adrian | 1 | $50,201 | 120 | 4.96/5.0 |
| Elisa María | 3 | $46,382 | 13 | 5.00/5.0 |
| Bianca | 1 | $44,873 | 40 | 4.80/5.0 |
| Chilo | 2 | $44,462 | 122 | 4.84/5.0 |
| Antuanet | 1 | $37,260 | 55 | 4.95/5.0 |
| Maricarmen | 3 | $30,789 | 261 | 4.84/5.0 |
Analyzing the strategies of top hosts, such as their property selection, pricing, and guest communication, can offer valuable lessons for optimizing your own Airbnb operations in Arteaga.
Dive Deeper: Advanced Arteaga STR Market Data (2026)
Ready to unlock more insights? AirROI provides access to advanced metrics and comprehensive Airbnb data for Arteaga. Explore detailed analytics beyond this report to refine your investment strategy, optimize pricing, and maximize your vacation rental profits.
Explore Advanced MetricsArteaga Short-Term Rental Market Composition (2026): Property & Room Types
Room Type Distribution
Property Type Distribution
Market Composition Insights for Arteaga
- The Arteaga Airbnb market composition is heavily skewed towards Entire Home/Apt listings, which make up 95.3% of the 86 active rentals. This indicates strong guest preference for privacy and space.
- Looking at the property type distribution in Arteaga, Outdoor/Unique properties are the most common (69.8%), reflecting the local real estate landscape.
- Houses represent a significant 24.4% portion, catering likely to families or larger groups.
- Smaller segments like apartment/condo, unique stays (combined 5.8%) offer potential for unique stay experiences.
Arteaga Airbnb Room Capacity Analysis (2026): Bedroom Distribution
Distribution of Listings by Number of Bedrooms
Room Capacity Insights for Arteaga
- The dominant room capacity in Arteaga is 1 bedroom listings, making up 31.4% of the market. This suggests a strong demand for properties suitable for couples or solo travelers.
- Together, 1 bedroom and 3 bedrooms properties represent 58.1% of the active Airbnb listings in Arteaga, indicating a high concentration in these sizes.
- A significant 41.8% of listings offer 3+ bedrooms, catering to larger groups and families seeking more space in Arteaga.
Arteaga Vacation Rental Guest Capacity Trends (2026)
Distribution of Listings by Guest Capacity
Guest Capacity Insights for Arteaga
- The most common guest capacity trend in Arteaga vacation rentals is listings accommodating 8+ guests (40.7%). This suggests the primary traveler segment is likely larger groups.
- Properties designed for 8+ guests and 2 guests dominate the Arteaga STR market, accounting for 58.1% of listings.
- 60.5% of properties accommodate 6+ guests, serving the market segment for larger families or group travel in Arteaga.
- On average, properties in Arteaga are equipped to host 5.6 guests.
Arteaga Airbnb Booking Patterns (2026): Available vs. Booked Days
Available Days Distribution
Booked Days Distribution
Booking Pattern Insights for Arteaga
- The most common availability pattern in Arteaga falls within the 271-366 days range, representing 72.1% of listings. This suggests many properties have significant open periods on their calendars.
- Approximately 91.9% of listings show high availability (181+ days open annually), indicating potential for increased bookings or specific owner usage patterns.
- For booked days, the 1-30 days range is most frequent in Arteaga (37.2%), reflecting common guest stay durations or potential owner blocking patterns.
- A notable 8.1% of properties secure long booking periods (181+ days booked per year), highlighting successful long-term rental strategies or significant owner usage.
Arteaga Airbnb Minimum Stay Requirements Analysis
Distribution of Listings by Minimum Night Requirement
1 Night
67 listings
77.9% of total
2 Nights
8 listings
9.3% of total
4-6 Nights
5 listings
5.8% of total
30+ Nights
6 listings
7% of total
Key Insights
- The most prevalent minimum stay requirement in Arteaga is 1 Night, adopted by 77.9% of listings. This highlights the market's preference for shorter, flexible bookings.
- A strong majority (87.2%) of the Arteaga Airbnb data shows acceptance of very short stays (1-2 nights), indicating a dynamic, high-turnover market.
Recommendations
- Align with the market by considering a 1 Night minimum stay, as 77.9% of Arteaga hosts use this setting.
- Explore offering discounts for stays of 30+ nights to attract the 7% of the market seeking extended stays.
- Adjust minimum nights based on seasonality – potentially shorter during low season and longer during peak demand periods in Arteaga.
Arteaga Airbnb Cancellation Policy Trends Analysis (2026)
Limited
1 listings
1.2% of total
Flexible
22 listings
25.6% of total
Moderate
27 listings
31.4% of total
Firm
27 listings
31.4% of total
Strict
9 listings
10.5% of total
Cancellation Policy Insights for Arteaga
- The prevailing Airbnb cancellation policy trend in Arteaga is Moderate, used by 31.4% of listings.
- There's a relatively balanced mix between guest-friendly (57.0%) and stricter (41.9%) policies, offering choices for different guest needs.
Recommendations for Hosts
- Consider adopting a Moderate policy to align with the 31.4% market standard in Arteaga.
- Using a Strict policy might deter some guests, as only 10.5% of listings use it. Evaluate if potential revenue protection outweighs possible lower booking rates.
- Regularly review your cancellation policy against competitors and market demand shifts in Arteaga.
Arteaga STR Booking Lead Time Analysis (2026)
Average Booking Lead Time by Month
Booking Lead Time Insights for Arteaga
- The overall average booking lead time for vacation rentals in Arteaga is 26 days.
- Guests book furthest in advance for stays during December (average 38 days), likely coinciding with peak travel demand or local events.
- The shortest booking windows occur for stays in June (average 13 days), indicating more last-minute travel plans during this time.
- Seasonally, Fall (33 days avg.) sees the longest lead times, while Summer (22 days avg.) has the shortest, reflecting typical travel planning cycles.
Recommendations for Hosts
- Use the overall average lead time (26 days) as a baseline for your pricing and availability strategy in Arteaga.
- For December stays, consider implementing length-of-stay discounts or slightly higher rates for bookings made less than 38 days out to capitalize on advance planning.
- During June, focus on last-minute booking availability and promotions, as guests book with very short notice (13 days avg.).
- Target marketing efforts for the Fall season well in advance (at least 33 days) to capture early planners.
- Monitor your own booking lead times against these Arteaga averages to identify opportunities for dynamic pricing adjustments.
Popular & Essential Airbnb Amenities in Arteaga (2026)
Amenity Prevalence
Amenity Insights for Arteaga
- Popular amenities like Free parking on premises, Kitchen, Hot water are common but not universal. Offering these can provide a competitive edge.
Recommendations for Hosts
- Consider adding popular differentiators like Free parking on premises or Kitchen to increase appeal.
- Highlight unique or less common amenities you offer (e.g., hot tub, dedicated workspace, EV charger) in your listing description and photos.
- Regularly check competitor amenities in Arteaga to stay competitive.
Arteaga Airbnb Guest Demographics & Profile Analysis (2026)
Guest Profile Summary for Arteaga
- The typical guest profile for Airbnb in Arteaga consists of primarily domestic travelers (92%), often arriving from nearby Monterrey, typically belonging to the Post-2000s (Gen Z/Alpha) group (50%), primarily speaking Spanish or English.
- Domestic travelers account for 92.1% of guests.
- Key international markets include Mexico (92.1%) and United States (6.4%).
- Top languages spoken are Spanish (51.2%) followed by English (39.8%).
- A significant demographic segment is the Post-2000s (Gen Z/Alpha) group, representing 50% of guests.
Recommendations for Hosts
- Target domestic marketing efforts towards travelers from Monterrey and Saltillo.
- Tailor amenities and listing descriptions to appeal to the dominant Post-2000s (Gen Z/Alpha) demographic (e.g., highlight fast WiFi, smart home features, local guides).
- Highlight unique local experiences or amenities relevant to the primary guest profile.
- Consider seasonal promotions aligned with peak travel times for key origin markets.
Nearby Short-Term Rental Market Comparison
How does the Arteaga Airbnb market stack up against its neighbors? Compare key performance metrics like average monthly revenue, ADR, and occupancy rates in surrounding areas to understand the broader regional STR landscape.
| Market | Active Properties | Monthly Revenue | Daily Rate | Avg. Occupancy |
|---|---|---|---|---|
| Bella Unión | 10 | $4,181 | $286.89 | 37% |
| El Cercado | 14 | $1,947 | $212.87 | 32% |
| Jame | 10 | $1,486 | $169.30 | 27% |
| General Zuazua | 20 | $1,472 | $277.59 | 26% |
| Mesa de tablas | 43 | $1,457 | $302.25 | 18% |
| Barrio de Huajuquito | 11 | $1,453 | $236.72 | 26% |
| San Antonio de Las Alazanas | 37 | $1,165 | $285.00 | 18% |
| Allende | 17 | $1,151 | $150.10 | 30% |
| Montemorelos | 21 | $1,148 | $183.07 | 26% |
| Santiago | 213 | $1,125 | $193.97 | 24% |