La Ciudad Airbnb Market Analysis 2026: Short Term Rental Data & Vacation Rental Statistics in Durango, Mexico
Is Airbnb profitable in La Ciudad in 2026? Explore comprehensive Airbnb analytics for La Ciudad, Durango, Mexico to uncover income potential. This 2026 STR market report for La Ciudad, based on AirROI data from February 2025 to January 2026, reveals key trends in the niche market of 20 active listings.
Whether you're considering an Airbnb investment in La Ciudad, optimizing your existing vacation rental, or exploring rental arbitrage opportunities, understanding the La Ciudad Airbnb data is crucial. Leveraging the low regulation environment is key to maximizing your short term rental income potential. Let's dive into the specifics.
Key La Ciudad Airbnb Performance Metrics Overview
Monthly Airbnb Revenue Variations & Income Potential in La Ciudad (2026)
Understanding the monthly revenue variations for Airbnb listings in La Ciudad is key to maximizing your short term rental income potential. Seasonality significantly impacts earnings. Our analysis, based on data from the past 12 months, shows that the peak revenue month for STRs in La Ciudad is typically July, while May often presents the lowest earnings, highlighting opportunities for strategic pricing adjustments during shoulder and low seasons. Explore the typical Airbnb income in La Ciudad across different performance tiers:
- Best-in-class properties (Top 10%) achieve $2,203+ monthly, often utilizing dynamic pricing and superior guest experiences.
- Strong performing properties (Top 25%) earn $1,140 or more, indicating effective management and desirable locations/amenities.
- Typical properties (Median) generate around $495 per month, representing the average market performance.
- Entry-level properties (Bottom 25%) see earnings around $255, often with potential for optimization.
Average Monthly Airbnb Earnings Trend in La Ciudad
La Ciudad Airbnb Occupancy Rate Trends (2026)
Maximize your bookings by understanding the La Ciudad STR occupancy trends. Seasonal demand shifts significantly influence how often properties are booked. Typically, Septembersees the highest demand (peak season occupancy), while May experiences the lowest (low season). Effective strategies, like adjusting minimum stays or offering promotions, can boost occupancy during slower periods. Here's how different property tiers perform in La Ciudad:
- Best-in-class properties (Top 10%) achieve 40%+ occupancy, indicating high desirability and potentially optimized availability.
- Strong performing properties (Top 25%) maintain 21% or higher occupancy, suggesting good market fit and guest satisfaction.
- Typical properties (Median) have an occupancy rate around 11%.
- Entry-level properties (Bottom 25%) average 6% occupancy, potentially facing higher vacancy.
Average Monthly Occupancy Rate Trend in La Ciudad
Average Daily Rate (ADR) Airbnb Trends in La Ciudad (2026)
Effective short term rental pricing strategy in La Ciudad involves understanding monthly ADR fluctuations. The Average Daily Rate (ADR) for Airbnb in La Ciudad typically peaks in July and dips lowest during September. Leveraging Airbnb dynamic pricing tools or strategies based on this seasonality can significantly boost revenue. Here's a look at the typical nightly rates achieved:
- Best-in-class properties (Top 10%) command rates of $278+ per night, often due to premium features or locations.
- Strong performing properties (Top 25%) achieve nightly rates of $201 or more.
- Typical properties (Median) charge around $151 per night.
- Entry-level properties (Bottom 25%) earn around $104 per night.
Average Daily Rate (ADR) Trend by Month in La Ciudad
Get Live La Ciudad Market Intelligence 👇

Explore Real-time Analytics
Airbnb Seasonality Analysis & Trends in La Ciudad (2026)
Peak Season (July, September, December)
- Revenue averages $1,201 per month
- Occupancy rates average 21.2%
- Daily rates average $170
Shoulder Season
- Revenue averages $816 per month
- Occupancy maintains around 17.0%
- Daily rates hold near $169
Low Season (February, May, October)
- Revenue drops to average $524 per month
- Occupancy decreases to average 11.5%
- Daily rates adjust to average $167
Seasonality Insights for La Ciudad
- The Airbnb seasonality in La Ciudad shows highly seasonal trends requiring careful strategy. While the sections above show seasonal averages, it's also insightful to look at the extremes:
- During the high season, the absolute peak month showcases La Ciudad's highest earning potential, with monthly revenues capable of climbing to $1,368, occupancy reaching a high of 23.9%, and ADRs peaking at $177.
- Conversely, the slowest single month of the year, typically falling within the low season, marks the market's lowest point. In this month, revenue might dip to $403, occupancy could drop to 9.7%, and ADRs may adjust down to $162.
- Understanding both the seasonal averages and these monthly peaks and troughs in revenue, occupancy, and ADR is crucial for maximizing your Airbnb profit potential in La Ciudad.
Seasonal Strategies for Maximizing Profit
- Peak Season: Maximize revenue through premium pricing and potentially longer minimum stays. Ensure high availability.
- Low Season: Offer competitive pricing, special promotions (e.g., extended stay discounts), and flexible cancellation policies. Target off-season travelers like remote workers or budget-conscious guests.
- Shoulder Seasons: Implement dynamic pricing that balances peak and low rates. Target weekend travelers or specific events. Offer slightly more flexible terms than peak season.
- Regularly analyze your own performance against these La Ciudad seasonality benchmarks and adjust your pricing and availability strategy accordingly.
Best Areas for Airbnb Investment in La Ciudad (2026)
Exploring the top neighborhoods for short-term rentals in La Ciudad? This section highlights key areas, outlining why they are attractive for hosts and guests, along with notable local attractions. Consider these locations based on your target guest profile and investment strategy.
| Neighborhood / Area | Why Host Here? (Target Guests & Appeal) | Key Attractions & Landmarks |
|---|---|---|
| Centro Histórico | The historical center of Durango offers rich cultural experiences with colonial architecture, museums, and local cuisine. It attracts tourists interested in history and tradition. | Durango Cathedral, Ex-Convent of the Franciscanos, Francisco Villa Museum, Revolution Museum, Plaza de Armas |
| Mole and Pan de Muerto | This vibrant area is known for its traditional Day of the Dead celebrations and local culinary delights, drawing tourists for unique cultural experiences. | Cemetery of Dolores, Traditional markets, Local eateries serving Mole and Pan de Muerto, Festivals celebrating Día de Muertos |
| Chupaderos | A natural area ideal for outdoor activities, hikes, and ecotourism. It's great for those looking to escape the city and enjoy nature. | Cerro de los Remedios, Hiking trails, Birdwatching, Natural parks |
| Durango's Sierra | The Sierra region offers stunning landscapes and adventure tourism options, attracting visitors who love nature and exploration. | Sierra Madre Occidental, Adventure parks, Camping spots, Natural wonders |
| Guadiana Park | A popular urban park perfect for relaxation, picnics, and family activities, attracting locals and tourists alike. | Guadiana River, Walking paths, Playgrounds, Outdoor events |
| El Parque de la Ciudad | A modern urban park that provides recreational activities and cultural events, ideal for families and sports enthusiasts. | Play areas, Cultural events, Green spaces, Open-air theater |
| Pueblo Nuevo | This neighborhood offers a variety of local dining and shopping experiences, attracting both locals and travelers seeking authenticity. | Local restaurants, Artisan markets, Shopping areas, Community events |
| Los Castaños | A residential and tourist-friendly area known for its quiet atmosphere and close proximity to essential amenities and attractions. | Quiet neighborhoods, Local markets, Convenience stores, Easy access to main roads |
Understanding Airbnb License Requirements & STR Laws in La Ciudad (2026)
While La Ciudad, Durango, Mexico currently shows low STR regulations, specific Airbnb license requirements might still exist or change. Always verify the latest short term rental regulations and Airbnb license requirements directly with local government authorities for La Ciudad to ensure full compliance before hosting.
(Source: AirROI data, 2026, finding no licensed listings among those analyzed)
Top Performing Airbnb Properties in La Ciudad (2026)
Benchmark your potential! Explore examples of top-performing Airbnb properties in La Ciudadbased on Trailing Twelve Month (TTM) revenue. Analyze their characteristics, revenue, occupancy rate, and ADR to understand what drives success in this market.
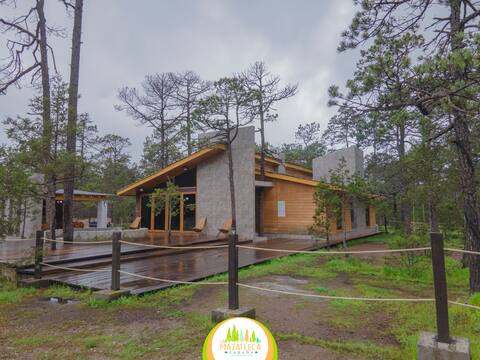
La Mazatleca cabin in Mexiquillo
Entire Place • 3 bedrooms
Sunrise - VVND Unique Experiences
Entire Place • 2 bedrooms

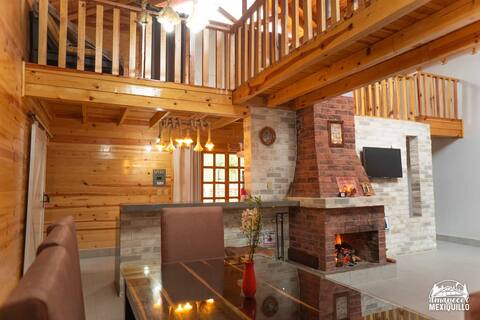
Cabaña Santa Maria en Mexiquillo Durango 02
Entire Place • 3 bedrooms

SUNRISE IN MEXIQUILLO Charming and huge cabin
Entire Place • 3 bedrooms
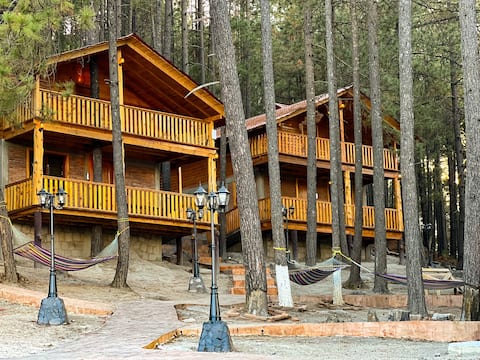
Alturas de Mexiquillo - Los Pinos Cabin
Entire Place • 5 bedrooms

El Capitán Cabins - 8 bedrooms
Entire Place • 8 bedrooms
Note: Performance varies based on location, size, amenities, seasonality, and management quality. Data reflects the past 12 months.
Top Performing Airbnb Hosts in La Ciudad (2026)
Learn from the best! This table showcases top-performing Airbnb hosts in La Ciudad based on the number of properties managed and estimated total revenue over the past year. Analyze their scale and performance metrics.
| Host Name | Properties | Grossing Revenue | Stay Reviews | Avg Rating |
|---|---|---|---|---|
| Parahome | 2 | $25,746 | 88 | 4.87/5.0 |
| Luck | 1 | $22,273 | 38 | 4.79/5.0 |
| Juan Carlos | 3 | $16,031 | 31 | 4.83/5.0 |
| Cabañas | 2 | $12,525 | 75 | 4.77/5.0 |
| Gamaliel | 1 | $6,115 | 2 | Not Rated |
| La Casita | 1 | $5,816 | 1 | Not Rated |
| Roberto U. | 2 | $5,663 | 9 | 4.78/5.0 |
| Araceli | 1 | $4,246 | 21 | 4.76/5.0 |
| Óscar Alfredo | 1 | $2,033 | 102 | 4.76/5.0 |
| Perla | 1 | $1,453 | 4 | 4.50/5.0 |
Analyzing the strategies of top hosts, such as their property selection, pricing, and guest communication, can offer valuable lessons for optimizing your own Airbnb operations in La Ciudad.
Dive Deeper: Advanced La Ciudad STR Market Data (2026)
Ready to unlock more insights? AirROI provides access to advanced metrics and comprehensive Airbnb data for La Ciudad. Explore detailed analytics beyond this report to refine your investment strategy, optimize pricing, and maximize your vacation rental profits.
Explore Advanced MetricsLa Ciudad Short-Term Rental Market Composition (2026): Property & Room Types
Room Type Distribution
Property Type Distribution
Market Composition Insights for La Ciudad
- The La Ciudad Airbnb market composition is heavily skewed towards Entire Home/Apt listings, which make up 100% of the 20 active rentals. This indicates strong guest preference for privacy and space.
- Looking at the property type distribution in La Ciudad, Outdoor/Unique properties are the most common (90%), reflecting the local real estate landscape.
La Ciudad Airbnb Room Capacity Analysis (2026): Bedroom Distribution
Distribution of Listings by Number of Bedrooms
Room Capacity Insights for La Ciudad
- The dominant room capacity in La Ciudad is 3 bedrooms listings, making up 45% of the market. This suggests a strong demand for properties suitable for families or small groups.
- Together, 3 bedrooms and 4 bedrooms properties represent 65.0% of the active Airbnb listings in La Ciudad, indicating a high concentration in these sizes.
- A significant 75.0% of listings offer 3+ bedrooms, catering to larger groups and families seeking more space in La Ciudad.
La Ciudad Vacation Rental Guest Capacity Trends (2026)
Distribution of Listings by Guest Capacity
Guest Capacity Insights for La Ciudad
- The most common guest capacity trend in La Ciudad vacation rentals is listings accommodating 8+ guests (60%). This suggests the primary traveler segment is likely larger groups.
- Properties designed for 8+ guests and 6 guests dominate the La Ciudad STR market, accounting for 80.0% of listings.
- 85.0% of properties accommodate 6+ guests, serving the market segment for larger families or group travel in La Ciudad.
- On average, properties in La Ciudad are equipped to host 6.7 guests.
La Ciudad Airbnb Booking Patterns (2026): Available vs. Booked Days
Available Days Distribution
Booked Days Distribution
Booking Pattern Insights for La Ciudad
- The most common availability pattern in La Ciudad falls within the 271-366 days range, representing 90% of listings. This suggests many properties have significant open periods on their calendars.
- Approximately 100.0% of listings show high availability (181+ days open annually), indicating potential for increased bookings or specific owner usage patterns.
- For booked days, the 1-30 days range is most frequent in La Ciudad (60%), reflecting common guest stay durations or potential owner blocking patterns.
La Ciudad Airbnb Minimum Stay Requirements Analysis
Distribution of Listings by Minimum Night Requirement
1 Night
11 listings
55% of total
2 Nights
7 listings
35% of total
30+ Nights
2 listings
10% of total
Key Insights
- The most prevalent minimum stay requirement in La Ciudad is 1 Night, adopted by 55% of listings. This highlights the market's preference for shorter, flexible bookings.
- A strong majority (90.0%) of the La Ciudad Airbnb data shows acceptance of very short stays (1-2 nights), indicating a dynamic, high-turnover market.
Recommendations
- Align with the market by considering a 1 Night minimum stay, as 55% of La Ciudad hosts use this setting.
- Explore offering discounts for stays of 30+ nights to attract the 10% of the market seeking extended stays.
- Adjust minimum nights based on seasonality – potentially shorter during low season and longer during peak demand periods in La Ciudad.
La Ciudad Airbnb Cancellation Policy Trends Analysis (2026)
Flexible
8 listings
40% of total
Moderate
5 listings
25% of total
Firm
5 listings
25% of total
Strict
2 listings
10% of total
Cancellation Policy Insights for La Ciudad
- The prevailing Airbnb cancellation policy trend in La Ciudad is Flexible, used by 40% of listings.
- There's a relatively balanced mix between guest-friendly (65.0%) and stricter (35.0%) policies, offering choices for different guest needs.
Recommendations for Hosts
- Consider adopting a Flexible policy to align with the 40% market standard in La Ciudad.
- Using a Strict policy might deter some guests, as only 10% of listings use it. Evaluate if potential revenue protection outweighs possible lower booking rates.
- Regularly review your cancellation policy against competitors and market demand shifts in La Ciudad.
La Ciudad STR Booking Lead Time Analysis (2026)
Average Booking Lead Time by Month
Booking Lead Time Insights for La Ciudad
- The overall average booking lead time for vacation rentals in La Ciudad is 26 days.
- Guests book furthest in advance for stays during June (average 55 days), likely coinciding with peak travel demand or local events.
- The shortest booking windows occur for stays in July (average 11 days), indicating more last-minute travel plans during this time.
- Seasonally, Fall (37 days avg.) sees the longest lead times, while Spring (19 days avg.) has the shortest, reflecting typical travel planning cycles.
Recommendations for Hosts
- Use the overall average lead time (26 days) as a baseline for your pricing and availability strategy in La Ciudad.
- For June stays, consider implementing length-of-stay discounts or slightly higher rates for bookings made less than 55 days out to capitalize on advance planning.
- During July, focus on last-minute booking availability and promotions, as guests book with very short notice (11 days avg.).
- Target marketing efforts for the Fall season well in advance (at least 37 days) to capture early planners.
- Monitor your own booking lead times against these La Ciudad averages to identify opportunities for dynamic pricing adjustments.
Popular & Essential Airbnb Amenities in La Ciudad (2026)
Amenity Prevalence
Amenity Insights for La Ciudad
- Essential amenities in La Ciudad that guests expect include: Kitchen, Free parking on premises. Lacking these (any) could significantly impact bookings.
- Popular amenities like Indoor fireplace, TV, Dishes and silverware are common but not universal. Offering these can provide a competitive edge.
Recommendations for Hosts
- Ensure your listing includes all essential amenities for La Ciudad: Kitchen, Free parking on premises.
- Consider adding popular differentiators like Indoor fireplace or TV to increase appeal.
- Highlight unique or less common amenities you offer (e.g., hot tub, dedicated workspace, EV charger) in your listing description and photos.
- Regularly check competitor amenities in La Ciudad to stay competitive.
La Ciudad Airbnb Guest Demographics & Profile Analysis (2026)
Guest Profile Summary for La Ciudad
- The typical guest profile for Airbnb in La Ciudad consists of primarily domestic travelers (86%), often arriving from nearby Culiacán, typically belonging to the Post-2000s (Gen Z/Alpha) group (50%), primarily speaking Spanish or English.
- Domestic travelers account for 85.7% of guests.
- Key international markets include Mexico (85.7%) and United States (14.3%).
- Top languages spoken are Spanish (63.2%) followed by English (36.8%).
- A significant demographic segment is the Post-2000s (Gen Z/Alpha) group, representing 50% of guests.
Recommendations for Hosts
- Target domestic marketing efforts towards travelers from Culiacán and Monterrey.
- Tailor amenities and listing descriptions to appeal to the dominant Post-2000s (Gen Z/Alpha) demographic (e.g., highlight fast WiFi, smart home features, local guides).
- Highlight unique local experiences or amenities relevant to the primary guest profile.
- Consider seasonal promotions aligned with peak travel times for key origin markets.
Nearby Short-Term Rental Market Comparison
How does the La Ciudad Airbnb market stack up against its neighbors? Compare key performance metrics like average monthly revenue, ADR, and occupancy rates in surrounding areas to understand the broader regional STR landscape.
| Market | Active Properties | Monthly Revenue | Daily Rate | Avg. Occupancy |
|---|---|---|---|---|
| Mazatlán | 5,064 | $639 | $125.12 | 26% |
| Tecuala | 10 | $556 | $106.57 | 28% |
| Isla de la Piedra (Stone Island) | 15 | $474 | $91.93 | 20% |
| Durango | 472 | $373 | $47.65 | 35% |
| San Ignacio | 11 | $264 | $279.53 | 15% |