Morelos Airbnb Market Analysis 2026: Short Term Rental Data & Vacation Rental Statistics in Morelos, Mexico
Is Airbnb profitable in Morelos in 2026? Explore comprehensive Airbnb analytics for Morelos, Morelos, Mexico to uncover income potential. This 2026 STR market report for Morelos, based on AirROI data from February 2025 to January 2026, reveals key trends in the niche market of 84 active listings.
Whether you're considering an Airbnb investment in Morelos, optimizing your existing vacation rental, or exploring rental arbitrage opportunities, understanding the Morelos Airbnb data is crucial. Leveraging the low regulation environment is key to maximizing your short term rental income potential. Let's dive into the specifics.
Key Morelos Airbnb Performance Metrics Overview
Monthly Airbnb Revenue Variations & Income Potential in Morelos (2026)
Understanding the monthly revenue variations for Airbnb listings in Morelos is key to maximizing your short term rental income potential. Seasonality significantly impacts earnings. Our analysis, based on data from the past 12 months, shows that the peak revenue month for STRs in Morelos is typically August, while February often presents the lowest earnings, highlighting opportunities for strategic pricing adjustments during shoulder and low seasons. Explore the typical Airbnb income in Morelos across different performance tiers:
- Best-in-class properties (Top 10%) achieve $2,998+ monthly, often utilizing dynamic pricing and superior guest experiences.
- Strong performing properties (Top 25%) earn $1,771 or more, indicating effective management and desirable locations/amenities.
- Typical properties (Median) generate around $854 per month, representing the average market performance.
- Entry-level properties (Bottom 25%) see earnings around $401, often with potential for optimization.
Average Monthly Airbnb Earnings Trend in Morelos
Morelos Airbnb Occupancy Rate Trends (2026)
Maximize your bookings by understanding the Morelos STR occupancy trends. Seasonal demand shifts significantly influence how often properties are booked. Typically, Augustsees the highest demand (peak season occupancy), while January experiences the lowest (low season). Effective strategies, like adjusting minimum stays or offering promotions, can boost occupancy during slower periods. Here's how different property tiers perform in Morelos:
- Best-in-class properties (Top 10%) achieve 57%+ occupancy, indicating high desirability and potentially optimized availability.
- Strong performing properties (Top 25%) maintain 40% or higher occupancy, suggesting good market fit and guest satisfaction.
- Typical properties (Median) have an occupancy rate around 20%.
- Entry-level properties (Bottom 25%) average 9% occupancy, potentially facing higher vacancy.
Average Monthly Occupancy Rate Trend in Morelos
Average Daily Rate (ADR) Airbnb Trends in Morelos (2026)
Effective short term rental pricing strategy in Morelos involves understanding monthly ADR fluctuations. The Average Daily Rate (ADR) for Airbnb in Morelos typically peaks in December and dips lowest during February. Leveraging Airbnb dynamic pricing tools or strategies based on this seasonality can significantly boost revenue. Here's a look at the typical nightly rates achieved:
- Best-in-class properties (Top 10%) command rates of $275+ per night, often due to premium features or locations.
- Strong performing properties (Top 25%) achieve nightly rates of $205 or more.
- Typical properties (Median) charge around $121 per night.
- Entry-level properties (Bottom 25%) earn around $78 per night.
Average Daily Rate (ADR) Trend by Month in Morelos
Get Live Morelos Market Intelligence 👇

Explore Real-time Analytics
Airbnb Seasonality Analysis & Trends in Morelos (2026)
Peak Season (August, December, July)
- Revenue averages $1,645 per month
- Occupancy rates average 29.8%
- Daily rates average $159
Shoulder Season
- Revenue averages $1,364 per month
- Occupancy maintains around 26.9%
- Daily rates hold near $158
Low Season (January, February, March)
- Revenue drops to average $1,080 per month
- Occupancy decreases to average 23.8%
- Daily rates adjust to average $153
Seasonality Insights for Morelos
- The Airbnb seasonality in Morelos shows moderate seasonality with distinct peak and low periods. While the sections above show seasonal averages, it's also insightful to look at the extremes:
- During the high season, the absolute peak month showcases Morelos's highest earning potential, with monthly revenues capable of climbing to $1,775, occupancy reaching a high of 34.1%, and ADRs peaking at $169.
- Conversely, the slowest single month of the year, typically falling within the low season, marks the market's lowest point. In this month, revenue might dip to $860, occupancy could drop to 20.3%, and ADRs may adjust down to $146.
- Understanding both the seasonal averages and these monthly peaks and troughs in revenue, occupancy, and ADR is crucial for maximizing your Airbnb profit potential in Morelos.
Seasonal Strategies for Maximizing Profit
- Peak Season: Maximize revenue through premium pricing and potentially longer minimum stays. Ensure high availability.
- Low Season: Offer competitive pricing, special promotions (e.g., extended stay discounts), and flexible cancellation policies. Target off-season travelers like remote workers or budget-conscious guests.
- Shoulder Seasons: Implement dynamic pricing that balances peak and low rates. Target weekend travelers or specific events. Offer slightly more flexible terms than peak season.
- Regularly analyze your own performance against these Morelos seasonality benchmarks and adjust your pricing and availability strategy accordingly.
Best Areas for Airbnb Investment in Morelos (2026)
Exploring the top neighborhoods for short-term rentals in Morelos? This section highlights key areas, outlining why they are attractive for hosts and guests, along with notable local attractions. Consider these locations based on your target guest profile and investment strategy.
| Neighborhood / Area | Why Host Here? (Target Guests & Appeal) | Key Attractions & Landmarks |
|---|---|---|
| Cuernavaca | Known as the 'City of Eternal Spring', Cuernavaca offers a warm climate year-round. It attracts visitors looking for a relaxing getaway, cultural experiences, and historical exploration. | Palace of Cortés, Robert Brady Museum, Cuernavaca Cathedral, Borda Gardens, Cuernavaca's historic center |
| Tepoztlán | A magical town famous for its stunning surroundings, traditional Mexican culture, and spiritual retreats. Ideal for tourists seeking adventure and wellness experiences. | Tepoztlán Pyramid, Ex-convent of Tepoztlán, Tepoztlán market, Hiking trails, Local artisan shops |
| Xochicalco | An archaeological site and UNESCO World Heritage Site, known for its well-preserved ruins and important pre-Hispanic history. Attracts history enthusiasts and educational tourism. | Xochicalco archaeological site, Museum of Xochicalco, Stargazing activities, Historical tours, Outdoor exploration |
| Jojutla | A quaint town offering a glimpse into local life with riverside activities and proximity to nature. It’s less commercialized, making it a unique retreat. | Laguna de Tequesquitengo, Plaza de Jojutla, Local festivals, Outdoor sports, River activities |
| Tlalpan | This area combines nature with urban culture. Close to Mexico City, it attracts both tourists and those looking to escape the hustle and bustle. | Tlalpan National Park, Historical colonial architecture, Local markets, Art galleries, Cultural festivals |
| Temixco | A growing area known for its water parks and outdoor activities. It's popular among families looking for leisure and fun. | Aquamundo water park, Cocotero water park, Local eateries, Temixco sports complexes, Family-friendly events |
| Huitzilac | Nestled in the mountains, Huitzilac is perfect for those seeking nature escapes, hiking, and cooler weather. It attracts eco-tourists and nature lovers. | Lagunas de Zempoala National Park, Hiking trails, Natural reserves, Eco-tourism activities, Majestic landscapes |
| Oaxtepec | Known for its thermal water spas and water parks, Oaxtepec is a sought-after destination for relaxation and family fun activities. | Six Flags Hurricane Harbor, Thermal establishments, Local cuisine, Adventure parks, Natural springs |
Understanding Airbnb License Requirements & STR Laws in Morelos (2026)
While Morelos, Morelos, Mexico currently shows low STR regulations, specific Airbnb license requirements might still exist or change. Always verify the latest short term rental regulations and Airbnb license requirements directly with local government authorities for Morelos to ensure full compliance before hosting.
(Source: AirROI data, 2026, finding no licensed listings among those analyzed)
Top Performing Airbnb Properties in Morelos (2026)
Benchmark your potential! Explore examples of top-performing Airbnb properties in Morelosbased on Trailing Twelve Month (TTM) revenue. Analyze their characteristics, revenue, occupancy rate, and ADR to understand what drives success in this market.
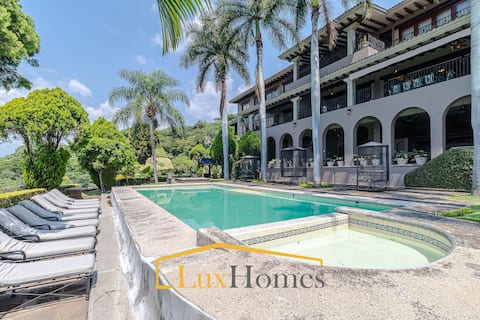
Luxurious house, spectacular view and pool for 20 people
Entire Place • 10 bedrooms
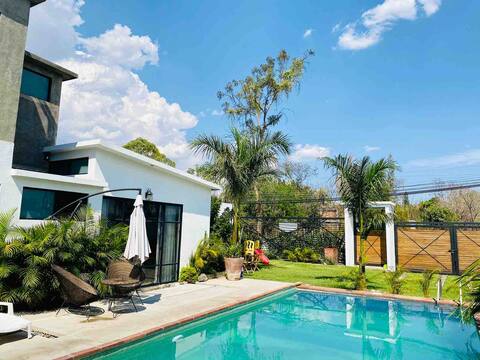
Casa Ignacio with Caldera*
Entire Place • 6 bedrooms

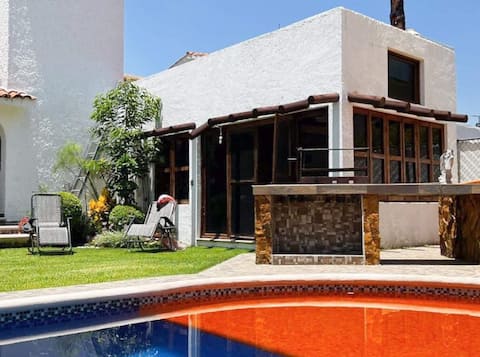
Luxury house in Oaxtepec, with heated pool
Private Room • 9 bedrooms

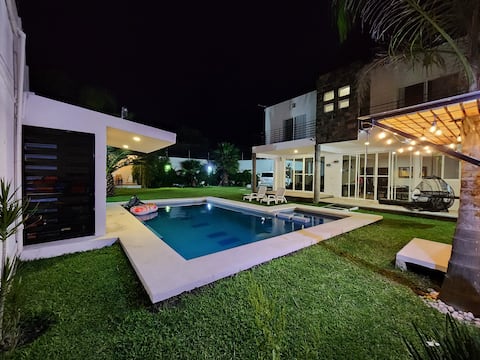
Amazing Vista Teques
Entire Place • 3 bedrooms
Beautiful house in Lomas de Cocoyoc
Entire Place • 4 bedrooms
house for weekends or vacations
Entire Place • 4 bedrooms
Note: Performance varies based on location, size, amenities, seasonality, and management quality. Data reflects the past 12 months.
Top Performing Airbnb Hosts in Morelos (2026)
Learn from the best! This table showcases top-performing Airbnb hosts in Morelos based on the number of properties managed and estimated total revenue over the past year. Analyze their scale and performance metrics.
| Host Name | Properties | Grossing Revenue | Stay Reviews | Avg Rating |
|---|---|---|---|---|
| Luis Giovanni | 1 | $92,496 | 77 | 4.95/5.0 |
| Alberto | 3 | $47,901 | 31 | 4.93/5.0 |
| Evelyn Maiara | 1 | $43,022 | 63 | 4.71/5.0 |
| Ismael | 1 | $40,520 | 23 | 4.43/5.0 |
| Gustavo Orlando | 2 | $39,391 | 28 | 4.85/5.0 |
| Raul | 1 | $37,287 | 23 | 4.70/5.0 |
| Karla | 1 | $37,191 | 66 | 4.76/5.0 |
| Abraham | 1 | $34,919 | 99 | 4.51/5.0 |
| Maria | 1 | $33,079 | 91 | 4.91/5.0 |
| Maria Victoria | 1 | $30,959 | 49 | 4.65/5.0 |
Analyzing the strategies of top hosts, such as their property selection, pricing, and guest communication, can offer valuable lessons for optimizing your own Airbnb operations in Morelos.
Dive Deeper: Advanced Morelos STR Market Data (2026)
Ready to unlock more insights? AirROI provides access to advanced metrics and comprehensive Airbnb data for Morelos. Explore detailed analytics beyond this report to refine your investment strategy, optimize pricing, and maximize your vacation rental profits.
Explore Advanced MetricsMorelos Short-Term Rental Market Composition (2026): Property & Room Types
Room Type Distribution
Property Type Distribution
Market Composition Insights for Morelos
- The Morelos Airbnb market composition is heavily skewed towards Entire Home/Apt listings, which make up 90.5% of the 84 active rentals. This indicates strong guest preference for privacy and space.
- Looking at the property type distribution in Morelos, House properties are the most common (77.4%), reflecting the local real estate landscape.
- Houses represent a significant 77.4% portion, catering likely to families or larger groups.
- The presence of 6% Hotel/Boutique listings indicates integration with traditional hospitality.
- Smaller segments like unique stays (combined 3.6%) offer potential for unique stay experiences.
Morelos Airbnb Room Capacity Analysis (2026): Bedroom Distribution
Distribution of Listings by Number of Bedrooms
Room Capacity Insights for Morelos
- The dominant room capacity in Morelos is 3 bedrooms listings, making up 27.4% of the market. This suggests a strong demand for properties suitable for families or small groups.
- Together, 3 bedrooms and 4 bedrooms properties represent 48.8% of the active Airbnb listings in Morelos, indicating a high concentration in these sizes.
- A significant 60.7% of listings offer 3+ bedrooms, catering to larger groups and families seeking more space in Morelos.
Morelos Vacation Rental Guest Capacity Trends (2026)
Distribution of Listings by Guest Capacity
Guest Capacity Insights for Morelos
- The most common guest capacity trend in Morelos vacation rentals is listings accommodating 8+ guests (57.1%). This suggests the primary traveler segment is likely larger groups.
- Properties designed for 8+ guests and 6 guests dominate the Morelos STR market, accounting for 71.4% of listings.
- 72.6% of properties accommodate 6+ guests, serving the market segment for larger families or group travel in Morelos.
- On average, properties in Morelos are equipped to host 6.3 guests.
Morelos Airbnb Booking Patterns (2026): Available vs. Booked Days
Available Days Distribution
Booked Days Distribution
Booking Pattern Insights for Morelos
- The most common availability pattern in Morelos falls within the 271-366 days range, representing 75% of listings. This suggests many properties have significant open periods on their calendars.
- Approximately 94.0% of listings show high availability (181+ days open annually), indicating potential for increased bookings or specific owner usage patterns.
- For booked days, the 1-30 days range is most frequent in Morelos (35.7%), reflecting common guest stay durations or potential owner blocking patterns.
- A notable 6.0% of properties secure long booking periods (181+ days booked per year), highlighting successful long-term rental strategies or significant owner usage.
Morelos Airbnb Minimum Stay Requirements Analysis
Distribution of Listings by Minimum Night Requirement
1 Night
46 listings
54.8% of total
2 Nights
28 listings
33.3% of total
30+ Nights
10 listings
11.9% of total
Key Insights
- The most prevalent minimum stay requirement in Morelos is 1 Night, adopted by 54.8% of listings. This highlights the market's preference for shorter, flexible bookings.
- A strong majority (88.1%) of the Morelos Airbnb data shows acceptance of very short stays (1-2 nights), indicating a dynamic, high-turnover market.
- A significant segment (11.9%) caters to monthly stays (30+ nights) in Morelos, pointing to opportunities in the extended-stay market.
Recommendations
- Align with the market by considering a 1 Night minimum stay, as 54.8% of Morelos hosts use this setting.
- Explore offering discounts for stays of 30+ nights to attract the 11.9% of the market seeking extended stays.
- Adjust minimum nights based on seasonality – potentially shorter during low season and longer during peak demand periods in Morelos.
Morelos Airbnb Cancellation Policy Trends Analysis (2026)
Flexible
32 listings
38.6% of total
Moderate
31 listings
37.3% of total
Firm
16 listings
19.3% of total
Strict
4 listings
4.8% of total
Cancellation Policy Insights for Morelos
- The prevailing Airbnb cancellation policy trend in Morelos is Flexible, used by 38.6% of listings.
- The market strongly favors guest-friendly terms, with 75.9% of listings offering Flexible or Moderate policies. This suggests guests in Morelos may expect booking flexibility.
- Strict cancellation policies are quite rare (4.8%), potentially making listings with this policy less competitive unless justified by high demand or property type.
Recommendations for Hosts
- Consider adopting a Flexible policy to align with the 38.6% market standard in Morelos.
- Using a Strict policy might deter some guests, as only 4.8% of listings use it. Evaluate if potential revenue protection outweighs possible lower booking rates.
- Regularly review your cancellation policy against competitors and market demand shifts in Morelos.
Morelos STR Booking Lead Time Analysis (2026)
Average Booking Lead Time by Month
Booking Lead Time Insights for Morelos
- The overall average booking lead time for vacation rentals in Morelos is 22 days.
- Guests book furthest in advance for stays during October (average 35 days), likely coinciding with peak travel demand or local events.
- The shortest booking windows occur for stays in March (average 16 days), indicating more last-minute travel plans during this time.
- Seasonally, Fall (30 days avg.) sees the longest lead times, while Spring (19 days avg.) has the shortest, reflecting typical travel planning cycles.
Recommendations for Hosts
- Use the overall average lead time (22 days) as a baseline for your pricing and availability strategy in Morelos.
- For October stays, consider implementing length-of-stay discounts or slightly higher rates for bookings made less than 35 days out to capitalize on advance planning.
- Target marketing efforts for the Fall season well in advance (at least 30 days) to capture early planners.
- Monitor your own booking lead times against these Morelos averages to identify opportunities for dynamic pricing adjustments.
Popular & Essential Airbnb Amenities in Morelos (2026)
Amenity Prevalence
Amenity Insights for Morelos
- Essential amenities in Morelos that guests expect include: Free parking on premises. Lacking these (this) could significantly impact bookings.
- Popular amenities like Kitchen, Wifi, TV are common but not universal. Offering these can provide a competitive edge.
- A pool is a highly desired but not standard amenity, making it a key feature for attracting guests seeking leisure in Morelos.
- Warning: Wifi is not universally provided but is considered essential globally. Ensure reliable Wifi is offered.
Recommendations for Hosts
- Ensure your listing includes all essential amenities for Morelos: Free parking on premises.
- Consider adding popular differentiators like Kitchen or Wifi to increase appeal.
- Highlight unique or less common amenities you offer (e.g., hot tub, dedicated workspace, EV charger) in your listing description and photos.
- Regularly check competitor amenities in Morelos to stay competitive.
Morelos Airbnb Guest Demographics & Profile Analysis (2026)
Guest Profile Summary for Morelos
- The typical guest profile for Airbnb in Morelos consists of primarily domestic travelers (94%), often arriving from nearby Mexico City, typically belonging to the Post-2000s (Gen Z/Alpha) group (50%), primarily speaking Spanish or English.
- Domestic travelers account for 94.1% of guests.
- Key international markets include Mexico (94.1%) and United States (2.5%).
- Top languages spoken are Spanish (49%) followed by English (38.8%).
- A significant demographic segment is the Post-2000s (Gen Z/Alpha) group, representing 50% of guests.
Recommendations for Hosts
- Target domestic marketing efforts towards travelers from Mexico City and Ciudad de Mexico.
- Tailor amenities and listing descriptions to appeal to the dominant Post-2000s (Gen Z/Alpha) demographic (e.g., highlight fast WiFi, smart home features, local guides).
- Highlight unique local experiences or amenities relevant to the primary guest profile.
- Consider seasonal promotions aligned with peak travel times for key origin markets.
Nearby Short-Term Rental Market Comparison
How does the Morelos Airbnb market stack up against its neighbors? Compare key performance metrics like average monthly revenue, ADR, and occupancy rates in surrounding areas to understand the broader regional STR landscape.
| Market | Active Properties | Monthly Revenue | Daily Rate | Avg. Occupancy |
|---|---|---|---|---|
| El Santuario | 44 | $2,583 | $420.27 | 25% |
| Cerro Gordo | 38 | $2,183 | $438.64 | 21% |
| Tepeji del Rio de Ocampo | 11 | $2,125 | $315.80 | 27% |
| Yautepec de Zaragoza | 16 | $2,032 | $269.32 | 26% |
| Xalmolonco | 24 | $1,944 | $281.85 | 28% |
| Avandaro | 212 | $1,892 | $411.24 | 24% |
| Guerrero | 28 | $1,795 | $223.86 | 29% |
| Rancho San Diego | 21 | $1,707 | $276.31 | 26% |
| Lomas de Cocoyoc | 137 | $1,662 | $258.05 | 28% |
| La Ladrillera | 28 | $1,655 | $277.53 | 26% |