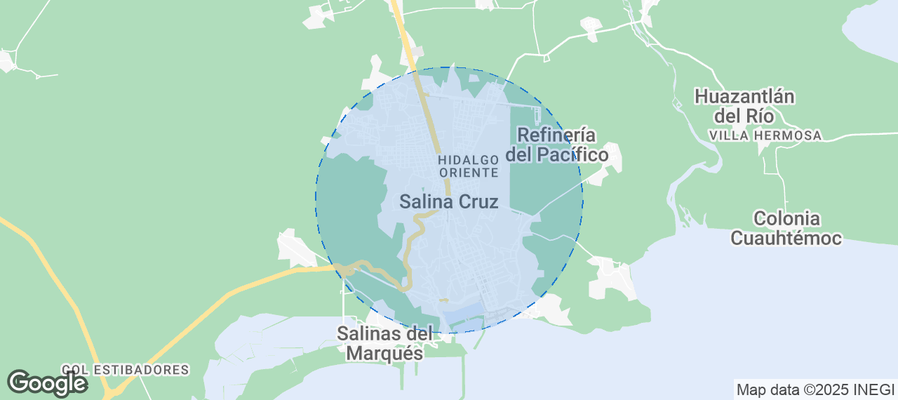
Salina Cruz Airbnb Market Analysis 2026: Short Term Rental Data & Vacation Rental Statistics in Oaxaca, Mexico
Is Airbnb profitable in Salina Cruz in 2026? Explore comprehensive Airbnb analytics for Salina Cruz, Oaxaca, Mexico to uncover income potential. This 2026 STR market report for Salina Cruz, based on AirROI data from February 2025 to January 2026, reveals key trends in the niche market of 41 active listings.
Whether you're considering an Airbnb investment in Salina Cruz, optimizing your existing vacation rental, or exploring rental arbitrage opportunities, understanding the Salina Cruz Airbnb data is crucial. Leveraging the low regulation environment is key to maximizing your short term rental income potential. Let's dive into the specifics.
Key Salina Cruz Airbnb Performance Metrics Overview
Monthly Airbnb Revenue Variations & Income Potential in Salina Cruz (2026)
Understanding the monthly revenue variations for Airbnb listings in Salina Cruz is key to maximizing your short term rental income potential. Seasonality significantly impacts earnings. Our analysis, based on data from the past 12 months, shows that the peak revenue month for STRs in Salina Cruz is typically September, while January often presents the lowest earnings, highlighting opportunities for strategic pricing adjustments during shoulder and low seasons. Explore the typical Airbnb income in Salina Cruz across different performance tiers:
- Best-in-class properties (Top 10%) achieve $1,908+ monthly, often utilizing dynamic pricing and superior guest experiences.
- Strong performing properties (Top 25%) earn $732 or more, indicating effective management and desirable locations/amenities.
- Typical properties (Median) generate around $308 per month, representing the average market performance.
- Entry-level properties (Bottom 25%) see earnings around $105, often with potential for optimization.
Average Monthly Airbnb Earnings Trend in Salina Cruz
Salina Cruz Airbnb Occupancy Rate Trends (2026)
Maximize your bookings by understanding the Salina Cruz STR occupancy trends. Seasonal demand shifts significantly influence how often properties are booked. Typically, Septembersees the highest demand (peak season occupancy), while January experiences the lowest (low season). Effective strategies, like adjusting minimum stays or offering promotions, can boost occupancy during slower periods. Here's how different property tiers perform in Salina Cruz:
- Best-in-class properties (Top 10%) achieve 60%+ occupancy, indicating high desirability and potentially optimized availability.
- Strong performing properties (Top 25%) maintain 33% or higher occupancy, suggesting good market fit and guest satisfaction.
- Typical properties (Median) have an occupancy rate around 16%.
- Entry-level properties (Bottom 25%) average 7% occupancy, potentially facing higher vacancy.
Average Monthly Occupancy Rate Trend in Salina Cruz
Average Daily Rate (ADR) Airbnb Trends in Salina Cruz (2026)
Effective short term rental pricing strategy in Salina Cruz involves understanding monthly ADR fluctuations. The Average Daily Rate (ADR) for Airbnb in Salina Cruz typically peaks in December and dips lowest during March. Leveraging Airbnb dynamic pricing tools or strategies based on this seasonality can significantly boost revenue. Here's a look at the typical nightly rates achieved:
- Best-in-class properties (Top 10%) command rates of $129+ per night, often due to premium features or locations.
- Strong performing properties (Top 25%) achieve nightly rates of $79 or more.
- Typical properties (Median) charge around $53 per night.
- Entry-level properties (Bottom 25%) earn around $40 per night.
Average Daily Rate (ADR) Trend by Month in Salina Cruz
Get Live Salina Cruz Market Intelligence 👇
Explore Real-time Analytics
Airbnb Seasonality Analysis & Trends in Salina Cruz (2026)
Peak Season (September, July, August)
- Revenue averages $1,120 per month
- Occupancy rates average 29.3%
- Daily rates average $72
Shoulder Season
- Revenue averages $619 per month
- Occupancy maintains around 24.4%
- Daily rates hold near $71
Low Season (January, May, December)
- Revenue drops to average $404 per month
- Occupancy decreases to average 22.4%
- Daily rates adjust to average $72
Seasonality Insights for Salina Cruz
- The Airbnb seasonality in Salina Cruz shows highly seasonal trends requiring careful strategy. While the sections above show seasonal averages, it's also insightful to look at the extremes:
- During the high season, the absolute peak month showcases Salina Cruz's highest earning potential, with monthly revenues capable of climbing to $1,435, occupancy reaching a high of 37.5%, and ADRs peaking at $74.
- Conversely, the slowest single month of the year, typically falling within the low season, marks the market's lowest point. In this month, revenue might dip to $283, occupancy could drop to 16.1%, and ADRs may adjust down to $68.
- Understanding both the seasonal averages and these monthly peaks and troughs in revenue, occupancy, and ADR is crucial for maximizing your Airbnb profit potential in Salina Cruz.
Seasonal Strategies for Maximizing Profit
- Peak Season: Maximize revenue through premium pricing and potentially longer minimum stays. Ensure high availability.
- Low Season: Offer competitive pricing, special promotions (e.g., extended stay discounts), and flexible cancellation policies. Target off-season travelers like remote workers or budget-conscious guests.
- Shoulder Seasons: Implement dynamic pricing that balances peak and low rates. Target weekend travelers or specific events. Offer slightly more flexible terms than peak season.
- Regularly analyze your own performance against these Salina Cruz seasonality benchmarks and adjust your pricing and availability strategy accordingly.
Best Areas for Airbnb Investment in Salina Cruz (2026)
Exploring the top neighborhoods for short-term rentals in Salina Cruz? This section highlights key areas, outlining why they are attractive for hosts and guests, along with notable local attractions. Consider these locations based on your target guest profile and investment strategy.
| Neighborhood / Area | Why Host Here? (Target Guests & Appeal) | Key Attractions & Landmarks |
|---|---|---|
| Salina Cruz Centro | The historic center of Salina Cruz with easy access to local shops, restaurants, and cultural sites. It's ideal for travelers wanting to experience the local lifestyle and amenities. | Plaza de la Constitución, Catedral de Salina Cruz, local markets, Calle Vicente Guerrero |
| Salina Cruz Beaches | Beautiful beaches with soft sand and warm waters, perfect for tourists looking to relax and enjoy water activities. A perfect spot for beach lovers and families. | Playa La Ventanilla, Playa Las Minitas, Playa La Mujeres, beach bars and seafood restaurants |
| Puerto de Salina Cruz | This area is bustling with maritime activity and offers unique views of the port. It's interesting for guests looking to witness local commerce and shipping operations. | Port views, fishing tours, local seafood markets |
| Iguanas de Salina Cruz | Less touristy and offering a more serene experience, this area is great for nature lovers and those seeking a peaceful retreat by the sea. | Iguana watching, natural reserves, secluded beaches |
| Bahías de Huatulco (nearby) | While not directly in Salina Cruz, this nearby tourist hotspot is known for its stunning bays and luxury resorts, making it an attractive alternative for visitors. | Cacaluta Bay, San Augustín Beach, Huatulco National Park, local dining experiences |
| Nearby National Parks | Proximity to national parks offers outdoor activities such as hiking, birdwatching, and exploring local wildlife, appealing to eco-tourists and adventure seekers. | Laguna de Chacahua National Park, Parque Nacional Huatulco, Cascadas de Atoyac |
| Oaxaca Culinary Scene | The renowned culinary scene of Oaxaca, located within reach, attracts food lovers from all over. This area can cater to those taking culinary tours or seeking local cuisine. | Oaxacan cooking classes, local markets, gastronomic festivals |
| Cinematic Views of the Pacific | Salina Cruz offers breathtaking views of the Pacific Ocean, perfect for romantic getaways or picturesque stays, appealing to couples and photographers. | Sunset viewpoints, romantic beachfront dining, zodiac whale watching |
Understanding Airbnb License Requirements & STR Laws in Salina Cruz (2026)
While Salina Cruz, Oaxaca, Mexico currently shows low STR regulations, specific Airbnb license requirements might still exist or change. Always verify the latest short term rental regulations and Airbnb license requirements directly with local government authorities for Salina Cruz to ensure full compliance before hosting.
(Source: AirROI data, 2026, finding no licensed listings among those analyzed)
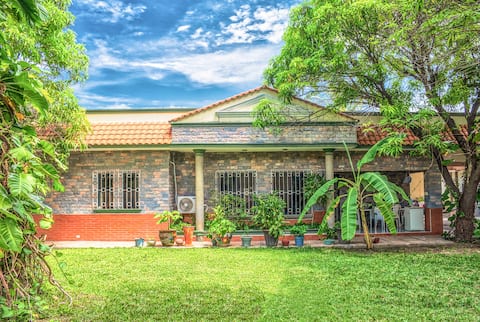
Top Performing Airbnb Properties in Salina Cruz (2026)
Benchmark your potential! Explore examples of top-performing Airbnb properties in Salina Cruzbased on Trailing Twelve Month (TTM) revenue. Analyze their characteristics, revenue, occupancy rate, and ADR to understand what drives success in this market.

Casa Paraíso Brazil
Entire Place • 2 bedrooms

House with pool on Punta Conejo beach
Private Room • 3 bedrooms
Large, private house & parking
Entire Place • 3 bedrooms

“La Casita and Terrace”
Entire Place • 2 bedrooms

Beachfront house for 6 people ideal for rest
Entire Place • 2 bedrooms

Fast Wifi. Large and free parking
Entire Place • N/A
Note: Performance varies based on location, size, amenities, seasonality, and management quality. Data reflects the past 12 months.
Top Performing Airbnb Hosts in Salina Cruz (2026)
Learn from the best! This table showcases top-performing Airbnb hosts in Salina Cruz based on the number of properties managed and estimated total revenue over the past year. Analyze their scale and performance metrics.
| Host Name | Properties | Grossing Revenue | Stay Reviews | Avg Rating |
|---|---|---|---|---|
| Alberto | 2 | $30,022 | 9 | 4.71/5.0 |
| Nelda Lourdes | 1 | $28,783 | 5 | 4.60/5.0 |
| Alfredo | 1 | $13,583 | 75 | 4.84/5.0 |
| Cesar | 5 | $13,143 | 169 | 4.74/5.0 |
| Richard | 1 | $11,016 | 210 | 4.85/5.0 |
| Informes | 6 | $6,943 | 89 | 4.72/5.0 |
| Maria Imelda | 1 | $6,066 | 46 | 4.70/5.0 |
| Luis Carlos | 1 | $5,060 | 9 | 4.89/5.0 |
| Bungalows Punta Conejo | 1 | $4,724 | 12 | 4.42/5.0 |
| Joaquin | 2 | $4,262 | 171 | 4.57/5.0 |
Analyzing the strategies of top hosts, such as their property selection, pricing, and guest communication, can offer valuable lessons for optimizing your own Airbnb operations in Salina Cruz.
Dive Deeper: Advanced Salina Cruz STR Market Data (2026)
Ready to unlock more insights? AirROI provides access to advanced metrics and comprehensive Airbnb data for Salina Cruz. Explore detailed analytics beyond this report to refine your investment strategy, optimize pricing, and maximize your vacation rental profits.
Explore Advanced MetricsSalina Cruz Short-Term Rental Market Composition (2026): Property & Room Types
Room Type Distribution
Property Type Distribution
Market Composition Insights for Salina Cruz
- The Salina Cruz Airbnb market composition is heavily skewed towards Entire Home/Apt listings, which make up 48.8% of the 41 active rentals. This indicates strong guest preference for privacy and space.
- However, a notable 48.8% share for Private Rooms suggests opportunities for budget-conscious travelers or hosts renting out spare rooms.
- Looking at the property type distribution in Salina Cruz, House properties are the most common (51.2%), reflecting the local real estate landscape.
- Houses represent a significant 51.2% portion, catering likely to families or larger groups.
- The presence of 7.3% Hotel/Boutique listings indicates integration with traditional hospitality.
Salina Cruz Airbnb Room Capacity Analysis (2026): Bedroom Distribution
Distribution of Listings by Number of Bedrooms
Room Capacity Insights for Salina Cruz
- The dominant room capacity in Salina Cruz is 1 bedroom listings, making up 36.6% of the market. This suggests a strong demand for properties suitable for couples or solo travelers.
- Together, 1 bedroom and 2 bedrooms properties represent 56.1% of the active Airbnb listings in Salina Cruz, indicating a high concentration in these sizes.
Salina Cruz Vacation Rental Guest Capacity Trends (2026)
Distribution of Listings by Guest Capacity
Guest Capacity Insights for Salina Cruz
- The most common guest capacity trend in Salina Cruz vacation rentals is listings accommodating 4 guests (19.5%). This suggests the primary traveler segment is likely small families or groups.
- Properties designed for 4 guests and 2 guests dominate the Salina Cruz STR market, accounting for 36.6% of listings.
- 14.6% of properties accommodate 6+ guests, serving the market segment for larger families or group travel in Salina Cruz.
- On average, properties in Salina Cruz are equipped to host 2.7 guests.
Salina Cruz Airbnb Booking Patterns (2026): Available vs. Booked Days
Available Days Distribution
Booked Days Distribution
Booking Pattern Insights for Salina Cruz
- The most common availability pattern in Salina Cruz falls within the 271-366 days range, representing 87.8% of listings. This suggests many properties have significant open periods on their calendars.
- Approximately 97.6% of listings show high availability (181+ days open annually), indicating potential for increased bookings or specific owner usage patterns.
- For booked days, the 1-30 days range is most frequent in Salina Cruz (61%), reflecting common guest stay durations or potential owner blocking patterns.
- A notable 4.9% of properties secure long booking periods (181+ days booked per year), highlighting successful long-term rental strategies or significant owner usage.
Salina Cruz Airbnb Minimum Stay Requirements Analysis
Distribution of Listings by Minimum Night Requirement
1 Night
31 listings
75.6% of total
2 Nights
7 listings
17.1% of total
3 Nights
1 listings
2.4% of total
30+ Nights
2 listings
4.9% of total
Key Insights
- The most prevalent minimum stay requirement in Salina Cruz is 1 Night, adopted by 75.6% of listings. This highlights the market's preference for shorter, flexible bookings.
- A strong majority (92.7%) of the Salina Cruz Airbnb data shows acceptance of very short stays (1-2 nights), indicating a dynamic, high-turnover market.
Recommendations
- Align with the market by considering a 1 Night minimum stay, as 75.6% of Salina Cruz hosts use this setting.
- Adjust minimum nights based on seasonality – potentially shorter during low season and longer during peak demand periods in Salina Cruz.
Salina Cruz Airbnb Cancellation Policy Trends Analysis (2026)
Super Strict 30 Days
1 listings
2.4% of total
Flexible
26 listings
63.4% of total
Moderate
4 listings
9.8% of total
Firm
10 listings
24.4% of total
Cancellation Policy Insights for Salina Cruz
- The prevailing Airbnb cancellation policy trend in Salina Cruz is Flexible, used by 63.4% of listings.
- The market strongly favors guest-friendly terms, with 73.2% of listings offering Flexible or Moderate policies. This suggests guests in Salina Cruz may expect booking flexibility.
Recommendations for Hosts
- Consider adopting a Flexible policy to align with the 63.4% market standard in Salina Cruz.
- Given the high prevalence of Flexible policies (63.4%), offering this can enhance booking appeal, especially during shoulder seasons.
- Regularly review your cancellation policy against competitors and market demand shifts in Salina Cruz.
Salina Cruz STR Booking Lead Time Analysis (2026)
Average Booking Lead Time by Month
Booking Lead Time Insights for Salina Cruz
- The overall average booking lead time for vacation rentals in Salina Cruz is 31 days.
- Guests book furthest in advance for stays during July (average 47 days), likely coinciding with peak travel demand or local events.
- The shortest booking windows occur for stays in February (average 10 days), indicating more last-minute travel plans during this time.
- Seasonally, Fall (35 days avg.) sees the longest lead times, while Winter (14 days avg.) has the shortest, reflecting typical travel planning cycles.
Recommendations for Hosts
- Use the overall average lead time (31 days) as a baseline for your pricing and availability strategy in Salina Cruz.
- For July stays, consider implementing length-of-stay discounts or slightly higher rates for bookings made less than 47 days out to capitalize on advance planning.
- During February, focus on last-minute booking availability and promotions, as guests book with very short notice (10 days avg.).
- Target marketing efforts for the Fall season well in advance (at least 35 days) to capture early planners.
- Monitor your own booking lead times against these Salina Cruz averages to identify opportunities for dynamic pricing adjustments.
Popular & Essential Airbnb Amenities in Salina Cruz (2026)
Amenity Prevalence
Amenity Insights for Salina Cruz
- Essential amenities in Salina Cruz that guests expect include: Wifi, Air conditioning. Lacking these (any) could significantly impact bookings.
- Popular amenities like Free parking on premises, TV, Kitchen are common but not universal. Offering these can provide a competitive edge.
Recommendations for Hosts
- Ensure your listing includes all essential amenities for Salina Cruz: Wifi, Air conditioning.
- Prioritize adding missing essentials: Wifi, Air conditioning.
- Consider adding popular differentiators like Free parking on premises or TV to increase appeal.
- Highlight unique or less common amenities you offer (e.g., hot tub, dedicated workspace, EV charger) in your listing description and photos.
- Regularly check competitor amenities in Salina Cruz to stay competitive.
Salina Cruz Airbnb Guest Demographics & Profile Analysis (2026)
Guest Profile Summary for Salina Cruz
- The typical guest profile for Airbnb in Salina Cruz consists of primarily domestic travelers (79%), often arriving from nearby Mexico City, typically belonging to the Post-2000s (Gen Z/Alpha) group (50%), primarily speaking Spanish or English.
- Domestic travelers account for 78.5% of guests.
- Key international markets include Mexico (78.5%) and United States (6.5%).
- Top languages spoken are Spanish (58.1%) followed by English (27.9%).
- A significant demographic segment is the Post-2000s (Gen Z/Alpha) group, representing 50% of guests.
Recommendations for Hosts
- Target domestic marketing efforts towards travelers from Mexico City and Puebla.
- Tailor amenities and listing descriptions to appeal to the dominant Post-2000s (Gen Z/Alpha) demographic (e.g., highlight fast WiFi, smart home features, local guides).
- Highlight unique local experiences or amenities relevant to the primary guest profile.
- Consider seasonal promotions aligned with peak travel times for key origin markets.
Nearby Short-Term Rental Market Comparison
How does the Salina Cruz Airbnb market stack up against its neighbors? Compare key performance metrics like average monthly revenue, ADR, and occupancy rates in surrounding areas to understand the broader regional STR landscape.
| Market | Active Properties | Monthly Revenue | Daily Rate | Avg. Occupancy |
|---|---|---|---|---|
| Huatulco | 10 | $2,925 | $306.55 | 41% |
| Bahía de Conejos | 53 | $2,343 | $360.20 | 33% |
| El Puertecito | 10 | $1,781 | $310.46 | 26% |
| Salchi | 28 | $1,752 | $223.03 | 31% |
| Crucecita | 37 | $1,740 | $240.44 | 34% |
| Bahías de Huatulco | 49 | $1,644 | $211.88 | 40% |
| Santa María Colotepec | 40 | $1,413 | $235.74 | 24% |
| Tangolunda | 19 | $1,247 | $246.00 | 30% |
| Santa María Huatulco | 106 | $1,123 | $208.04 | 28% |
| El Arrocito | 14 | $1,054 | $256.76 | 25% |