San Agustín de las Juntas Airbnb Market Analysis 2026: Short Term Rental Data & Vacation Rental Statistics in Oaxaca, Mexico
Is Airbnb profitable in San Agustín de las Juntas in 2026? Explore comprehensive Airbnb analytics for San Agustín de las Juntas, Oaxaca, Mexico to uncover income potential. This 2026 STR market report for San Agustín de las Juntas, based on AirROI data from February 2025 to January 2026, reveals key trends in the niche market of 20 active listings.
Whether you're considering an Airbnb investment in San Agustín de las Juntas, optimizing your existing vacation rental, or exploring rental arbitrage opportunities, understanding the San Agustín de las Juntas Airbnb data is crucial. Leveraging the low regulation environment is key to maximizing your short term rental income potential. Let's dive into the specifics.
Key San Agustín de las Juntas Airbnb Performance Metrics Overview
Monthly Airbnb Revenue Variations & Income Potential in San Agustín de las Juntas (2026)
Understanding the monthly revenue variations for Airbnb listings in San Agustín de las Juntas is key to maximizing your short term rental income potential. Seasonality significantly impacts earnings. Our analysis, based on data from the past 12 months, shows that the peak revenue month for STRs in San Agustín de las Juntas is typically September, while June often presents the lowest earnings, highlighting opportunities for strategic pricing adjustments during shoulder and low seasons. Explore the typical Airbnb income in San Agustín de las Juntas across different performance tiers:
- Best-in-class properties (Top 10%) achieve $1,317+ monthly, often utilizing dynamic pricing and superior guest experiences.
- Strong performing properties (Top 25%) earn $629 or more, indicating effective management and desirable locations/amenities.
- Typical properties (Median) generate around $269 per month, representing the average market performance.
- Entry-level properties (Bottom 25%) see earnings around $152, often with potential for optimization.
Average Monthly Airbnb Earnings Trend in San Agustín de las Juntas
San Agustín de las Juntas Airbnb Occupancy Rate Trends (2026)
Maximize your bookings by understanding the San Agustín de las Juntas STR occupancy trends. Seasonal demand shifts significantly influence how often properties are booked. Typically, Februarysees the highest demand (peak season occupancy), while May experiences the lowest (low season). Effective strategies, like adjusting minimum stays or offering promotions, can boost occupancy during slower periods. Here's how different property tiers perform in San Agustín de las Juntas:
- Best-in-class properties (Top 10%) achieve 43%+ occupancy, indicating high desirability and potentially optimized availability.
- Strong performing properties (Top 25%) maintain 24% or higher occupancy, suggesting good market fit and guest satisfaction.
- Typical properties (Median) have an occupancy rate around 11%.
- Entry-level properties (Bottom 25%) average 7% occupancy, potentially facing higher vacancy.
Average Monthly Occupancy Rate Trend in San Agustín de las Juntas
Average Daily Rate (ADR) Airbnb Trends in San Agustín de las Juntas (2026)
Effective short term rental pricing strategy in San Agustín de las Juntas involves understanding monthly ADR fluctuations. The Average Daily Rate (ADR) for Airbnb in San Agustín de las Juntas typically peaks in February and dips lowest during September. Leveraging Airbnb dynamic pricing tools or strategies based on this seasonality can significantly boost revenue. Here's a look at the typical nightly rates achieved:
- Best-in-class properties (Top 10%) command rates of $185+ per night, often due to premium features or locations.
- Strong performing properties (Top 25%) achieve nightly rates of $108 or more.
- Typical properties (Median) charge around $69 per night.
- Entry-level properties (Bottom 25%) earn around $52 per night.
Average Daily Rate (ADR) Trend by Month in San Agustín de las Juntas
Get Live San Agustín de las Juntas Market Intelligence 👇
Explore Real-time Analytics
Airbnb Seasonality Analysis & Trends in San Agustín de las Juntas (2026)
Peak Season (September, December, July)
- Revenue averages $660 per month
- Occupancy rates average 20.5%
- Daily rates average $101
Shoulder Season
- Revenue averages $463 per month
- Occupancy maintains around 18.2%
- Daily rates hold near $103
Low Season (May, June, November)
- Revenue drops to average $324 per month
- Occupancy decreases to average 11.8%
- Daily rates adjust to average $102
Seasonality Insights for San Agustín de las Juntas
- The Airbnb seasonality in San Agustín de las Juntas shows highly seasonal trends requiring careful strategy. While the sections above show seasonal averages, it's also insightful to look at the extremes:
- During the high season, the absolute peak month showcases San Agustín de las Juntas's highest earning potential, with monthly revenues capable of climbing to $736, occupancy reaching a high of 25.5%, and ADRs peaking at $112.
- Conversely, the slowest single month of the year, typically falling within the low season, marks the market's lowest point. In this month, revenue might dip to $296, occupancy could drop to 10.2%, and ADRs may adjust down to $96.
- Understanding both the seasonal averages and these monthly peaks and troughs in revenue, occupancy, and ADR is crucial for maximizing your Airbnb profit potential in San Agustín de las Juntas.
Seasonal Strategies for Maximizing Profit
- Peak Season: Maximize revenue through premium pricing and potentially longer minimum stays. Ensure high availability.
- Low Season: Offer competitive pricing, special promotions (e.g., extended stay discounts), and flexible cancellation policies. Target off-season travelers like remote workers or budget-conscious guests.
- Shoulder Seasons: Implement dynamic pricing that balances peak and low rates. Target weekend travelers or specific events. Offer slightly more flexible terms than peak season.
- Regularly analyze your own performance against these San Agustín de las Juntas seasonality benchmarks and adjust your pricing and availability strategy accordingly.
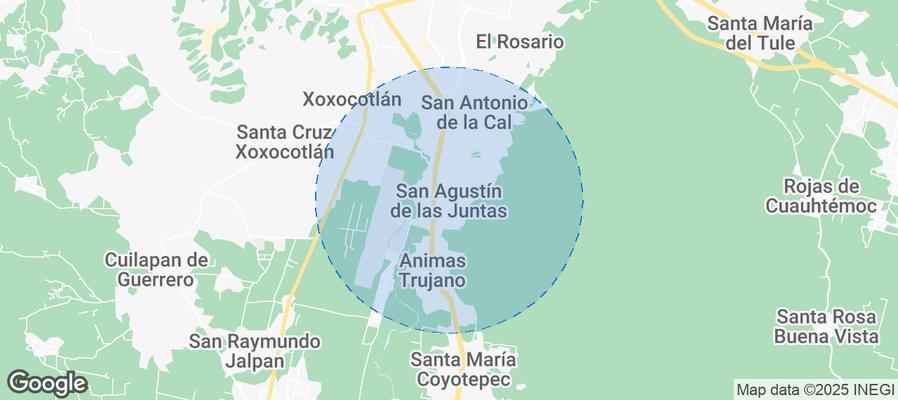
Best Areas for Airbnb Investment in San Agustín de las Juntas (2026)
Exploring the top neighborhoods for short-term rentals in San Agustín de las Juntas? This section highlights key areas, outlining why they are attractive for hosts and guests, along with notable local attractions. Consider these locations based on your target guest profile and investment strategy.
| Neighborhood / Area | Why Host Here? (Target Guests & Appeal) | Key Attractions & Landmarks |
|---|---|---|
| Centro | The heart of San Agustín de las Juntas, filled with local markets, restaurants, and cultural sites. It's a bustling area that attracts both tourists and locals, making it ideal for Airbnb hosting. | Plaza Principal, Local markets, Church of San Agustin, Artisan shops, Restaurants offering local cuisine |
| Zócalo | A popular gathering place that showcases the local culture and community events. Visitors love being in the center of town with easy access to attractions and entertainment. | Zócalo Park, City Hall, Cultural events, Nearby coffee shops, Historical architecture |
| San Agustín Ecological Park | A serene escape that offers nature trails and beautiful landscapes. Ideal for travelers looking to connect with nature and enjoy outdoor activities. | Nature trails, Bike rentals, Wildlife observation, Picnic areas, Scenic views |
| El Tule | Home to the famous Tule Tree, one of the largest trees in the world. This area attracts tourists interested in nature and unique sights. | Tule Tree, Local artisan shops, Cultural events, Nearby restaurants offering regional dishes |
| San Pablo Villa de Mitla | A short drive from San Agustín, famous for its archaeological site. A great area for history enthusiasts and those exploring the rich Zapotec culture. | Mitla ruins, Archaeological museum, Craft markets, Restaurants with traditional Oaxacan food |
| Ocotlán de Morelos | Known for its vibrant markets and artisan crafts, this area appeals to visitors looking for authentic local experiences and handmade goods. | Ocotlán Market, Artisan workshops, Local cuisine, Cultural festivals, Historical sites |
| Santa María del Tule | Another area near Tule, known for its artistic community and beautiful surroundings, making it a tranquil stay for visitors. It's also close enough for day trips to Oaxaca City. | Art galleries, Culinary experiences, Historic sites, Natural scenery, Local artisan markets |
| Oaxaca City | While not within San Agustín de las Juntas itself, it is a major cultural and culinary hub that draws a large number of tourists. Many visitors look for stays in nearby areas to explore the city. | Monte Albán archaeological site, Oaxaca Cathedral, Local markets and food tours, Cultural festivals, Art galleries |
Understanding Airbnb License Requirements & STR Laws in San Agustín de las Juntas (2026)
While San Agustín de las Juntas, Oaxaca, Mexico currently shows low STR regulations, specific Airbnb license requirements might still exist or change. Always verify the latest short term rental regulations and Airbnb license requirements directly with local government authorities for San Agustín de las Juntas to ensure full compliance before hosting.
(Source: AirROI data, 2026, finding no licensed listings among those analyzed)
Top Performing Airbnb Properties in San Agustín de las Juntas (2026)
Benchmark your potential! Explore examples of top-performing Airbnb properties in San Agustín de las Juntasbased on Trailing Twelve Month (TTM) revenue. Analyze their characteristics, revenue, occupancy rate, and ADR to understand what drives success in this market.
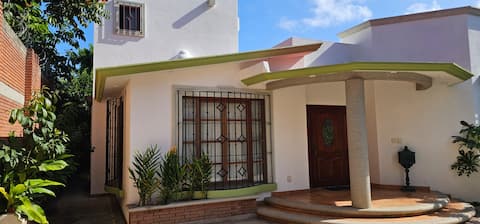
Beautiful new house.
Entire Place • 2 bedrooms
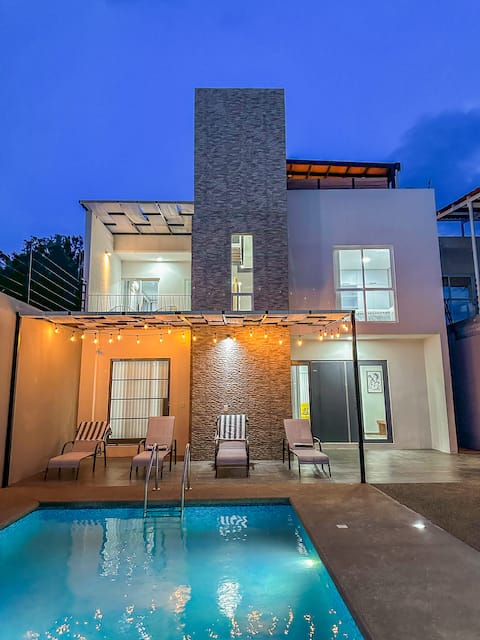
Mountain View and Pool
Entire Place • 3 bedrooms
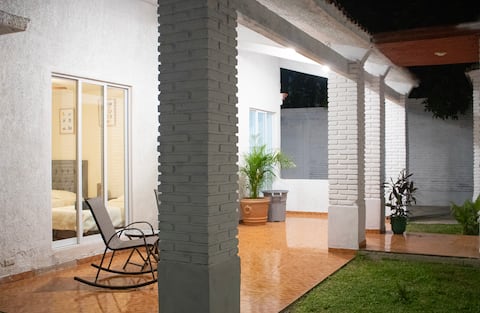
Casa San Agustín
Entire Place • 3 bedrooms
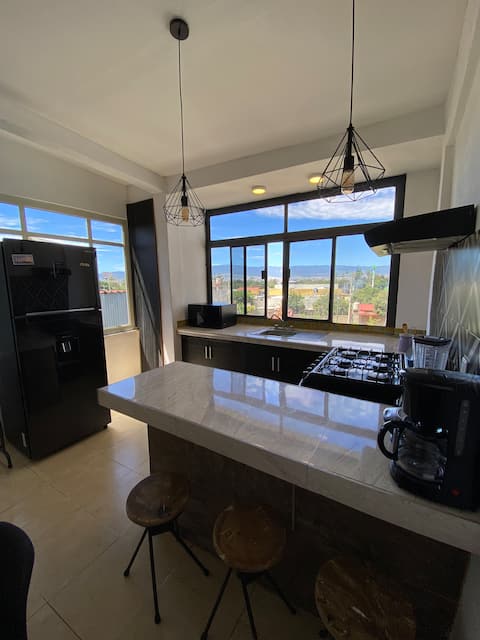
Panoramic apartment, very close to the airport.
Entire Place • 2 bedrooms
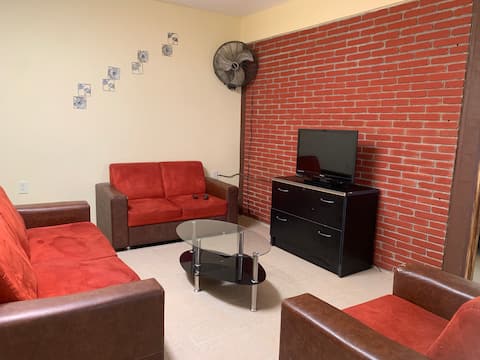
Ideal apartment to rest near the Airport.
Entire Place • 2 bedrooms

Casarú San Agustín Airport
Entire Place • 6 bedrooms
Note: Performance varies based on location, size, amenities, seasonality, and management quality. Data reflects the past 12 months.
Top Performing Airbnb Hosts in San Agustín de las Juntas (2026)
Learn from the best! This table showcases top-performing Airbnb hosts in San Agustín de las Juntas based on the number of properties managed and estimated total revenue over the past year. Analyze their scale and performance metrics.
| Host Name | Properties | Grossing Revenue | Stay Reviews | Avg Rating |
|---|---|---|---|---|
| Josmar Alexis | 4 | $10,738 | 85 | 4.85/5.0 |
| Sandra | 1 | $9,255 | 12 | 5.00/5.0 |
| Gloria | 1 | $7,539 | 18 | 4.78/5.0 |
| Almita | 1 | $5,725 | 11 | 4.64/5.0 |
| DannySG | 1 | $4,362 | 4 | 4.75/5.0 |
| Flory | 1 | $4,231 | 8 | 4.88/5.0 |
| Moy | 1 | $3,969 | 46 | 4.93/5.0 |
| Norma Edith | 1 | $3,912 | 39 | 4.97/5.0 |
| Benny | 1 | $2,551 | 10 | 5.00/5.0 |
| Roberto | 4 | $1,247 | 21 | 5.00/5.0 |
Analyzing the strategies of top hosts, such as their property selection, pricing, and guest communication, can offer valuable lessons for optimizing your own Airbnb operations in San Agustín de las Juntas.
Dive Deeper: Advanced San Agustín de las Juntas STR Market Data (2026)
Ready to unlock more insights? AirROI provides access to advanced metrics and comprehensive Airbnb data for San Agustín de las Juntas. Explore detailed analytics beyond this report to refine your investment strategy, optimize pricing, and maximize your vacation rental profits.
Explore Advanced MetricsSan Agustín de las Juntas Short-Term Rental Market Composition (2026): Property & Room Types
Room Type Distribution
Property Type Distribution
Market Composition Insights for San Agustín de las Juntas
- The San Agustín de las Juntas Airbnb market composition is heavily skewed towards Entire Home/Apt listings, which make up 65% of the 20 active rentals. This indicates strong guest preference for privacy and space.
- However, a notable 35% share for Private Rooms suggests opportunities for budget-conscious travelers or hosts renting out spare rooms.
- Looking at the property type distribution in San Agustín de las Juntas, Hotel/Boutique properties are the most common (35%), reflecting the local real estate landscape.
- Houses represent a significant 30% portion, catering likely to families or larger groups.
- The presence of 35% Hotel/Boutique listings indicates integration with traditional hospitality.
San Agustín de las Juntas Airbnb Room Capacity Analysis (2026): Bedroom Distribution
Distribution of Listings by Number of Bedrooms
Room Capacity Insights for San Agustín de las Juntas
- The dominant room capacity in San Agustín de las Juntas is 2 bedrooms listings, making up 40% of the market. This suggests a strong demand for properties suitable for couples or solo travelers.
- Together, 2 bedrooms and 1 bedroom properties represent 80.0% of the active Airbnb listings in San Agustín de las Juntas, indicating a high concentration in these sizes.
San Agustín de las Juntas Vacation Rental Guest Capacity Trends (2026)
Distribution of Listings by Guest Capacity
Guest Capacity Insights for San Agustín de las Juntas
- The most common guest capacity trend in San Agustín de las Juntas vacation rentals is listings accommodating 2 guests (30%). This suggests the primary traveler segment is likely couples or solo travelers.
- Properties designed for 2 guests and 5 guests dominate the San Agustín de las Juntas STR market, accounting for 45.0% of listings.
- 30.0% of properties accommodate 6+ guests, serving the market segment for larger families or group travel in San Agustín de las Juntas.
- On average, properties in San Agustín de las Juntas are equipped to host 4.2 guests.
San Agustín de las Juntas Airbnb Booking Patterns (2026): Available vs. Booked Days
Available Days Distribution
Booked Days Distribution
Booking Pattern Insights for San Agustín de las Juntas
- The most common availability pattern in San Agustín de las Juntas falls within the 271-366 days range, representing 95% of listings. This suggests many properties have significant open periods on their calendars.
- Approximately 100.0% of listings show high availability (181+ days open annually), indicating potential for increased bookings or specific owner usage patterns.
- For booked days, the 1-30 days range is most frequent in San Agustín de las Juntas (60%), reflecting common guest stay durations or potential owner blocking patterns.
San Agustín de las Juntas Airbnb Minimum Stay Requirements Analysis
Distribution of Listings by Minimum Night Requirement
1 Night
10 listings
50% of total
2 Nights
3 listings
15% of total
3 Nights
5 listings
25% of total
4-6 Nights
1 listings
5% of total
30+ Nights
1 listings
5% of total
Key Insights
- The most prevalent minimum stay requirement in San Agustín de las Juntas is 1 Night, adopted by 50% of listings. This highlights the market's preference for shorter, flexible bookings.
- A strong majority (65.0%) of the San Agustín de las Juntas Airbnb data shows acceptance of very short stays (1-2 nights), indicating a dynamic, high-turnover market.
Recommendations
- Align with the market by considering a 1 Night minimum stay, as 50% of San Agustín de las Juntas hosts use this setting.
- Adjust minimum nights based on seasonality – potentially shorter during low season and longer during peak demand periods in San Agustín de las Juntas.
San Agustín de las Juntas Airbnb Cancellation Policy Trends Analysis (2026)
Flexible
12 listings
60% of total
Moderate
4 listings
20% of total
Firm
3 listings
15% of total
Strict
1 listings
5% of total
Cancellation Policy Insights for San Agustín de las Juntas
- The prevailing Airbnb cancellation policy trend in San Agustín de las Juntas is Flexible, used by 60% of listings.
- The market strongly favors guest-friendly terms, with 80.0% of listings offering Flexible or Moderate policies. This suggests guests in San Agustín de las Juntas may expect booking flexibility.
- Strict cancellation policies are quite rare (5%), potentially making listings with this policy less competitive unless justified by high demand or property type.
Recommendations for Hosts
- Consider adopting a Flexible policy to align with the 60% market standard in San Agustín de las Juntas.
- Given the high prevalence of Flexible policies (60%), offering this can enhance booking appeal, especially during shoulder seasons.
- Using a Strict policy might deter some guests, as only 5% of listings use it. Evaluate if potential revenue protection outweighs possible lower booking rates.
- Regularly review your cancellation policy against competitors and market demand shifts in San Agustín de las Juntas.
San Agustín de las Juntas STR Booking Lead Time Analysis (2026)
Average Booking Lead Time by Month
Booking Lead Time Insights for San Agustín de las Juntas
- The overall average booking lead time for vacation rentals in San Agustín de las Juntas is 49 days.
- Guests book furthest in advance for stays during October (average 76 days), likely coinciding with peak travel demand or local events.
- The shortest booking windows occur for stays in June (average 9 days), indicating more last-minute travel plans during this time.
- Seasonally, Winter (45 days avg.) sees the longest lead times, while Spring (15 days avg.) has the shortest, reflecting typical travel planning cycles.
Recommendations for Hosts
- Use the overall average lead time (49 days) as a baseline for your pricing and availability strategy in San Agustín de las Juntas.
- For October stays, consider implementing length-of-stay discounts or slightly higher rates for bookings made less than 76 days out to capitalize on advance planning.
- During June, focus on last-minute booking availability and promotions, as guests book with very short notice (9 days avg.).
- Target marketing efforts for the Winter season well in advance (at least 45 days) to capture early planners.
- Monitor your own booking lead times against these San Agustín de las Juntas averages to identify opportunities for dynamic pricing adjustments.
Popular & Essential Airbnb Amenities in San Agustín de las Juntas (2026)
Amenity Prevalence
Amenity Insights for San Agustín de las Juntas
- Essential amenities in San Agustín de las Juntas that guests expect include: Wifi, TV. Lacking these (any) could significantly impact bookings.
- Popular amenities like Iron, Hot water, Bed linens are common but not universal. Offering these can provide a competitive edge.
Recommendations for Hosts
- Ensure your listing includes all essential amenities for San Agustín de las Juntas: Wifi, TV.
- Prioritize adding missing essentials: TV.
- Consider adding popular differentiators like Iron or Hot water to increase appeal.
- Highlight unique or less common amenities you offer (e.g., hot tub, dedicated workspace, EV charger) in your listing description and photos.
- Regularly check competitor amenities in San Agustín de las Juntas to stay competitive.
San Agustín de las Juntas Airbnb Guest Demographics & Profile Analysis (2026)
Guest Profile Summary for San Agustín de las Juntas
- The typical guest profile for Airbnb in San Agustín de las Juntas consists of a mix of domestic (51%) and international guests, often arriving from nearby Mexico City, typically belonging to the Post-2000s (Gen Z/Alpha) group (50%), primarily speaking Spanish or English.
- Domestic travelers account for 51.1% of guests.
- Key international markets include Mexico (51.1%) and United States (37.8%).
- Top languages spoken are Spanish (45.9%) followed by English (40.5%).
- A significant demographic segment is the Post-2000s (Gen Z/Alpha) group, representing 50% of guests.
Recommendations for Hosts
- Balance marketing efforts between domestic and international channels based on the guest mix.
- Tailor amenities and listing descriptions to appeal to the dominant Post-2000s (Gen Z/Alpha) demographic (e.g., highlight fast WiFi, smart home features, local guides).
- Highlight unique local experiences or amenities relevant to the primary guest profile.
- Consider seasonal promotions aligned with peak travel times for key origin markets.
Nearby Short-Term Rental Market Comparison
How does the San Agustín de las Juntas Airbnb market stack up against its neighbors? Compare key performance metrics like average monthly revenue, ADR, and occupancy rates in surrounding areas to understand the broader regional STR landscape.
| Market | Active Properties | Monthly Revenue | Daily Rate | Avg. Occupancy |
|---|---|---|---|---|
| Oaxaca City | 3,294 | $889 | $99.01 | 34% |
| Oaxaca | 409 | $862 | $118.03 | 32% |
| Tlalixtac de Cabrera | 37 | $761 | $127.69 | 24% |
| San Agustín Yatareni | 13 | $707 | $165.56 | 25% |
| San Francisco Tutla | 19 | $697 | $97.65 | 22% |
| San José del Pacífico | 80 | $627 | $100.69 | 25% |
| San Andrés Huayapam | 25 | $516 | $89.10 | 27% |
| San Sebastián Tutla | 17 | $465 | $127.37 | 21% |
| Santa Cruz Etla | 28 | $459 | $116.67 | 20% |
| San Francisco Lachigoló | 18 | $458 | $93.09 | 21% |