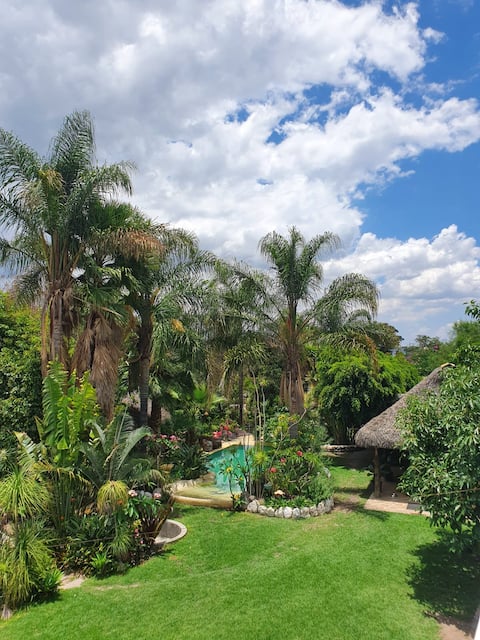
Puebla Airbnb Market Analysis 2026: Short Term Rental Data & Vacation Rental Statistics in Puebla, Mexico
Is Airbnb profitable in Puebla in 2026? Explore comprehensive Airbnb analytics for Puebla, Puebla, Mexico to uncover income potential. This 2026 STR market report for Puebla, based on AirROI data from February 2025 to January 2026, reveals key trends in the market of 218 active listings.
Whether you're considering an Airbnb investment in Puebla, optimizing your existing vacation rental, or exploring rental arbitrage opportunities, understanding the Puebla Airbnb data is crucial. Leveraging the low regulation environment is key to maximizing your short term rental income potential. Let's dive into the specifics.
Key Puebla Airbnb Performance Metrics Overview
Monthly Airbnb Revenue Variations & Income Potential in Puebla (2026)
Understanding the monthly revenue variations for Airbnb listings in Puebla is key to maximizing your short term rental income potential. Seasonality significantly impacts earnings. Our analysis, based on data from the past 12 months, shows that the peak revenue month for STRs in Puebla is typically April, while May often presents the lowest earnings, highlighting opportunities for strategic pricing adjustments during shoulder and low seasons. Explore the typical Airbnb income in Puebla across different performance tiers:
- Best-in-class properties (Top 10%) achieve $1,499+ monthly, often utilizing dynamic pricing and superior guest experiences.
- Strong performing properties (Top 25%) earn $836 or more, indicating effective management and desirable locations/amenities.
- Typical properties (Median) generate around $438 per month, representing the average market performance.
- Entry-level properties (Bottom 25%) see earnings around $188, often with potential for optimization.
Average Monthly Airbnb Earnings Trend in Puebla
Puebla Airbnb Occupancy Rate Trends (2026)
Maximize your bookings by understanding the Puebla STR occupancy trends. Seasonal demand shifts significantly influence how often properties are booked. Typically, Decembersees the highest demand (peak season occupancy), while May experiences the lowest (low season). Effective strategies, like adjusting minimum stays or offering promotions, can boost occupancy during slower periods. Here's how different property tiers perform in Puebla:
- Best-in-class properties (Top 10%) achieve 62%+ occupancy, indicating high desirability and potentially optimized availability.
- Strong performing properties (Top 25%) maintain 47% or higher occupancy, suggesting good market fit and guest satisfaction.
- Typical properties (Median) have an occupancy rate around 28%.
- Entry-level properties (Bottom 25%) average 14% occupancy, potentially facing higher vacancy.
Average Monthly Occupancy Rate Trend in Puebla
Average Daily Rate (ADR) Airbnb Trends in Puebla (2026)
Effective short term rental pricing strategy in Puebla involves understanding monthly ADR fluctuations. The Average Daily Rate (ADR) for Airbnb in Puebla typically peaks in December and dips lowest during March. Leveraging Airbnb dynamic pricing tools or strategies based on this seasonality can significantly boost revenue. Here's a look at the typical nightly rates achieved:
- Best-in-class properties (Top 10%) command rates of $97+ per night, often due to premium features or locations.
- Strong performing properties (Top 25%) achieve nightly rates of $59 or more.
- Typical properties (Median) charge around $40 per night.
- Entry-level properties (Bottom 25%) earn around $26 per night.
Average Daily Rate (ADR) Trend by Month in Puebla
Get Live Puebla Market Intelligence 👇

Explore Real-time Analytics
Airbnb Seasonality Analysis & Trends in Puebla (2026)
Peak Season (April, March, December)
- Revenue averages $1,088 per month
- Occupancy rates average 31.5%
- Daily rates average $55
Shoulder Season
- Revenue averages $640 per month
- Occupancy maintains around 35.0%
- Daily rates hold near $56
Low Season (January, May, June)
- Revenue drops to average $434 per month
- Occupancy decreases to average 26.8%
- Daily rates adjust to average $54
Seasonality Insights for Puebla
- The Airbnb seasonality in Puebla shows highly seasonal trends requiring careful strategy. While the sections above show seasonal averages, it's also insightful to look at the extremes:
- During the high season, the absolute peak month showcases Puebla's highest earning potential, with monthly revenues capable of climbing to $1,449, occupancy reaching a high of 44.8%, and ADRs peaking at $62.
- Conversely, the slowest single month of the year, typically falling within the low season, marks the market's lowest point. In this month, revenue might dip to $265, occupancy could drop to 12.2%, and ADRs may adjust down to $51.
- Understanding both the seasonal averages and these monthly peaks and troughs in revenue, occupancy, and ADR is crucial for maximizing your Airbnb profit potential in Puebla.
Seasonal Strategies for Maximizing Profit
- Peak Season: Maximize revenue through premium pricing and potentially longer minimum stays. Ensure high availability.
- Low Season: Offer competitive pricing, special promotions (e.g., extended stay discounts), and flexible cancellation policies. Target off-season travelers like remote workers or budget-conscious guests.
- Shoulder Seasons: Implement dynamic pricing that balances peak and low rates. Target weekend travelers or specific events. Offer slightly more flexible terms than peak season.
- Regularly analyze your own performance against these Puebla seasonality benchmarks and adjust your pricing and availability strategy accordingly.
Best Areas for Airbnb Investment in Puebla (2026)
Exploring the top neighborhoods for short-term rentals in Puebla? This section highlights key areas, outlining why they are attractive for hosts and guests, along with notable local attractions. Consider these locations based on your target guest profile and investment strategy.
| Neighborhood / Area | Why Host Here? (Target Guests & Appeal) | Key Attractions & Landmarks |
|---|---|---|
| Historic Center | Puebla's UNESCO World Heritage Site, known for its beautiful colonial architecture and rich history. Ideal for tourists wanting to explore the culture and history of Puebla. | Puebla Cathedral, Chapel of the Rosary, Amparo Museum, Zócalo de Puebla, Fort of Loreto |
| Cholula | Famous for its archaeological site and the Great Pyramid of Cholula, one of the largest pyramids in the world. A popular destination for those interested in pre-Hispanic history and culture. | Great Pyramid of Cholula, Cholula Archaeological Site, Church of Our Lady of Remedies, Zocalo de Cholula, Cholula's artisanal markets |
| Angelopolis | The modern commercial district of Puebla, perfect for business travelers and shoppers. Home to malls, restaurants, and a vibrant urban lifestyle. | Angelopolis Mall, Calle 5 de Mayo, Parque de los Fuentes, Cinépolis Angelópolis, restaurants and cafes |
| Merced | A traditional neighborhood known for its rich culinary offerings and markets. Great for tourists seeking authentic local experiences and food. | Puebla Market (Mercado de la Merced), local street food, traditional restaurants, craft shops, Puebla's local culture |
| Los Fuertes | A scenic area with historical significance and beautiful parks. It offers a mix of outdoor activities and historical exploration. | Los Fuertes de Loreto y Guadalupe, Parque Bicentenario, viewpoints of Puebla City, historical reenactments, picnic areas |
| La Paz | A vibrant residential and commercial area with many bars, restaurants, and lively nightlife. Popular among locals and tourists looking for entertainment. | La Paz Avenue, nightlife spots, restaurants, cultural events, local art |
| San Francisco | A central neighborhood known for its close proximity to schools and hospitals, attracting families and long-term stays. | El Barrio de San Francisco, schools and universities, Puebla General Hospital, cultural heritage sites, local restaurants |
| Barrios Altos | A traditional area with a rich cultural heritage, ideal for visitors looking for authenticity and local traditions. | San Juan de los Azulejos, cultural festivals, local artisans, traditional Puebla cuisine, historical sites |
Understanding Airbnb License Requirements & STR Laws in Puebla (2026)
While Puebla, Puebla, Mexico currently shows low STR regulations, specific Airbnb license requirements might still exist or change. Always verify the latest short term rental regulations and Airbnb license requirements directly with local government authorities for Puebla to ensure full compliance before hosting.
(Source: AirROI data, 2026, finding no licensed listings among those analyzed)
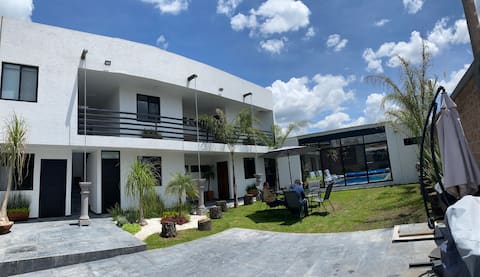
Top Performing Airbnb Properties in Puebla (2026)
Benchmark your potential! Explore examples of top-performing Airbnb properties in Pueblabased on Trailing Twelve Month (TTM) revenue. Analyze their characteristics, revenue, occupancy rate, and ADR to understand what drives success in this market.

Quinto Elemento Valsequillo House
Entire Place • 5 bedrooms

Casa la Isla, on Lake Valsequillo
Entire Place • 5 bedrooms
CasaYuyum: Gorgeous and enjoyable place in Atlixco
Entire Place • 3 bedrooms

Amazing central villa
Entire Place • 6 bedrooms
FINCA SAN MATEO VALSEQUILLO (SAN MATEO VALSEQUILLO ESTATE)
Entire Place • 5 bedrooms
Spacious House Downtown All Services Wifi
Entire Place • 6 bedrooms
Note: Performance varies based on location, size, amenities, seasonality, and management quality. Data reflects the past 12 months.
Top Performing Airbnb Hosts in Puebla (2026)
Learn from the best! This table showcases top-performing Airbnb hosts in Puebla based on the number of properties managed and estimated total revenue over the past year. Analyze their scale and performance metrics.
| Host Name | Properties | Grossing Revenue | Stay Reviews | Avg Rating |
|---|---|---|---|---|
| Paola | 1 | $75,128 | 50 | 4.92/5.0 |
| Fernando Martínez | 7 | $54,883 | 196 | 4.91/5.0 |
| Alejandro | 1 | $46,839 | 57 | 4.95/5.0 |
| Erick | 1 | $45,479 | 39 | 4.95/5.0 |
| Maria Del Rayo | 11 | $44,328 | 163 | 4.59/5.0 |
| Casona San Marcos | 4 | $36,749 | 39 | 4.59/5.0 |
| Arti | 4 | $35,231 | 217 | 4.98/5.0 |
| Mayo | 3 | $27,414 | 47 | 4.76/5.0 |
| Juan Gonzalez | 1 | $18,944 | 84 | 4.87/5.0 |
| Elias | 9 | $18,512 | 272 | 4.26/5.0 |
Analyzing the strategies of top hosts, such as their property selection, pricing, and guest communication, can offer valuable lessons for optimizing your own Airbnb operations in Puebla.
Dive Deeper: Advanced Puebla STR Market Data (2026)
Ready to unlock more insights? AirROI provides access to advanced metrics and comprehensive Airbnb data for Puebla. Explore detailed analytics beyond this report to refine your investment strategy, optimize pricing, and maximize your vacation rental profits.
Explore Advanced MetricsPuebla Short-Term Rental Market Composition (2026): Property & Room Types
Room Type Distribution
Property Type Distribution
Market Composition Insights for Puebla
- The Puebla Airbnb market composition is heavily skewed towards Entire Home/Apt listings, which make up 69.7% of the 218 active rentals. This indicates strong guest preference for privacy and space.
- However, a notable 29.4% share for Private Rooms suggests opportunities for budget-conscious travelers or hosts renting out spare rooms.
- Looking at the property type distribution in Puebla, Apartment/Condo properties are the most common (58.7%), reflecting the local real estate landscape.
- Houses represent a significant 24.3% portion, catering likely to families or larger groups.
- The presence of 7.3% Hotel/Boutique listings indicates integration with traditional hospitality.
- Smaller segments like others (combined 3.7%) offer potential for unique stay experiences.
Puebla Airbnb Room Capacity Analysis (2026): Bedroom Distribution
Distribution of Listings by Number of Bedrooms
Room Capacity Insights for Puebla
- The dominant room capacity in Puebla is 1 bedroom listings, making up 34.4% of the market. This suggests a strong demand for properties suitable for couples or solo travelers.
- Together, 1 bedroom and 2 bedrooms properties represent 60.5% of the active Airbnb listings in Puebla, indicating a high concentration in these sizes.
Puebla Vacation Rental Guest Capacity Trends (2026)
Distribution of Listings by Guest Capacity
Guest Capacity Insights for Puebla
- The most common guest capacity trend in Puebla vacation rentals is listings accommodating 2 guests (24.8%). This suggests the primary traveler segment is likely couples or solo travelers.
- Properties designed for 2 guests and 4 guests dominate the Puebla STR market, accounting for 42.2% of listings.
- 21.6% of properties accommodate 6+ guests, serving the market segment for larger families or group travel in Puebla.
- On average, properties in Puebla are equipped to host 3.3 guests.
Puebla Airbnb Booking Patterns (2026): Available vs. Booked Days
Available Days Distribution
Booked Days Distribution
Booking Pattern Insights for Puebla
- The most common availability pattern in Puebla falls within the 271-366 days range, representing 65.1% of listings. This suggests many properties have significant open periods on their calendars.
- Approximately 97.2% of listings show high availability (181+ days open annually), indicating potential for increased bookings or specific owner usage patterns.
- For booked days, the 31-90 days range is most frequent in Puebla (42.2%), reflecting common guest stay durations or potential owner blocking patterns.
- A notable 2.8% of properties secure long booking periods (181+ days booked per year), highlighting successful long-term rental strategies or significant owner usage.
Puebla Airbnb Minimum Stay Requirements Analysis
Distribution of Listings by Minimum Night Requirement
1 Night
139 listings
63.8% of total
2 Nights
38 listings
17.4% of total
3 Nights
12 listings
5.5% of total
4-6 Nights
3 listings
1.4% of total
7-29 Nights
1 listings
0.5% of total
30+ Nights
25 listings
11.5% of total
Key Insights
- The most prevalent minimum stay requirement in Puebla is 1 Night, adopted by 63.8% of listings. This highlights the market's preference for shorter, flexible bookings.
- A strong majority (81.2%) of the Puebla Airbnb data shows acceptance of very short stays (1-2 nights), indicating a dynamic, high-turnover market.
- A significant segment (11.5%) caters to monthly stays (30+ nights) in Puebla, pointing to opportunities in the extended-stay market.
Recommendations
- Align with the market by considering a 1 Night minimum stay, as 63.8% of Puebla hosts use this setting.
- Explore offering discounts for stays of 30+ nights to attract the 11.5% of the market seeking extended stays.
- Adjust minimum nights based on seasonality – potentially shorter during low season and longer during peak demand periods in Puebla.
Puebla Airbnb Cancellation Policy Trends Analysis (2026)
Flexible
97 listings
44.5% of total
Moderate
60 listings
27.5% of total
Firm
50 listings
22.9% of total
Strict
11 listings
5% of total
Cancellation Policy Insights for Puebla
- The prevailing Airbnb cancellation policy trend in Puebla is Flexible, used by 44.5% of listings.
- The market strongly favors guest-friendly terms, with 72.0% of listings offering Flexible or Moderate policies. This suggests guests in Puebla may expect booking flexibility.
- Strict cancellation policies are quite rare (5%), potentially making listings with this policy less competitive unless justified by high demand or property type.
Recommendations for Hosts
- Consider adopting a Flexible policy to align with the 44.5% market standard in Puebla.
- Using a Strict policy might deter some guests, as only 5% of listings use it. Evaluate if potential revenue protection outweighs possible lower booking rates.
- Regularly review your cancellation policy against competitors and market demand shifts in Puebla.
Puebla STR Booking Lead Time Analysis (2026)
Average Booking Lead Time by Month
Booking Lead Time Insights for Puebla
- The overall average booking lead time for vacation rentals in Puebla is 17 days.
- Guests book furthest in advance for stays during November (average 40 days), likely coinciding with peak travel demand or local events.
- The shortest booking windows occur for stays in May (average 3 days), indicating more last-minute travel plans during this time.
- Seasonally, Fall (25 days avg.) sees the longest lead times, while Spring (13 days avg.) has the shortest, reflecting typical travel planning cycles.
Recommendations for Hosts
- Use the overall average lead time (17 days) as a baseline for your pricing and availability strategy in Puebla.
- For November stays, consider implementing length-of-stay discounts or slightly higher rates for bookings made less than 40 days out to capitalize on advance planning.
- During May, focus on last-minute booking availability and promotions, as guests book with very short notice (3 days avg.).
- Target marketing efforts for the Fall season well in advance (at least 25 days) to capture early planners.
- Monitor your own booking lead times against these Puebla averages to identify opportunities for dynamic pricing adjustments.
Popular & Essential Airbnb Amenities in Puebla (2026)
Amenity Prevalence
Amenity Insights for Puebla
- Essential amenities in Puebla that guests expect include: Wifi. Lacking these (this) could significantly impact bookings.
- Popular amenities like TV, Hot water, Kitchen are common but not universal. Offering these can provide a competitive edge.
Recommendations for Hosts
- Ensure your listing includes all essential amenities for Puebla: Wifi.
- Prioritize adding missing essentials: Wifi.
- Consider adding popular differentiators like TV or Hot water to increase appeal.
- Highlight unique or less common amenities you offer (e.g., hot tub, dedicated workspace, EV charger) in your listing description and photos.
- Regularly check competitor amenities in Puebla to stay competitive.
Puebla Airbnb Guest Demographics & Profile Analysis (2026)
Guest Profile Summary for Puebla
- The typical guest profile for Airbnb in Puebla consists of primarily domestic travelers (83%), often arriving from nearby Mexico City, typically belonging to the Post-2000s (Gen Z/Alpha) group (50%), primarily speaking Spanish or English.
- Domestic travelers account for 82.9% of guests.
- Key international markets include Mexico (82.9%) and United States (8.3%).
- Top languages spoken are Spanish (53.2%) followed by English (33.7%).
- A significant demographic segment is the Post-2000s (Gen Z/Alpha) group, representing 50% of guests.
Recommendations for Hosts
- Target domestic marketing efforts towards travelers from Mexico City and Puebla.
- Tailor amenities and listing descriptions to appeal to the dominant Post-2000s (Gen Z/Alpha) demographic (e.g., highlight fast WiFi, smart home features, local guides).
- Highlight unique local experiences or amenities relevant to the primary guest profile.
- Consider seasonal promotions aligned with peak travel times for key origin markets.
Nearby Short-Term Rental Market Comparison
How does the Puebla Airbnb market stack up against its neighbors? Compare key performance metrics like average monthly revenue, ADR, and occupancy rates in surrounding areas to understand the broader regional STR landscape.
| Market | Active Properties | Monthly Revenue | Daily Rate | Avg. Occupancy |
|---|---|---|---|---|
| Tepeji del Rio de Ocampo | 11 | $2,125 | $315.80 | 27% |
| Yautepec de Zaragoza | 16 | $2,032 | $269.32 | 26% |
| Xalmolonco | 24 | $1,944 | $281.85 | 28% |
| Rancho San Diego | 21 | $1,707 | $276.31 | 26% |
| Lomas de Cocoyoc | 137 | $1,662 | $258.05 | 28% |
| La Tortuga | 71 | $1,658 | $239.12 | 28% |
| La Ladrillera | 28 | $1,655 | $277.53 | 26% |
| Atlatlahucan | 74 | $1,598 | $289.72 | 24% |
| Nepantla de Sor Juana Inés de la Cruz | 10 | $1,584 | $207.92 | 25% |
| Granjas Mérida | 22 | $1,571 | $240.97 | 30% |