Amealco de Bonfil Airbnb Market Analysis 2026: Short Term Rental Data & Vacation Rental Statistics in Querétaro, Mexico
Is Airbnb profitable in Amealco de Bonfil in 2026? Explore comprehensive Airbnb analytics for Amealco de Bonfil, Querétaro, Mexico to uncover income potential. This 2026 STR market report for Amealco de Bonfil, based on AirROI data from February 2025 to January 2026, reveals key trends in the niche market of 71 active listings.
Whether you're considering an Airbnb investment in Amealco de Bonfil, optimizing your existing vacation rental, or exploring rental arbitrage opportunities, understanding the Amealco de Bonfil Airbnb data is crucial. Leveraging the low regulation environment is key to maximizing your short term rental income potential. Let's dive into the specifics.
Key Amealco de Bonfil Airbnb Performance Metrics Overview
Monthly Airbnb Revenue Variations & Income Potential in Amealco de Bonfil (2026)
Understanding the monthly revenue variations for Airbnb listings in Amealco de Bonfil is key to maximizing your short term rental income potential. Seasonality significantly impacts earnings. Our analysis, based on data from the past 12 months, shows that the peak revenue month for STRs in Amealco de Bonfil is typically December, while May often presents the lowest earnings, highlighting opportunities for strategic pricing adjustments during shoulder and low seasons. Explore the typical Airbnb income in Amealco de Bonfil across different performance tiers:
- Best-in-class properties (Top 10%) achieve $1,768+ monthly, often utilizing dynamic pricing and superior guest experiences.
- Strong performing properties (Top 25%) earn $959 or more, indicating effective management and desirable locations/amenities.
- Typical properties (Median) generate around $506 per month, representing the average market performance.
- Entry-level properties (Bottom 25%) see earnings around $233, often with potential for optimization.
Average Monthly Airbnb Earnings Trend in Amealco de Bonfil
Amealco de Bonfil Airbnb Occupancy Rate Trends (2026)
Maximize your bookings by understanding the Amealco de Bonfil STR occupancy trends. Seasonal demand shifts significantly influence how often properties are booked. Typically, Decembersees the highest demand (peak season occupancy), while January experiences the lowest (low season). Effective strategies, like adjusting minimum stays or offering promotions, can boost occupancy during slower periods. Here's how different property tiers perform in Amealco de Bonfil:
- Best-in-class properties (Top 10%) achieve 45%+ occupancy, indicating high desirability and potentially optimized availability.
- Strong performing properties (Top 25%) maintain 30% or higher occupancy, suggesting good market fit and guest satisfaction.
- Typical properties (Median) have an occupancy rate around 18%.
- Entry-level properties (Bottom 25%) average 10% occupancy, potentially facing higher vacancy.
Average Monthly Occupancy Rate Trend in Amealco de Bonfil
Average Daily Rate (ADR) Airbnb Trends in Amealco de Bonfil (2026)
Effective short term rental pricing strategy in Amealco de Bonfil involves understanding monthly ADR fluctuations. The Average Daily Rate (ADR) for Airbnb in Amealco de Bonfil typically peaks in December and dips lowest during March. Leveraging Airbnb dynamic pricing tools or strategies based on this seasonality can significantly boost revenue. Here's a look at the typical nightly rates achieved:
- Best-in-class properties (Top 10%) command rates of $249+ per night, often due to premium features or locations.
- Strong performing properties (Top 25%) achieve nightly rates of $154 or more.
- Typical properties (Median) charge around $88 per night.
- Entry-level properties (Bottom 25%) earn around $52 per night.
Average Daily Rate (ADR) Trend by Month in Amealco de Bonfil
Get Live Amealco de Bonfil Market Intelligence 👇

Explore Real-time Analytics
Airbnb Seasonality Analysis & Trends in Amealco de Bonfil (2026)
Peak Season (December, August, January)
- Revenue averages $1,138 per month
- Occupancy rates average 24.9%
- Daily rates average $156
Shoulder Season
- Revenue averages $762 per month
- Occupancy maintains around 21.9%
- Daily rates hold near $151
Low Season (March, April, May)
- Revenue drops to average $572 per month
- Occupancy decreases to average 20.9%
- Daily rates adjust to average $139
Seasonality Insights for Amealco de Bonfil
- The Airbnb seasonality in Amealco de Bonfil shows highly seasonal trends requiring careful strategy. While the sections above show seasonal averages, it's also insightful to look at the extremes:
- During the high season, the absolute peak month showcases Amealco de Bonfil's highest earning potential, with monthly revenues capable of climbing to $1,405, occupancy reaching a high of 29.5%, and ADRs peaking at $166.
- Conversely, the slowest single month of the year, typically falling within the low season, marks the market's lowest point. In this month, revenue might dip to $517, occupancy could drop to 18.1%, and ADRs may adjust down to $137.
- Understanding both the seasonal averages and these monthly peaks and troughs in revenue, occupancy, and ADR is crucial for maximizing your Airbnb profit potential in Amealco de Bonfil.
Seasonal Strategies for Maximizing Profit
- Peak Season: Maximize revenue through premium pricing and potentially longer minimum stays. Ensure high availability.
- Low Season: Offer competitive pricing, special promotions (e.g., extended stay discounts), and flexible cancellation policies. Target off-season travelers like remote workers or budget-conscious guests.
- Shoulder Seasons: Implement dynamic pricing that balances peak and low rates. Target weekend travelers or specific events. Offer slightly more flexible terms than peak season.
- Regularly analyze your own performance against these Amealco de Bonfil seasonality benchmarks and adjust your pricing and availability strategy accordingly.
Best Areas for Airbnb Investment in Amealco de Bonfil (2026)
Exploring the top neighborhoods for short-term rentals in Amealco de Bonfil? This section highlights key areas, outlining why they are attractive for hosts and guests, along with notable local attractions. Consider these locations based on your target guest profile and investment strategy.
| Neighborhood / Area | Why Host Here? (Target Guests & Appeal) | Key Attractions & Landmarks |
|---|---|---|
| Centro Amealco | The charming town center of Amealco de Bonfil, featuring traditional Mexican architecture and a vibrant local culture. It's a great location for guests wanting to explore the town's history and lifestyle, as well as local markets and eateries. | Parroquia de San Miguel, Plaza Principal, Museo de la Ciudad, Mercado Municipal, Jardín de los 3 Pueblos |
| El Cielo | A scenic neighborhood ideal for nature lovers, located near beautiful landscapes and farmland. It's perfect for tourists seeking tranquility and outdoor activities, including hiking and nature experiences. | Cerro de las Mesas, Zona Arqueológica de Toluquilla, Camino Real, Explanada del Cielo |
| Las Trancas | A peaceful area known for its agricultural surroundings and rural charm. Great for guests looking for a more authentic Mexican rural experience away from the hustle and bustle. | Pueblo de las Trancas, Nature trails, Local farms, Cultural events |
| Tepeji del Río | Nearby town famous for its tranquil atmosphere and proximity to natural attractions. Ideal for families and travelers looking for a relaxing getaway. | Parque Ecológico, Templo de Tepeji, Cascadas de San José, Zonas recreativas |
| Santa María de la Paz | A tranquil residential area with stunning views and cultural richness. Attracts visitors who appreciate local festivities and community life. | Fiesta de San Juan, Local artisan markets, Parque de la Paz |
| La Luz | A picturesque neighborhood known for its warm hospitality and local traditions. It’s favored for its beautiful landscapes and cultural heritage. | Festividades locales, Artesanías locales, Miradores naturales |
| San Nicolás | A quaint village surrounded by nature, offering rustic charm and a close-knit community feel. Ideal for guests interested in local culture and community activities. | Plaza del pueblo, Eventos culturales, Feast of San Nicolás |
| Querétaro City | Just a short drive away from Amealco, this historical city is a UNESCO World Heritage site with a rich colonial history. It's a prime spot for tourists visiting the wider Querétaro region. | Aqueduct of Querétaro, Plaza de Armas, Templo de la Cruz, Museo Regional |
Understanding Airbnb License Requirements & STR Laws in Amealco de Bonfil (2026)
While Amealco de Bonfil, Querétaro, Mexico currently shows low STR regulations, specific Airbnb license requirements might still exist or change. Always verify the latest short term rental regulations and Airbnb license requirements directly with local government authorities for Amealco de Bonfil to ensure full compliance before hosting.
(Source: AirROI data, 2026, finding no licensed listings among those analyzed)
Top Performing Airbnb Properties in Amealco de Bonfil (2026)
Benchmark your potential! Explore examples of top-performing Airbnb properties in Amealco de Bonfilbased on Trailing Twelve Month (TTM) revenue. Analyze their characteristics, revenue, occupancy rate, and ADR to understand what drives success in this market.

Heavenly GETAWAY
Entire Place • 2 bedrooms
Rancho El Cielo
Entire Place • 7 bedrooms
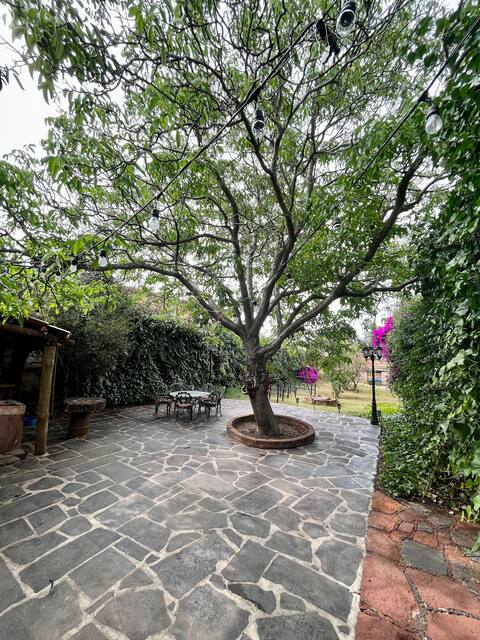
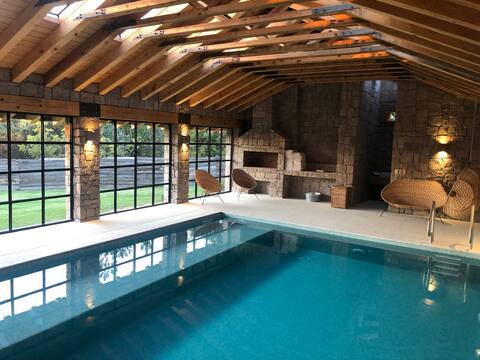
Spacious house with garden and fire pit in Zona Centro
Entire Place • 4 bedrooms

German cabin for 14 people.
Entire Place • 5 bedrooms

Cabin on a ranch with an outdoor Jacuzzi Spa.
Entire Place • 1 bedroom

La Cabaña Rosa
Entire Place • 1 bedroom
Note: Performance varies based on location, size, amenities, seasonality, and management quality. Data reflects the past 12 months.
Top Performing Airbnb Hosts in Amealco de Bonfil (2026)
Learn from the best! This table showcases top-performing Airbnb hosts in Amealco de Bonfil based on the number of properties managed and estimated total revenue over the past year. Analyze their scale and performance metrics.
| Host Name | Properties | Grossing Revenue | Stay Reviews | Avg Rating |
|---|---|---|---|---|
| Claudio | 2 | $80,806 | 74 | 4.88/5.0 |
| Leonel | 4 | $68,023 | 96 | 4.93/5.0 |
| Clemente | 4 | $50,433 | 46 | 4.75/5.0 |
| Elena Clementina | 8 | $29,995 | 80 | 4.93/5.0 |
| Karla | 1 | $28,921 | 49 | 4.67/5.0 |
| Naín Benjamín | 3 | $24,588 | 362 | 4.73/5.0 |
| María Fernanda | 4 | $22,726 | 92 | 4.92/5.0 |
| Paola | 2 | $21,710 | 49 | 4.73/5.0 |
| Lizsandra | 3 | $20,548 | 129 | 4.93/5.0 |
| Elena | 2 | $17,411 | 198 | 4.74/5.0 |
Analyzing the strategies of top hosts, such as their property selection, pricing, and guest communication, can offer valuable lessons for optimizing your own Airbnb operations in Amealco de Bonfil.
Dive Deeper: Advanced Amealco de Bonfil STR Market Data (2026)
Ready to unlock more insights? AirROI provides access to advanced metrics and comprehensive Airbnb data for Amealco de Bonfil. Explore detailed analytics beyond this report to refine your investment strategy, optimize pricing, and maximize your vacation rental profits.
Explore Advanced MetricsAmealco de Bonfil Short-Term Rental Market Composition (2026): Property & Room Types
Room Type Distribution
Property Type Distribution
Market Composition Insights for Amealco de Bonfil
- The Amealco de Bonfil Airbnb market composition is heavily skewed towards Entire Home/Apt listings, which make up 87.3% of the 71 active rentals. This indicates strong guest preference for privacy and space.
- Looking at the property type distribution in Amealco de Bonfil, Outdoor/Unique properties are the most common (52.1%), reflecting the local real estate landscape.
- Houses represent a significant 22.5% portion, catering likely to families or larger groups.
- The presence of 12.7% Hotel/Boutique listings indicates integration with traditional hospitality.
- Smaller segments like others (combined 1.4%) offer potential for unique stay experiences.
Amealco de Bonfil Airbnb Room Capacity Analysis (2026): Bedroom Distribution
Distribution of Listings by Number of Bedrooms
Room Capacity Insights for Amealco de Bonfil
- The dominant room capacity in Amealco de Bonfil is 1 bedroom listings, making up 36.6% of the market. This suggests a strong demand for properties suitable for couples or solo travelers.
- Together, 1 bedroom and 2 bedrooms properties represent 64.8% of the active Airbnb listings in Amealco de Bonfil, indicating a high concentration in these sizes.
- A significant 28.2% of listings offer 3+ bedrooms, catering to larger groups and families seeking more space in Amealco de Bonfil.
Amealco de Bonfil Vacation Rental Guest Capacity Trends (2026)
Distribution of Listings by Guest Capacity
Guest Capacity Insights for Amealco de Bonfil
- The most common guest capacity trend in Amealco de Bonfil vacation rentals is listings accommodating 8+ guests (23.9%). This suggests the primary traveler segment is likely larger groups.
- Properties designed for 8+ guests and 4 guests dominate the Amealco de Bonfil STR market, accounting for 47.8% of listings.
- 45.0% of properties accommodate 6+ guests, serving the market segment for larger families or group travel in Amealco de Bonfil.
- On average, properties in Amealco de Bonfil are equipped to host 4.8 guests.
Amealco de Bonfil Airbnb Booking Patterns (2026): Available vs. Booked Days
Available Days Distribution
Booked Days Distribution
Booking Pattern Insights for Amealco de Bonfil
- The most common availability pattern in Amealco de Bonfil falls within the 271-366 days range, representing 80.3% of listings. This suggests many properties have significant open periods on their calendars.
- Approximately 98.6% of listings show high availability (181+ days open annually), indicating potential for increased bookings or specific owner usage patterns.
- For booked days, the 31-90 days range is most frequent in Amealco de Bonfil (54.9%), reflecting common guest stay durations or potential owner blocking patterns.
- A notable 1.4% of properties secure long booking periods (181+ days booked per year), highlighting successful long-term rental strategies or significant owner usage.
Amealco de Bonfil Airbnb Minimum Stay Requirements Analysis
Distribution of Listings by Minimum Night Requirement
1 Night
64 listings
90.1% of total
2 Nights
4 listings
5.6% of total
3 Nights
1 listings
1.4% of total
30+ Nights
2 listings
2.8% of total
Key Insights
- The most prevalent minimum stay requirement in Amealco de Bonfil is 1 Night, adopted by 90.1% of listings. This highlights the market's preference for shorter, flexible bookings.
- A strong majority (95.7%) of the Amealco de Bonfil Airbnb data shows acceptance of very short stays (1-2 nights), indicating a dynamic, high-turnover market.
- Dedicated monthly rentals (30+ nights) represent a small niche (2.8%), possibly an untapped area for hosts.
Recommendations
- Align with the market by considering a 1 Night minimum stay, as 90.1% of Amealco de Bonfil hosts use this setting.
- Adjust minimum nights based on seasonality – potentially shorter during low season and longer during peak demand periods in Amealco de Bonfil.
Amealco de Bonfil Airbnb Cancellation Policy Trends Analysis (2026)
Flexible
29 listings
40.8% of total
Moderate
22 listings
31% of total
Firm
12 listings
16.9% of total
Strict
8 listings
11.3% of total
Cancellation Policy Insights for Amealco de Bonfil
- The prevailing Airbnb cancellation policy trend in Amealco de Bonfil is Flexible, used by 40.8% of listings.
- The market strongly favors guest-friendly terms, with 71.8% of listings offering Flexible or Moderate policies. This suggests guests in Amealco de Bonfil may expect booking flexibility.
Recommendations for Hosts
- Consider adopting a Flexible policy to align with the 40.8% market standard in Amealco de Bonfil.
- Using a Strict policy might deter some guests, as only 11.3% of listings use it. Evaluate if potential revenue protection outweighs possible lower booking rates.
- Regularly review your cancellation policy against competitors and market demand shifts in Amealco de Bonfil.
Amealco de Bonfil STR Booking Lead Time Analysis (2026)
Average Booking Lead Time by Month
Booking Lead Time Insights for Amealco de Bonfil
- The overall average booking lead time for vacation rentals in Amealco de Bonfil is 32 days.
- Guests book furthest in advance for stays during December (average 45 days), likely coinciding with peak travel demand or local events.
- The shortest booking windows occur for stays in June (average 20 days), indicating more last-minute travel plans during this time.
- Seasonally, Fall (42 days avg.) sees the longest lead times, while Spring (24 days avg.) has the shortest, reflecting typical travel planning cycles.
Recommendations for Hosts
- Use the overall average lead time (32 days) as a baseline for your pricing and availability strategy in Amealco de Bonfil.
- For December stays, consider implementing length-of-stay discounts or slightly higher rates for bookings made less than 45 days out to capitalize on advance planning.
- Target marketing efforts for the Fall season well in advance (at least 42 days) to capture early planners.
- Monitor your own booking lead times against these Amealco de Bonfil averages to identify opportunities for dynamic pricing adjustments.
Popular & Essential Airbnb Amenities in Amealco de Bonfil (2026)
Amenity Prevalence
Amenity Insights for Amealco de Bonfil
- Popular amenities like Hot water, Free parking on premises, Wifi are common but not universal. Offering these can provide a competitive edge.
- Warning: Wifi is not universally provided but is considered essential globally. Ensure reliable Wifi is offered.
Recommendations for Hosts
- Consider adding popular differentiators like Hot water or Free parking on premises to increase appeal.
- Highlight unique or less common amenities you offer (e.g., hot tub, dedicated workspace, EV charger) in your listing description and photos.
- Regularly check competitor amenities in Amealco de Bonfil to stay competitive.
Amealco de Bonfil Airbnb Guest Demographics & Profile Analysis (2026)
Guest Profile Summary for Amealco de Bonfil
- The typical guest profile for Airbnb in Amealco de Bonfil consists of primarily domestic travelers (97%), often arriving from nearby Santiago de Querétaro, typically belonging to the Post-2000s (Gen Z/Alpha) group (50%), primarily speaking Spanish or English.
- Domestic travelers account for 96.6% of guests.
- Key international markets include Mexico (96.6%) and United States (1.7%).
- Top languages spoken are Spanish (53%) followed by English (37.1%).
- A significant demographic segment is the Post-2000s (Gen Z/Alpha) group, representing 50% of guests.
Recommendations for Hosts
- Target domestic marketing efforts towards travelers from Santiago de Querétaro and Mexico City.
- Tailor amenities and listing descriptions to appeal to the dominant Post-2000s (Gen Z/Alpha) demographic (e.g., highlight fast WiFi, smart home features, local guides).
- Highlight unique local experiences or amenities relevant to the primary guest profile.
- Consider seasonal promotions aligned with peak travel times for key origin markets.
Nearby Short-Term Rental Market Comparison
How does the Amealco de Bonfil Airbnb market stack up against its neighbors? Compare key performance metrics like average monthly revenue, ADR, and occupancy rates in surrounding areas to understand the broader regional STR landscape.
| Market | Active Properties | Monthly Revenue | Daily Rate | Avg. Occupancy |
|---|---|---|---|---|
| El Santuario | 44 | $2,583 | $420.27 | 25% |
| Cerro Gordo | 38 | $2,183 | $438.64 | 21% |
| Tepeji del Rio de Ocampo | 11 | $2,125 | $315.80 | 27% |
| Avandaro | 212 | $1,892 | $411.24 | 24% |
| La Tortuga | 71 | $1,658 | $239.12 | 28% |
| Alcocer | 11 | $1,642 | $271.32 | 21% |
| San Miguel de Allende | 2,169 | $1,470 | $194.10 | 32% |
| Ejido San Gaspar | 43 | $1,386 | $267.18 | 20% |
| Lomas de Comanjilla | 21 | $1,382 | $183.03 | 27% |
| Cuauhtémoc | 13 | $1,344 | $93.02 | 54% |