La Tortuga Airbnb Market Analysis 2026: Short Term Rental Data & Vacation Rental Statistics in Querétaro, Mexico
Is Airbnb profitable in La Tortuga in 2026? Explore comprehensive Airbnb analytics for La Tortuga, Querétaro, Mexico to uncover income potential. This 2026 STR market report for La Tortuga, based on AirROI data from February 2025 to January 2026, reveals key trends in the niche market of 71 active listings.
Whether you're considering an Airbnb investment in La Tortuga, optimizing your existing vacation rental, or exploring rental arbitrage opportunities, understanding the La Tortuga Airbnb data is crucial. Leveraging the low regulation environment is key to maximizing your short term rental income potential. Let's dive into the specifics.
Key La Tortuga Airbnb Performance Metrics Overview
Monthly Airbnb Revenue Variations & Income Potential in La Tortuga (2026)
Understanding the monthly revenue variations for Airbnb listings in La Tortuga is key to maximizing your short term rental income potential. Seasonality significantly impacts earnings. Our analysis, based on data from the past 12 months, shows that the peak revenue month for STRs in La Tortuga is typically August, while February often presents the lowest earnings, highlighting opportunities for strategic pricing adjustments during shoulder and low seasons. Explore the typical Airbnb income in La Tortuga across different performance tiers:
- Best-in-class properties (Top 10%) achieve $4,421+ monthly, often utilizing dynamic pricing and superior guest experiences.
- Strong performing properties (Top 25%) earn $3,122 or more, indicating effective management and desirable locations/amenities.
- Typical properties (Median) generate around $1,715 per month, representing the average market performance.
- Entry-level properties (Bottom 25%) see earnings around $892, often with potential for optimization.
Average Monthly Airbnb Earnings Trend in La Tortuga
La Tortuga Airbnb Occupancy Rate Trends (2026)
Maximize your bookings by understanding the La Tortuga STR occupancy trends. Seasonal demand shifts significantly influence how often properties are booked. Typically, Aprilsees the highest demand (peak season occupancy), while January experiences the lowest (low season). Effective strategies, like adjusting minimum stays or offering promotions, can boost occupancy during slower periods. Here's how different property tiers perform in La Tortuga:
- Best-in-class properties (Top 10%) achieve 61%+ occupancy, indicating high desirability and potentially optimized availability.
- Strong performing properties (Top 25%) maintain 45% or higher occupancy, suggesting good market fit and guest satisfaction.
- Typical properties (Median) have an occupancy rate around 27%.
- Entry-level properties (Bottom 25%) average 12% occupancy, potentially facing higher vacancy.
Average Monthly Occupancy Rate Trend in La Tortuga
Average Daily Rate (ADR) Airbnb Trends in La Tortuga (2026)
Effective short term rental pricing strategy in La Tortuga involves understanding monthly ADR fluctuations. The Average Daily Rate (ADR) for Airbnb in La Tortuga typically peaks in August and dips lowest during September. Leveraging Airbnb dynamic pricing tools or strategies based on this seasonality can significantly boost revenue. Here's a look at the typical nightly rates achieved:
- Best-in-class properties (Top 10%) command rates of $414+ per night, often due to premium features or locations.
- Strong performing properties (Top 25%) achieve nightly rates of $286 or more.
- Typical properties (Median) charge around $203 per night.
- Entry-level properties (Bottom 25%) earn around $155 per night.
Average Daily Rate (ADR) Trend by Month in La Tortuga
Get Live La Tortuga Market Intelligence 👇

Explore Real-time Analytics
Airbnb Seasonality Analysis & Trends in La Tortuga (2026)
Peak Season (August, July, December)
- Revenue averages $2,538 per month
- Occupancy rates average 34.1%
- Daily rates average $258
Shoulder Season
- Revenue averages $2,202 per month
- Occupancy maintains around 32.1%
- Daily rates hold near $251
Low Season (January, February, September)
- Revenue drops to average $1,642 per month
- Occupancy decreases to average 24.0%
- Daily rates adjust to average $247
Seasonality Insights for La Tortuga
- The Airbnb seasonality in La Tortuga shows moderate seasonality with distinct peak and low periods. While the sections above show seasonal averages, it's also insightful to look at the extremes:
- During the high season, the absolute peak month showcases La Tortuga's highest earning potential, with monthly revenues capable of climbing to $2,594, occupancy reaching a high of 38.0%, and ADRs peaking at $262.
- Conversely, the slowest single month of the year, typically falling within the low season, marks the market's lowest point. In this month, revenue might dip to $1,571, occupancy could drop to 20.8%, and ADRs may adjust down to $241.
- Understanding both the seasonal averages and these monthly peaks and troughs in revenue, occupancy, and ADR is crucial for maximizing your Airbnb profit potential in La Tortuga.
Seasonal Strategies for Maximizing Profit
- Peak Season: Maximize revenue through premium pricing and potentially longer minimum stays. Ensure high availability.
- Low Season: Offer competitive pricing, special promotions (e.g., extended stay discounts), and flexible cancellation policies. Target off-season travelers like remote workers or budget-conscious guests.
- Shoulder Seasons: Implement dynamic pricing that balances peak and low rates. Target weekend travelers or specific events. Offer slightly more flexible terms than peak season.
- Regularly analyze your own performance against these La Tortuga seasonality benchmarks and adjust your pricing and availability strategy accordingly.
Best Areas for Airbnb Investment in La Tortuga (2026)
Exploring the top neighborhoods for short-term rentals in La Tortuga? This section highlights key areas, outlining why they are attractive for hosts and guests, along with notable local attractions. Consider these locations based on your target guest profile and investment strategy.
| Neighborhood / Area | Why Host Here? (Target Guests & Appeal) | Key Attractions & Landmarks |
|---|---|---|
| Centro Historico | The historic center of Querétaro, filled with colonial architecture, cultural sites, and vibrant street life. A prime spot for travelers wanting to explore local history and culture. | Querétaro Aqueduct, Plaza de Armas, Templo de Santa Rosa de Viterbo, Museo de Arte de Querétaro, Cerro de las Campanas |
| Juriquilla | An upscale residential area known for its modern developments, golf courses, and proximity to the city center. Ideal for families and those seeking a tranquil environment close to amenities. | Antea Lifestyle Center, Club de Golf Juriquilla, Cinemex Juriquilla, Juriquilla Dam, Universidad Autónoma de Querétaro |
| El Marqués | A growing municipality that offers natural landscapes and a quieter lifestyle while being near Querétaro's urban amenities. Great for nature lovers and those seeking peace. | Parque Nacional Sierra Gorda, El Mirador, Templo de la Santa Cruz, Naturaleza Viva, La Cañada |
| Querétaro's Vineyards | The region is known for its wine production and vineyards, attracting tourists interested in wine tasting and rural tourism. Perfect for a unique getaway experience. | La Redonda Vineyard, Freixenet México, Cavas Freixenet, Vinedos La Margarita, El Salitre |
| Cerro de las Campanas | A historical site with great views of the city, and a place of significance in Mexican history. Attracts visitors for both its beauty and cultural importance. | Cerro de las Campanas Park, Observatory, Historical monuments, Outdoor trails, Picnic areas |
| Santa Rosa | A charming neighborhood with a mix of traditional and modern architecture, offering a unique local vibe that resonates with both tourists and residents alike. | Plaza de Santa Rosa, Templo de Santa Rosa, Local markets, Cultural events, Artisan shops |
| San Miguelito | A vibrant local neighborhood that provides an authentic Querétaro experience, known for its rich cultural life and local cuisine. Ideal for travelers seeking local interactions. | Mercado de San Miguelito, Local food stalls, Cultural performances, Street art, Community events |
| Pueblo de La Cañada | A quaint village known for its scenic beauty and friendliness. Offers a peaceful retreat from city life and experiences local traditions. | Local festivals, Nature trails, Community gatherings, Artisan shops, Scenic viewpoints |
Understanding Airbnb License Requirements & STR Laws in La Tortuga (2026)
While La Tortuga, Querétaro, Mexico currently shows low STR regulations, specific Airbnb license requirements might still exist or change. Always verify the latest short term rental regulations and Airbnb license requirements directly with local government authorities for La Tortuga to ensure full compliance before hosting.
(Source: AirROI data, 2026, finding no licensed listings among those analyzed)
Top Performing Airbnb Properties in La Tortuga (2026)
Benchmark your potential! Explore examples of top-performing Airbnb properties in La Tortugabased on Trailing Twelve Month (TTM) revenue. Analyze their characteristics, revenue, occupancy rate, and ADR to understand what drives success in this market.
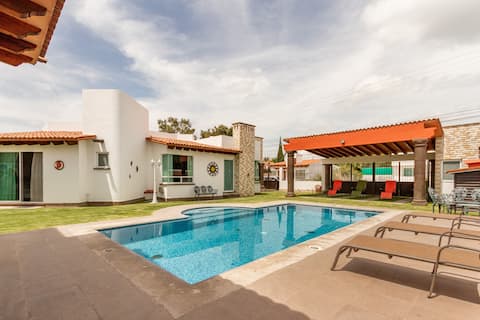
Casa Alessa with pool in Tequisquiapan
Entire Place • 4 bedrooms
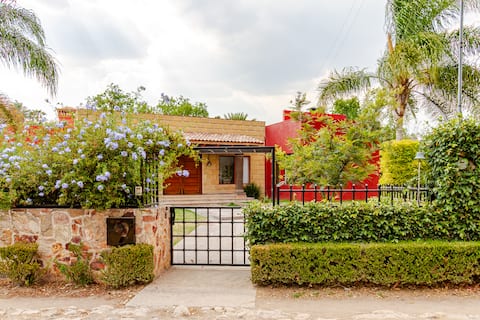
Beautiful House. Tequisquiapan.
Entire Place • 4 bedrooms
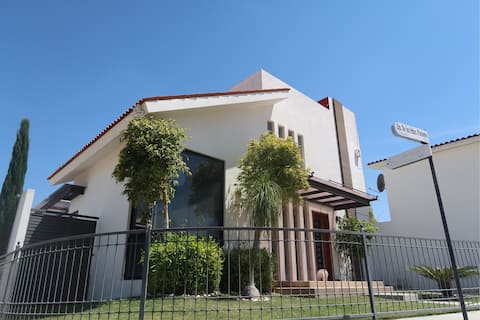
Exclusive House and Cabin with Pool.
Entire Place • 5 bedrooms

Casa Quinta 8 Tequisquiapan 8 rooms
Entire Place • 8 bedrooms

Quinta Lily: Fireplace, Pool, Grill,
Entire Place • 3 bedrooms

Posada Tres Garcia / Tequisquiapan
Entire Place • 4 bedrooms
Note: Performance varies based on location, size, amenities, seasonality, and management quality. Data reflects the past 12 months.
Top Performing Airbnb Hosts in La Tortuga (2026)
Learn from the best! This table showcases top-performing Airbnb hosts in La Tortuga based on the number of properties managed and estimated total revenue over the past year. Analyze their scale and performance metrics.
| Host Name | Properties | Grossing Revenue | Stay Reviews | Avg Rating |
|---|---|---|---|---|
| Benjamín | 3 | $90,818 | 380 | 4.80/5.0 |
| Luis | 2 | $87,281 | 261 | 4.94/5.0 |
| Ignacio | 2 | $86,092 | 201 | 4.83/5.0 |
| Gabriela | 2 | $67,340 | 237 | 4.94/5.0 |
| Ale | 1 | $61,958 | 188 | 4.99/5.0 |
| Martha | 1 | $61,121 | 73 | 4.99/5.0 |
| Miguel | 2 | $53,645 | 138 | 4.80/5.0 |
| Marta | 3 | $50,767 | 47 | 4.69/5.0 |
| Elvira | 1 | $49,499 | 143 | 4.93/5.0 |
| Rosa Hilda | 1 | $49,004 | 198 | 4.85/5.0 |
Analyzing the strategies of top hosts, such as their property selection, pricing, and guest communication, can offer valuable lessons for optimizing your own Airbnb operations in La Tortuga.
Dive Deeper: Advanced La Tortuga STR Market Data (2026)
Ready to unlock more insights? AirROI provides access to advanced metrics and comprehensive Airbnb data for La Tortuga. Explore detailed analytics beyond this report to refine your investment strategy, optimize pricing, and maximize your vacation rental profits.
Explore Advanced MetricsLa Tortuga Short-Term Rental Market Composition (2026): Property & Room Types
Room Type Distribution
Property Type Distribution
Market Composition Insights for La Tortuga
- The La Tortuga Airbnb market composition is heavily skewed towards Entire Home/Apt listings, which make up 95.8% of the 71 active rentals. This indicates strong guest preference for privacy and space.
- Looking at the property type distribution in La Tortuga, House properties are the most common (88.7%), reflecting the local real estate landscape.
- Houses represent a significant 88.7% portion, catering likely to families or larger groups.
- Smaller segments like hotel/boutique, apartment/condo (combined 4.2%) offer potential for unique stay experiences.
La Tortuga Airbnb Room Capacity Analysis (2026): Bedroom Distribution
Distribution of Listings by Number of Bedrooms
Room Capacity Insights for La Tortuga
- The dominant room capacity in La Tortuga is 3 bedrooms listings, making up 33.8% of the market. This suggests a strong demand for properties suitable for families or small groups.
- Together, 3 bedrooms and 4 bedrooms properties represent 63.4% of the active Airbnb listings in La Tortuga, indicating a high concentration in these sizes.
- A significant 77.5% of listings offer 3+ bedrooms, catering to larger groups and families seeking more space in La Tortuga.
La Tortuga Vacation Rental Guest Capacity Trends (2026)
Distribution of Listings by Guest Capacity
Guest Capacity Insights for La Tortuga
- The most common guest capacity trend in La Tortuga vacation rentals is listings accommodating 8+ guests (73.2%). This suggests the primary traveler segment is likely larger groups.
- Properties designed for 8+ guests and 6 guests dominate the La Tortuga STR market, accounting for 81.7% of listings.
- 84.5% of properties accommodate 6+ guests, serving the market segment for larger families or group travel in La Tortuga.
- On average, properties in La Tortuga are equipped to host 7.0 guests.
La Tortuga Airbnb Booking Patterns (2026): Available vs. Booked Days
Available Days Distribution
Booked Days Distribution
Booking Pattern Insights for La Tortuga
- The most common availability pattern in La Tortuga falls within the 271-366 days range, representing 60.6% of listings. This suggests many properties have significant open periods on their calendars.
- Approximately 91.6% of listings show high availability (181+ days open annually), indicating potential for increased bookings or specific owner usage patterns.
- For booked days, the 91-180 days range is most frequent in La Tortuga (33.8%), reflecting common guest stay durations or potential owner blocking patterns.
- A notable 8.5% of properties secure long booking periods (181+ days booked per year), highlighting successful long-term rental strategies or significant owner usage.
La Tortuga Airbnb Minimum Stay Requirements Analysis
Distribution of Listings by Minimum Night Requirement
1 Night
32 listings
45.1% of total
2 Nights
22 listings
31% of total
3 Nights
1 listings
1.4% of total
30+ Nights
16 listings
22.5% of total
Key Insights
- The most prevalent minimum stay requirement in La Tortuga is 1 Night, adopted by 45.1% of listings. This highlights the market's preference for shorter, flexible bookings.
- A strong majority (76.1%) of the La Tortuga Airbnb data shows acceptance of very short stays (1-2 nights), indicating a dynamic, high-turnover market.
- A significant segment (22.5%) caters to monthly stays (30+ nights) in La Tortuga, pointing to opportunities in the extended-stay market.
Recommendations
- Align with the market by considering a 1 Night minimum stay, as 45.1% of La Tortuga hosts use this setting.
- Explore offering discounts for stays of 30+ nights to attract the 22.5% of the market seeking extended stays.
- Adjust minimum nights based on seasonality – potentially shorter during low season and longer during peak demand periods in La Tortuga.
La Tortuga Airbnb Cancellation Policy Trends Analysis (2026)
Flexible
24 listings
34.3% of total
Moderate
23 listings
32.9% of total
Firm
14 listings
20% of total
Strict
9 listings
12.9% of total
Cancellation Policy Insights for La Tortuga
- The prevailing Airbnb cancellation policy trend in La Tortuga is Flexible, used by 34.3% of listings.
- There's a relatively balanced mix between guest-friendly (67.2%) and stricter (32.9%) policies, offering choices for different guest needs.
Recommendations for Hosts
- Consider adopting a Flexible policy to align with the 34.3% market standard in La Tortuga.
- Using a Strict policy might deter some guests, as only 12.9% of listings use it. Evaluate if potential revenue protection outweighs possible lower booking rates.
- Regularly review your cancellation policy against competitors and market demand shifts in La Tortuga.
La Tortuga STR Booking Lead Time Analysis (2026)
Average Booking Lead Time by Month
Booking Lead Time Insights for La Tortuga
- The overall average booking lead time for vacation rentals in La Tortuga is 24 days.
- Guests book furthest in advance for stays during December (average 50 days), likely coinciding with peak travel demand or local events.
- The shortest booking windows occur for stays in February (average 10 days), indicating more last-minute travel plans during this time.
- Seasonally, Winter (26 days avg.) sees the longest lead times, while Summer (21 days avg.) has the shortest, reflecting typical travel planning cycles.
Recommendations for Hosts
- Use the overall average lead time (24 days) as a baseline for your pricing and availability strategy in La Tortuga.
- For December stays, consider implementing length-of-stay discounts or slightly higher rates for bookings made less than 50 days out to capitalize on advance planning.
- During February, focus on last-minute booking availability and promotions, as guests book with very short notice (10 days avg.).
- Target marketing efforts for the Winter season well in advance (at least 26 days) to capture early planners.
- Monitor your own booking lead times against these La Tortuga averages to identify opportunities for dynamic pricing adjustments.
Popular & Essential Airbnb Amenities in La Tortuga (2026)
Amenity Prevalence
Amenity Insights for La Tortuga
- Essential amenities in La Tortuga that guests expect include: TV, Wifi. Lacking these (any) could significantly impact bookings.
- Popular amenities like Kitchen, Hot water, Free parking on premises are common but not universal. Offering these can provide a competitive edge.
Recommendations for Hosts
- Ensure your listing includes all essential amenities for La Tortuga: TV, Wifi.
- Prioritize adding missing essentials: TV, Wifi.
- Consider adding popular differentiators like Kitchen or Hot water to increase appeal.
- Highlight unique or less common amenities you offer (e.g., hot tub, dedicated workspace, EV charger) in your listing description and photos.
- Regularly check competitor amenities in La Tortuga to stay competitive.
La Tortuga Airbnb Guest Demographics & Profile Analysis (2026)
Guest Profile Summary for La Tortuga
- The typical guest profile for Airbnb in La Tortuga consists of primarily domestic travelers (95%), often arriving from nearby Mexico City, typically belonging to the Post-2000s (Gen Z/Alpha) group (50%), primarily speaking Spanish or English.
- Domestic travelers account for 95.4% of guests.
- Key international markets include Mexico (95.4%) and United States (3.3%).
- Top languages spoken are Spanish (52.1%) followed by English (39.6%).
- A significant demographic segment is the Post-2000s (Gen Z/Alpha) group, representing 50% of guests.
Recommendations for Hosts
- Target domestic marketing efforts towards travelers from Mexico City and Santiago de Querétaro.
- Tailor amenities and listing descriptions to appeal to the dominant Post-2000s (Gen Z/Alpha) demographic (e.g., highlight fast WiFi, smart home features, local guides).
- Highlight unique local experiences or amenities relevant to the primary guest profile.
- Consider seasonal promotions aligned with peak travel times for key origin markets.
Nearby Short-Term Rental Market Comparison
How does the La Tortuga Airbnb market stack up against its neighbors? Compare key performance metrics like average monthly revenue, ADR, and occupancy rates in surrounding areas to understand the broader regional STR landscape.
| Market | Active Properties | Monthly Revenue | Daily Rate | Avg. Occupancy |
|---|---|---|---|---|
| El Santuario | 44 | $2,583 | $420.27 | 25% |
| Cerro Gordo | 38 | $2,183 | $438.64 | 21% |
| Tepeji del Rio de Ocampo | 11 | $2,125 | $315.80 | 27% |
| Avandaro | 212 | $1,892 | $411.24 | 24% |
| Alcocer | 11 | $1,642 | $271.32 | 21% |
| San Miguel de Allende | 2,169 | $1,470 | $194.10 | 32% |
| Ejido San Gaspar | 43 | $1,386 | $267.18 | 20% |
| Cuauhtémoc | 13 | $1,344 | $93.02 | 54% |
| Juárez | 44 | $1,317 | $98.72 | 54% |
| Tzibantzá | 12 | $1,298 | $232.99 | 23% |